


Explore More Possibilities for Your Business
Full-cycle scenario construction to meet your needs from App research, development, and release to operation.
Ready for your soaring growth
On April 27, 2026, FoxData's Store Monitor captured a rare and significant market event: across both the App Store and Google Play in the United States, the number of apps losing keyword rankings dropped to absolute zero — a sharp reversal from the 16,170 ranking losses recorded just the day before. Against a backdrop of nearly 1.87 million apps competing for user attention, this data point is anything but routine.
This report dissects six key indicators from that snapshot, examines what each signal means for developers, ASO practitioners, and growth teams, and maps actionable strategies onto each finding — drawing directly on FoxData's app analytics and ASO tools.
The table below summarizes all six Store Monitor metrics for April 27, 2026, together with their day-over-day changes and a one-line interpretation of what each movement signals.
|
Metric |
Value |
Day-over-Day |
Signal |
|
Total Apps |
1,865,903 |
+725 |
Market is still growing; competition density at historic highs |
|
Released Apps |
1,072 |
−124 |
New entry pace slowing; developers are increasingly selective |
|
Removed Apps |
1,365 |
−252 |
Removals still outpace releases (net −293); market in net contraction |
|
Charts Dropped Apps |
91 |
−19 |
Chart volatility easing slightly; chart positions more stable |
|
Apps Losing Keyword Rankings |
0 |
−16,170 |
Keyword ecosystem reset to zero — the standout signal of the day |
|
Pre-order Apps |
2,121 |
+13 |
Developer pipeline confidence remains solid; pre-launch momentum building |
Table 1. US App Store + Google Play Store Monitor, April 27, 2026 (FoxData)
April 27 registered 1,072 new releases — a day-over-day decline of 124. Looking at the four-week Release Monitor chart below, the broader trend is unmistakable: after a surge that peaked at 2,386 total releases on April 18, the market has been pulling back steadily.
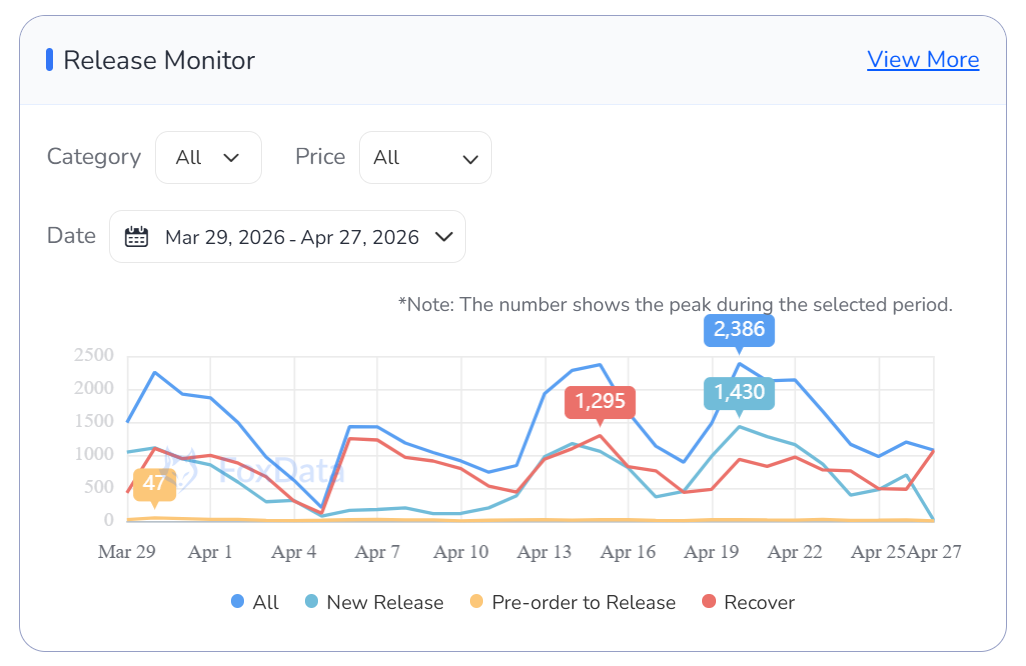
Fig. 1 — Release Monitor (All categories, All prices): Mar 29 – Apr 27, 2026 | FoxData
The chart tracks four release categories: All Releases (blue), New Releases (light blue), Pre-order to Release (gold), and Recoveries (red). Key observations:
|
Series |
Peak (30-day window) |
Apr 27 Reading |
|
All Releases |
2,386 (Apr 18) |
1,072 — multi-week low |
|
New Releases |
1,430 (Apr 19) |
Below 500 — entering trough |
|
Pre-order to Release |
47 (late-March baseline) |
Near zero |
|
Recoveries |
1,295 (Apr 13) |
~1,000 — stabilising |
Table 2. Release Monitor series comparison, Mar 29 – Apr 27, 2026
A thinning release pipeline is a double-edged sword. Fewer new apps reduce the daily noise that pushes established apps down search results — but they also reflect a maturing market where developers self-select only the most viable products. Teams considering a launch should use FoxData's keyword research tools to identify timing windows when release volumes drop and organic keyword positions are easier to capture.
With 1,365 removals versus 1,072 releases, April 27 ended with a net loss of 293 apps — a quiet but structurally important signal. The Remove Monitor chart tells the fuller story:
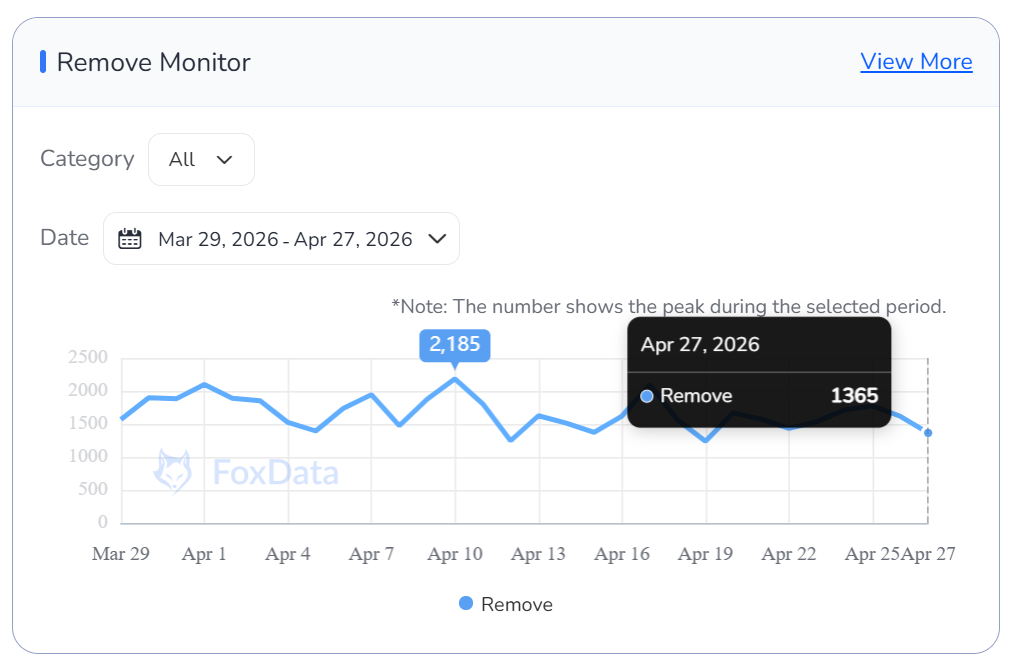
Fig. 2 — Remove Monitor (All categories): Mar 29 – Apr 27, 2026 | FoxData
A Month of Elevated Churn
The 30-day average removal rate has hovered between 1,400 and 2,100 — with a peak of 2,185 removals on April 10. While the April 27 reading of 1,365 sits at the lower end of this band, it is still meaningfully above the release figure. Sustained net-negative app flow typically indicates one or more of the following:
|
Driver |
Implication for ASO Teams |
|
Platform policy enforcement waves |
Low-quality or non-compliant apps cleared out; quality threshold rising |
|
Developer abandonment of under-performing apps |
Keyword positions previously held by abandoned apps become contestable |
|
Consolidation by larger publishers |
Niche long-tail slots open up for agile independent developers |
Every removed app vacates keyword coverage — particularly for long-tail, low-competition terms where the departed app may have held positions 4–10. FoxData's Market Segmentation tools let you slice removal data by category to identify which verticals are experiencing the heaviest churn, revealing the fastest paths to ranking gains.
This is the headline finding of the entire dataset. On April 26, more than 16,170 apps lost keyword ranking positions. On April 27, that number was exactly zero. The Clearing List/Word Monitor chart captures this dramatic reversal:

Fig. 3 — Clearing List/Word Monitor (All categories): Mar 29 – Apr 27, 2026 | FoxData
The green line (Keywords Dropped Apps) dominates the chart: it peaked at approximately 50,047 on April 1, fluctuated through mid-April before landing at a secondary low of 221 on April 16, then collapsed to zero on April 27. The blue line (Charts Dropped Apps) has moved in a much tighter band, registering 91 on April 27.
Three credible explanations for a keyword-loss reset to zero:
|
Hypothesis |
What to Watch For |
|
Algorithm stabilisation window |
Ranking positions lock in; keyword monitoring data becomes highly reliable for baseline-setting |
|
Post-wave data catch-up |
Systems reconciling after high-churn days; next 48–72 hrs may see a rebound in losses |
|
Mass metadata re-optimisation |
Developers responded quickly to the Apr 26 drop; successful updates temporarily pause further losses |
Table 4. Interpretations of the April 27 zero-loss keyword event
When keyword losses hit zero, the competitive landscape effectively freezes. This creates a rare opportunity: rankings captured right now represent true organic strength, uncontaminated by algorithm noise. ASO teams should use this window to:
The Keyword Searching Results Change Rate widget tracks Top 10 position turnover on an hourly basis. The April 25–27 window reveals a consistent daily pattern:
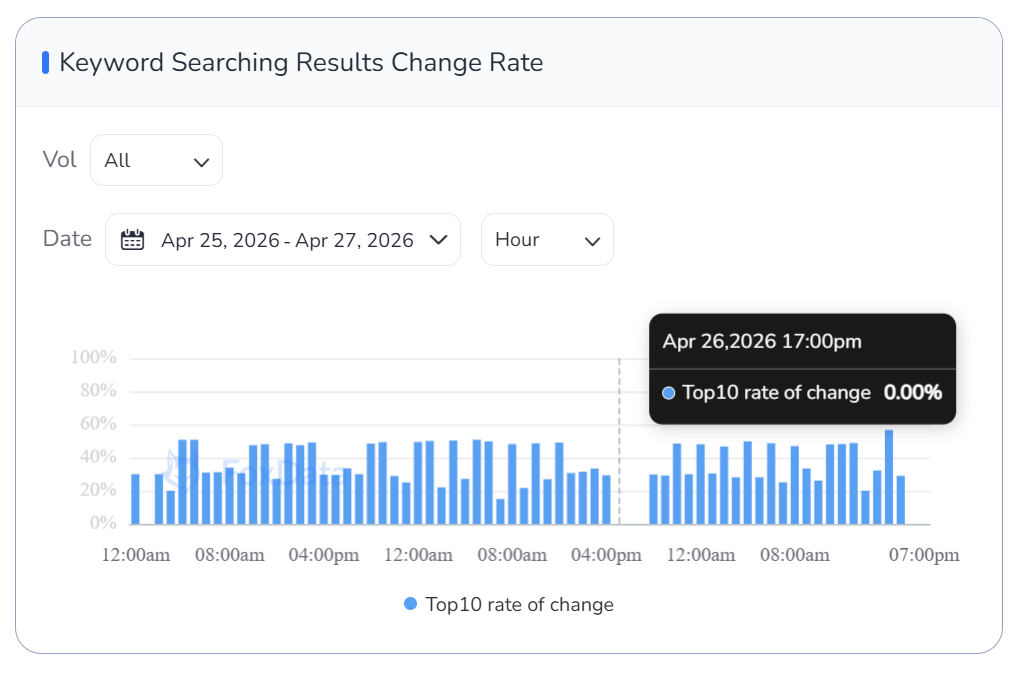
Fig. 4 — Keyword Searching Results Change Rate (Top 10, hourly): Apr 25–27, 2026 | FoxData
The data shows a notable dip to 0.00% at April 26, 17:00 — a brief mid-afternoon stillness in an otherwise active day of 20–55% hourly change rates. Change rates typically spike in the early morning hours (midnight to 8 AM) as batch indexing runs, then moderate through business hours before a secondary peak in the evening. Understanding this intra-day rhythm allows paid teams to time Apple Search Ads bids around natural organic movement:
|
Time Window |
Keyword Change Rate |
Recommended Action |
|
Midnight – 8 AM |
High (30–55%) |
Monitor — avoid major metadata deploys during indexing |
|
8 AM – 4 PM |
Moderate (20–40%) |
Optimal window for ASA bid adjustments |
|
4 PM – 6 PM |
Low / Quiet (0–20%) |
Best window to publish metadata updates |
|
6 PM – Midnight |
Rising (25–45%) |
Track ranking shifts; capture any organic gains |
Table 5. Intra-day keyword change rate patterns and recommended actions
The Pre-order Monitor has tracked a remarkably stable line across the full 30-day window — hovering consistently around 2,000 before edging up to 2,121 on April 27 (+13 day-over-day). This stability is itself significant: it tells us that while active submission rates fluctuate, developers' medium-term launch intentions have not wavered.
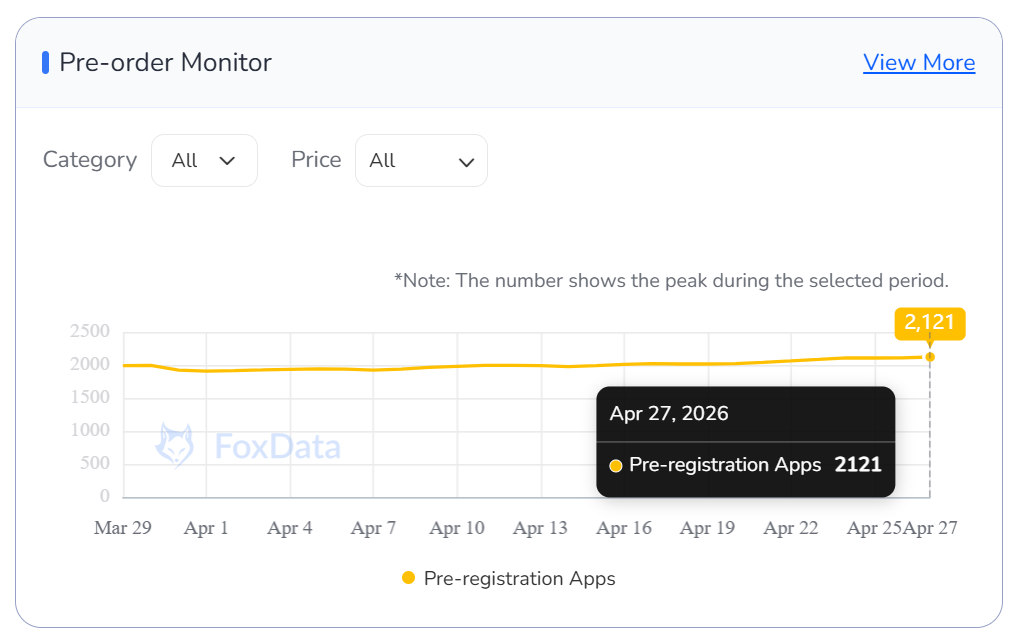
Fig. 5 — Pre-order Monitor (All categories, All prices): Mar 29 – Apr 27, 2026 | FoxData
In a market where release volumes are declining (Section 2), the pre-order pipeline is one of the most reliable leading indicators of near-term competition. A rising pre-registration count signals that a significant cohort of apps is approaching their launch window simultaneously — and each of those apps will be competing for the same keyword coverage you hold today.
The strategic playbook for teams watching this indicator:
|
Timing Phase |
Pre-order Strategy Recommendation |
|
60–90 days pre-launch |
Activate FoxData Pre-order Monitor to track emerging competitors by category |
|
30–60 days pre-launch |
Finalise title, subtitle, and keyword field — begin indexing early |
|
0–30 days pre-launch |
Run ASA campaigns on core keywords to build relevance score ahead of official release |
|
Launch week |
Leverage pre-registered user base for Day 1 download surge; aim for chart entry |
Table 6. Pre-order to launch strategy timeline
The category breakdown chart (Mar 29 – Apr 27) plots release volumes above the axis (blue) and removal volumes below (red) for every major App Store category. The pattern is consistent across virtually all verticals: removals exceed releases in every category, confirming that the net-negative trend is structural rather than confined to a single niche.
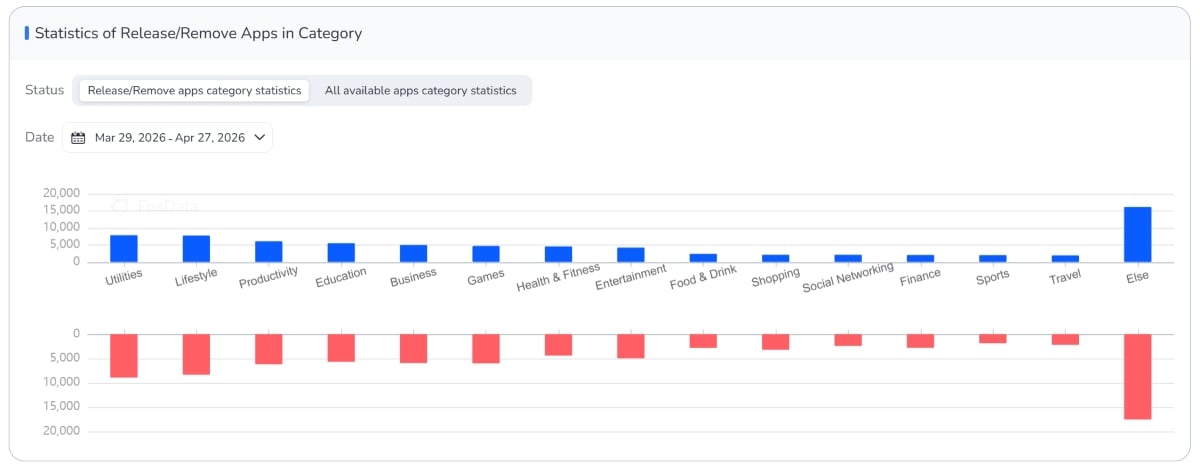
Fig. 6 — Statistics of Release/Remove Apps in Category: Mar 29 – Apr 27, 2026 | FoxData
Category Snapshot
|
Category |
30-day Releases (est.) |
30-day Removals (est.) |
Net Pressure |
|
Utilities |
~6,500 |
~9,500 |
High churn |
|
Lifestyle |
~6,200 |
~9,000 |
High churn |
|
Productivity |
~5,200 |
~7,500 |
Moderate churn |
|
Games |
~4,500 |
~6,800 |
Moderate churn |
|
Finance |
~1,500 |
~3,800 |
Heavy removal |
|
Else (all others) |
~14,500 |
~17,500 |
High volume / high churn |
Table 7. Estimated 30-day release/remove volumes by major category (FoxData, rounded)
Categories with the heaviest removal rates are not necessarily the ones to avoid — they often indicate high user demand attracting frequent experimentation by developers. The key is to use FoxData's Market Segmentation tools to move beyond category-level data to subcategory and keyword-cluster analysis, where genuine blue-ocean opportunities still exist inside even the most crowded verticals.
For teams looking to go even deeper on competitor dynamics within a specific category, FoxData's game competitive analysis framework demonstrates how to systematically deconstruct a rival's positioning — a methodology that applies equally well to non-gaming categories.
The six signals above point to different priorities depending on your role. Here is a condensed playbook:
|
Role |
Priority Actions (Apr 27 Context) |
FoxData Tool |
|
ASO Manager |
Capture keyword baselines now while the ecosystem is at zero losses; schedule metadata updates in the 4–6 PM quiet window |
Keyword Monitor · ASO Impact Analysis |
|
Indie Developer |
Target long-tail keywords vacated by removed apps; find low-competition entry points before next release wave |
Keywords Research · Store Monitor |
|
Growth / UA Team |
Use the stable ranking environment to A/B test creative assets; pause high CPM ASA bids during midnight indexing hours |
Ad Intelligence · ASA Analysis |
|
Product / Strategy |
Monitor pre-order pipeline by category to anticipate incoming competition 30–90 days ahead |
Pre-order Monitor · Market Segmentation |
|
Market Analyst |
Track net release-removal ratios by category as a leading indicator of market saturation; pull data via API for weekly reporting |
App Store Data API · Market Intelligence |
Table 8. Role-based action playbook for April 27, 2026 market conditions
For teams that need to pull these signals programmatically into internal dashboards or BI tools, FoxData's App Store Data API provides structured access to Store Monitor, keyword rankings, download estimates, and category statistics — eliminating the manual export-and-clean workflow.
April 27, 2026 will be remembered in Store Monitor records as the day keyword losses flatlined — a momentary pause in the perpetual churn of nearly 1.87 million apps competing for user attention in the US market. Whether this zero-loss event reflects a genuine algorithm stabilisation, a data reconciliation, or mass developer action, the strategic implication is the same: act now, while the signal-to-noise ratio is at its highest.
The broader picture — net-negative app flow, a cautious release environment, and a remarkably stable pre-order pipeline — points to a market moving from explosive growth into disciplined competition. In this environment, the apps that win are those built on continuous data intelligence: tracking not just their own performance, but the shifting terrain of releases, removals, keyword dynamics, and competitor moves.
FoxData's Store Monitor, ASO analytics suite, Market Segmentation tools, and App Store Data API are designed precisely for this moment — turning raw market signals into decisions that compound over time.
© 2020-2026 FoxData. All Rights Reserved.
