





Explore More Possibilities for Your Business
Full-cycle scenario construction to meet your needs from App research, development, and release to operation.
Ready for your soaring growth

Editor's Note: While your competitors are already queued in the pre-order pipeline and keyword rankings are quietly changing hands, is your growth team still waiting for the quarterly report? Drawing from real-time market data captured on May 28, 2026, this article delivers a deep-dive analysis of five App Store monitoring metrics - and it may be the most strategically valuable ASO read you encounter this year.
Ask an indie developer: How many new apps hit the App Store yesterday?
You'll usually get a guess.
Ask an ASO manager: How many apps were removed last week?
The answer tends to be "I'd need to look that up."
Ask a growth lead: How many competitors in your category are already lined up for pre-order?
What follows, more often than not, is silence.
These aren't trivia questions. They are market signals that directly shape your app's visibility, discoverability, and competitive position. And the vast majority of teams are flying without them.
FoxData Store Monitor was built to close precisely this gap. It tracks six dimensions of marketplace movement across 1.89 million apps in real time, converting what used to be guesswork into a daily actionable intelligence briefing.
Data from a single-day FoxData Store Monitor cross-section. The profile exhibits classic holiday/pre-conference freeze characteristics.
| Metric | Value | Change |
|---|---|---|
| Total Apps Tracked | 1,892,055 | — |
| Newly Released Apps | 65 | ▼ 92.5% |
| Removed Apps | 64 | ▼ 94.9% |
| Charts Dropped Apps | 11 | ▼ 91.3% |
| Pre-order Apps | 2,050 | ▼ 1.1% |
💬 Expert Interpretation · FoxData Data Analytics Team
"Four out of five core metrics cratered over 90% on the same day - yet the pre-order pipeline barely twitched. This combination is extraordinarily rare in our historical data and exemplifies what we call 'market pseudo-calm.' The single most common mistake developers make is misreading this lull as a closed opportunity window rather than the eve of the next competitive wave."
FoxData Store Monitor tracks 1,892,055 apps on the App Store.
That number, on its own, is a strategic input. It tells you:
🏟️ The scale of the ecosystem you're competing in
🔍 How large the "haystack" is that your app needs to stand out from
📐 The total addressable visibility surface any ASO campaign can reach
🔶 Why the Trend Trajectory Matters Far More Than the Static Number
What carries real strategic weight isn't the static figure - it's the direction of change.
| Trend Direction | Market Implication | Your Response |
|---|---|---|
| 📈 Total volume rising | Intensifying competition across every keyword and category rank | Strengthen long-tail keyword positioning |
| 📉 Total volume shrinking (category-level) | Market consolidation, maturation, or Apple purging low-quality apps | Identify vacated positions; claim them fast |
| ➡️ Total volume stable | Market in equilibrium | Focus on competitor movements, not totals |
💬 Expert Interpretation
"The 1.89 million figure is routinely dismissed by developers as background noise. But it's actually the denominator for calculating your Share of Voice. When I see a category's total app count drop 8% over three months, that typically signals a targeted Apple cleanup operation - and for the quality apps that survive, it's a once-in-a-blue-moon ranking leap window."
🔴 May 28: Only 65 new apps released - a 92.5% plunge from an estimated baseline of ~871
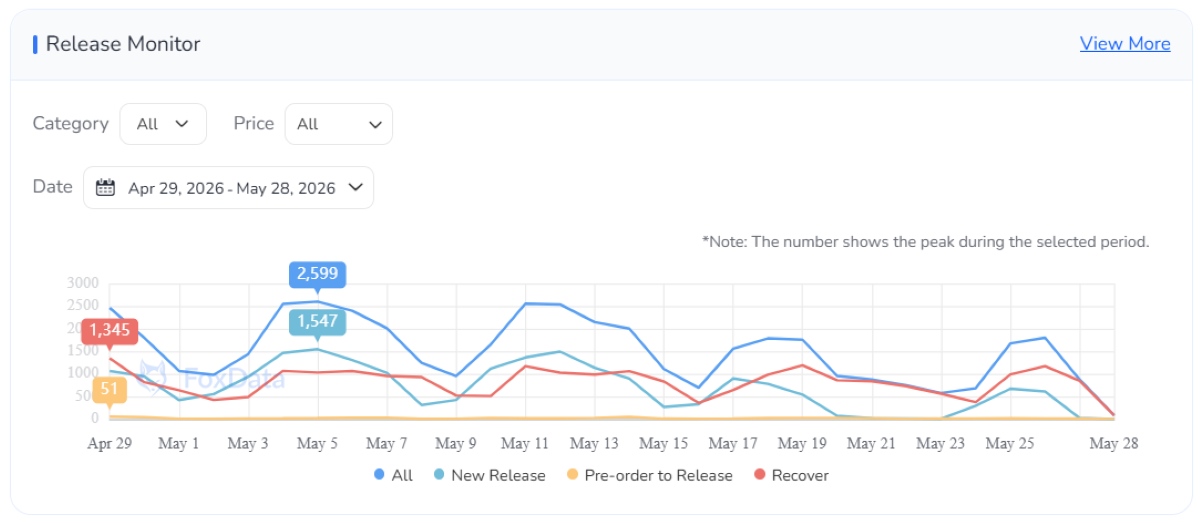
For ASO practitioners, the newly released apps metric answers a deceptively simple, strategically critical question:
How many new competitors entered my market today?
Every new app is a potential competitor for category ranking, search visibility, and user attention.
🔶 Two Extremes of Release Volume — Two Radically Different Competitive Landscapes
High release volume (hundreds per day): competitive pressure is distributed but relentless — keyword battles become wars of attrition.
Release volume crashes to 65 (as in this snapshot): a brief calm after the positional warfare pauses — the May 28 decline is primarily driven by the Memorial Day holiday overlapping with the pre-WWDC developer freeze period.
💬 Expert Interpretation
"A 92.5% single-day drop ranks as an extreme outlier in our monitoring history. Most teams will write this day off as 'nothing worth watching' — but that's precisely backwards. Anomalous troughs like this tend to create keyword-ranking 'vacuum periods,' and for prepared teams, they represent an opportunity to lock in target keywords at significantly lower cost."
The real power of this metric lies in category filtering: a surge of new apps in Health & Fitness may be irrelevant to a game publisher; but a spike in Casual Games should immediately trigger a keyword strategy review.
🔴 May 28: 64 apps removed — a 94.9% collapse from an estimated baseline of ~1,257
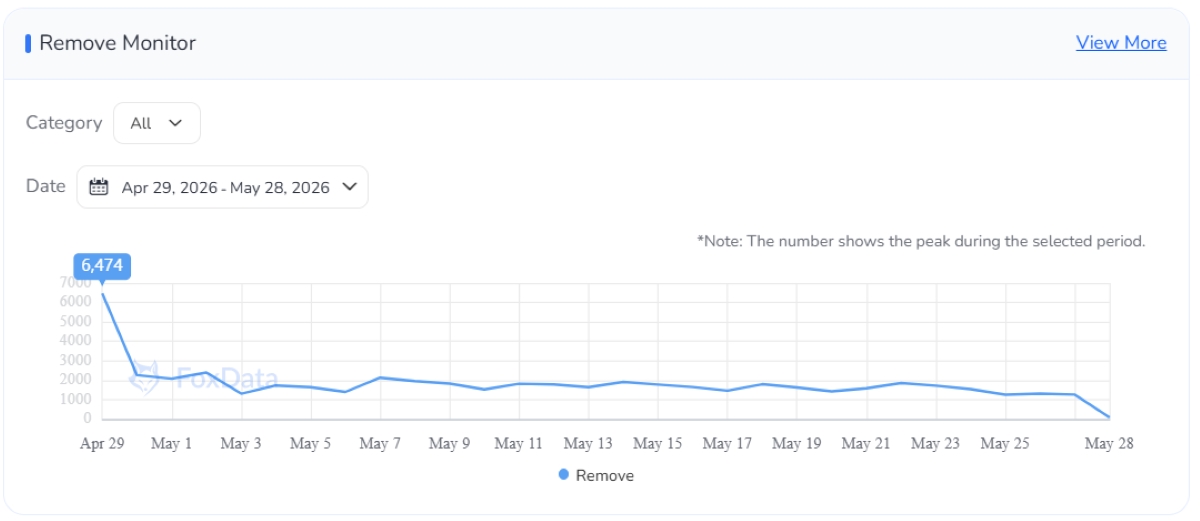
The mirror image of new releases is app departures.
When apps exit the ecosystem, they leave behind:
🏆 Vacated category ranking positions
🔑 Unclaimed keyword rankings
👥 User bases actively searching for alternatives
🔶 High Removal Volume vs. Low Removal Volume — Which Scenario Benefits You More?
Large-scale removals typically correlate with Apple's periodic cleanup sweeps — targeting abandoned apps, policy violations, or outdated builds that haven't adapted to new iOS versions.
| Scenario | Opportunity Profile | Competitive Intensity |
|---|---|---|
| Normal day (~1,257 removals) | Abundant opportunities; numerous vacated keywords | Everyone monitoring the market sees them |
| Trough day (64 removals) | Narrow window but fewer competitors watching | First-movers gain asymmetric advantage |
💬 Expert Interpretation
"A removed app's keyword rankings don't automatically transfer to anyone - they briefly enter what we call 'no man's land.' I've watched teams seize a competitor's core keyword TOP 3 position - one they'd held for months - within 72 hours of that competitor's removal, purely through rapid metadata optimization. That kind of reaction speed is only possible with real-time monitoring."
🔴 May 28: Only 11 apps dropped from chart positions - a 91.3% decline from an estimated baseline of ~126
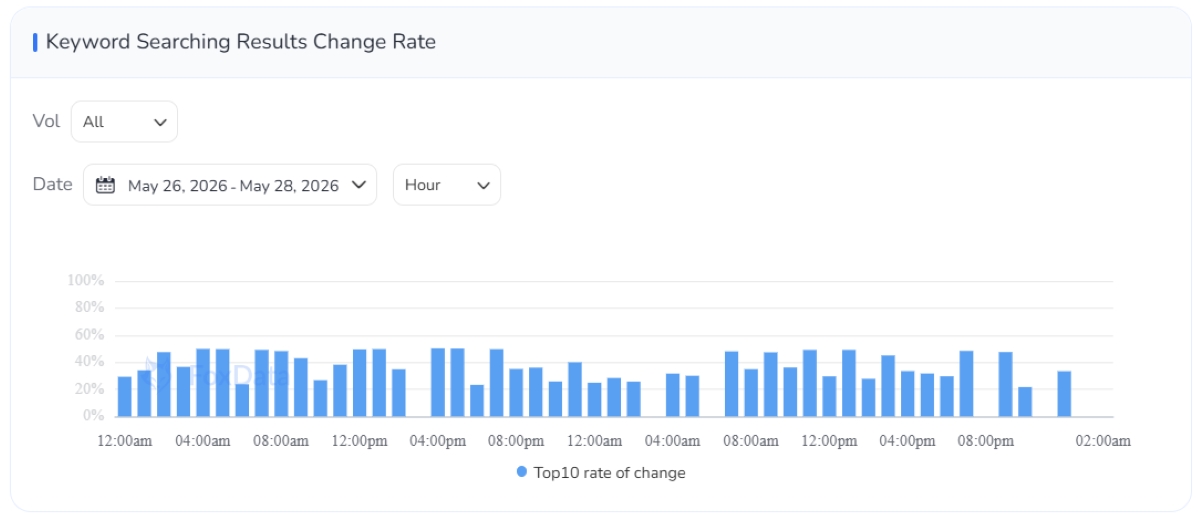
Chart position movement is the core metric for measuring ranking volatility: how much displacement is actually occurring at the top of category and overall charts?
🔶 High Volatility vs. Low Volatility — Radically Different UA Strategies
🟢 High-Volatility Periods: Ranking fluidity is strong — new entrants are displacing incumbents, user behavior is shifting, and well-optimized apps have room to climb.
🔵 Low-Volatility Periods (like today's 11 drops): Top rankings are entrenched — incumbent apps are holding their ground. Breaking into the charts requires far higher install velocity than during high-volatility windows.
💡 This metric is your "budget multiplier signal" — read it before you spend.
💬 Expert Interpretation
"Here's a pattern UA teams routinely overlook: launching a major user acquisition push during a period when ranking volatility sits at just 10% of normal can require 3 to 5 times the budget to hit the same ranking target compared to a high-volatility window. Store Monitor lets you see this signal before you submit the budget proposal — not after the campaign has already run and the ROI falls short."
May 28: FoxData tracked 2,050 pre-order apps — down just 1.1% from the prior baseline, virtually unmoved.
Among all five metrics, pre-order apps are the only one that looks forward rather than backward.
These 2,050 apps carry a distinct strategic weight:
✅ Already approved by Apple — confirmed arrivals, not speculation. This is intelligence, not guesswork.
📄 App Store product pages are live — screenshots, descriptions, and keyword metadata are fully deployed and visible.
⏰ Counting down to their launch dates.
🔶 Why the Pre-Order Pipeline Is Competitive Intelligence in Its Purest Form
Developers who monitor their category's pre-order pipeline can:
1. Reverse-engineer competitors' keyword strategies from their live product pages
2. Identify positioning overlap and adjust differentiation tactics before the competitor reaches a single user
3. Complete their own ASO optimization while the competing app is still in countdown mode
💬 Expert Interpretation
"Mobile game publishers in particular should treat this metric as non-negotiable intelligence. Pre-order campaigns often launch weeks or even months before the official release date — by which point the competitor's metadata strategy is fully visible. We've seen publishers redesign their subtitle and keyword fields three weeks before a rival's launch based solely on analyzing the pre-order page's keyword architecture — and end up ranking above that rival in related searches on launch day. Once the app is live, you're playing catch-up."
Individual metrics are interesting. Combined, they become a decision engine.
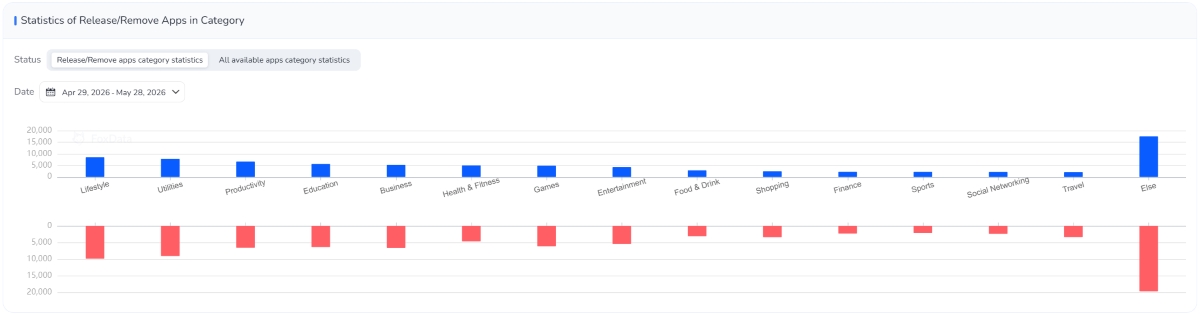
Using the May 28 snapshot, here's what the five signals say when read together:
🔵 The market is in temporary freeze: release volume, removal volume, and ranking displacement collapsed in sync.
🔴 But the pre-order pipeline's 2,050 apps held steady — meaning a large volume of confirmed competitors is queued and waiting. This calm is temporary.
🟡 The strategic implication is clear: the post-WWDC thaw will bring a dense wave of competitive pressure. The current two-week low-competition window is the optimal moment to audit keyword positions and reinforce metadata before the surge arrives.
💡 Store Monitor Daily Reading Decision Framework
| Signal Combination | Meaning | Recommended Action |
|---|---|---|
| 📈 New Releases ↑ + Removals ↓ | Net competitive growth | Review category keyword strategy |
| 📉 New Releases ↓ + Removals ↓ | Market freeze | Audit pre-order pipeline; identify post-thaw threats |
| 📊 Chart Drops ↑ | High-volatility window | Aggressive UA; equal budget delivers double the impact |
| 🔮 Pre-orders ↑ (your category) | Future competitors confirmed | Adjust keyword targeting NOW — don't wait for launch day |
The App Store processes millions of data points every day - new releases, removals, ranking shifts, pre-order activations. Most of this data is publicly accessible, if you know where to look and have the time to manually aggregate it.
But there is a vast chasm between "publicly accessible" and "decision-ready."
FoxData Store Monitor was built to bridge precisely that chasm - consolidating the five metrics covered in this article, along with keyword ranking fluctuation tracking, into a single real-time dashboard spanning 1.89 million apps. For teams that want to deepen their ASO workflow beyond monitoring, FoxData's free ASO tools provide the keyword research and competitive analysis layer needed to act on what the dashboard reveals.
The May 28 snapshot is one data point. Tomorrow's numbers will tell a different story - one co-authored by post-holiday review backlog catch-up, pre-WWDC launch sprints, and the steady countdown of those 2,050 pre-order apps.
The only question that matters: when the next market shift happens, will you see it in time to act?
👉 Explore the full feature set: FoxData Real-Time Store Monitor Dashboard - start reading the entire market, not just your own app's data.
Data source: FoxData Store Monitor, morning snapshot, May 28, 2026. All period-over-period changes are based on system-estimated prior baseline values. Image data visualizations sourced from FoxData Store Monitor dashboard.
© 2020-2026 FoxData. All Rights Reserved.