


Explore More Possibilities for Your Business
Full-cycle scenario construction to meet your needs from App research, development, and release to operation.
Ready for your soaring growth
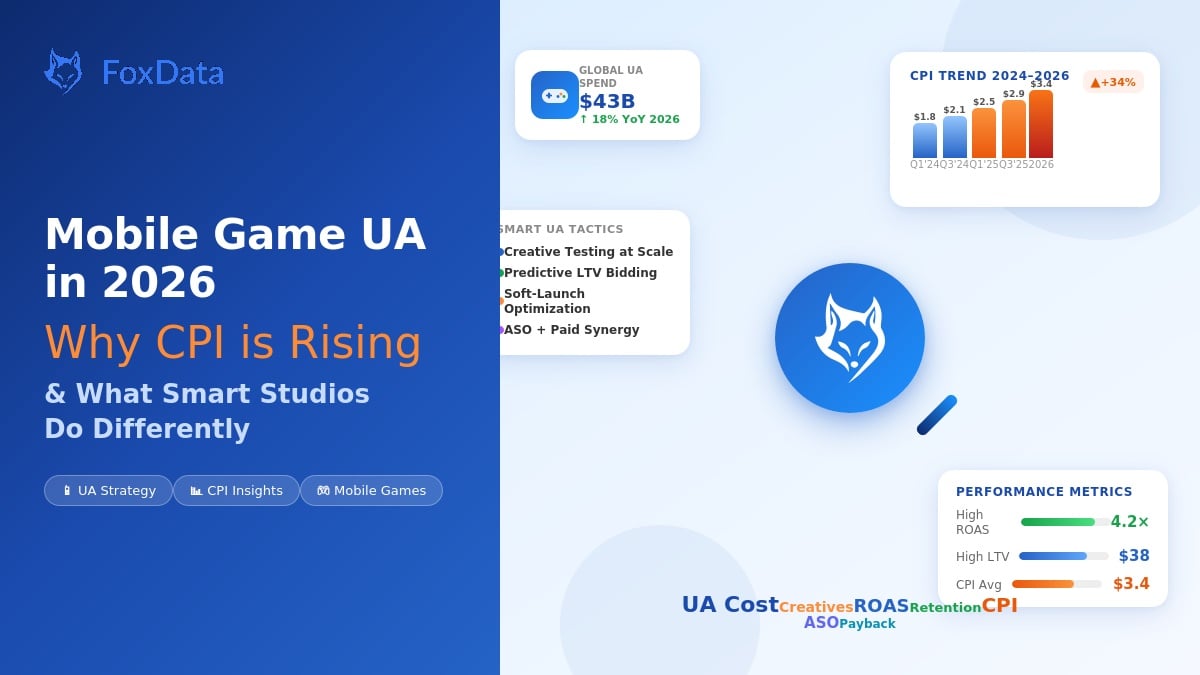
The average cost-per-install for a mobile game in the United States hit $4.90 in Q1 2026 — a 34% increase from just two years ago. For mid-core and RPG titles, that number climbs above $8.50 on iOS, a threshold that makes profitability nearly impossible without flawless lifecycle monetization. Meanwhile, hyper-casual CPIs that once hovered near $0.30 have crept past $0.85, compressing margins in a genre that was supposed to be margin-proof.
These are not temporary spikes. They are structural.
Privacy-era signal loss, platform fee restructuring, ad network consolidation, and an oversaturated global storefront have permanently altered the economics of mobile game user acquisition (UA). Studios that continue to throw budget at broad-targeting campaigns and hope for algorithmic magic are bleeding money at a rate that will not reverse itself.
This article presents the data, dissects the drivers, and — most importantly — outlines the operational playbook that the top-performing studios are using to acquire users at 20–40% below category-average CPI. The common thread across every winning strategy is the same: competitive intelligence applied systematically at every stage of the UA funnel.
Before diving into solutions, it is worth grounding the conversation in current reality. Below are median CPI benchmarks for key game genres across Tier-1 markets (US, UK, DE, JP, KR) as of Q1 2026, aggregated from publicly available network data and industry reports:
|
Genre |
iOS CPI (Median) |
Android CPI (Median) |
YoY Change |
|---|---|---|---|
|
Hyper-Casual |
$0.85 |
$0.42 |
+18% |
|
Casual / Puzzle |
$3.20 |
$1.80 |
+22% |
|
Mid-Core (Strategy, Simulation) |
$6.40 |
$3.90 |
+29% |
|
RPG / MMORPG |
$8.70 |
$5.10 |
+35% |
|
Casino / Social Casino |
$7.50 |
$4.60 |
+26% |
Several forces are driving these increases simultaneously:
ATT adoption has plateaued at roughly 35% opt-in rates on iOS, leaving the majority of high-value users invisible to deterministic attribution. Probabilistic modeling fills some gaps, but CPMs for identifiable audiences have risen proportionally.
Google's Privacy Sandbox for Android entered full enforcement in late 2025, restricting GAID access and forcing a shift to Privacy-Preserving APIs (Topics, Attribution Reporting). Early data shows a 15–20% increase in effective CPI on Android as networks recalibrate.
Ad network consolidation means fewer competitive bidding environments. Meta, Google, and Unity/ironSource now control an estimated 72% of mobile game ad spend. Less competition among networks equals higher floor prices.
Creative fatigue accelerates faster in a saturated market. The average top-performing ad creative now degrades to below-benchmark IPM (installs per mille) within 8–12 days, down from 18–21 days in 2023.
The result is a market where brute-force spending is punished and intelligence-driven precision is rewarded. The studios thriving in this environment share three capabilities: organic discovery optimization, competitive intelligence infrastructure, and regional diversification. We will examine each in turn.
In a high-CPI environment, every organic install is pure margin. Yet most studios still treat App Store Optimization (ASO) as a one-time metadata exercise — set the keywords at launch, update the screenshots quarterly, and move on. That approach leaves enormous value on the table.
Data from Q4 2025 and Q1 2026 shows that games with actively managed ASO programs achieve 2.5–3.8x higher organic-to-paid install ratios compared to games with static store listings. The mechanism is straightforward: paid campaigns drive visibility and short-term ranking lifts. If the store listing is optimized for conversion at the moment those ranking lifts occur, the organic tail extends significantly. If it is not, the paid spend generates installs but zero residual organic benefit.
This is the ASO + Apple Search Ads (ASA) synergy that sophisticated UA teams exploit:
Keyword intelligence informs ASA bidding.
Rather than bidding on obvious category terms at premium CPTs (cost-per-tap), top studios use ASO impact analysis tools to identify high-volume, low-competition keyword clusters where organic ranking is achievable within 2–3 weeks of sustained paid support.
ASA campaigns validate keyword viability before organic investment.
Running a 7-day ASA campaign on a candidate keyword at modest budget ($500–$1,000) produces TTR (tap-through rate) and CR (conversion rate) data that directly predicts organic performance. Keywords with TTR above 8% and CR above 45% are strong candidates for organic optimization.
Organic ranking improvements reduce ASA CPTs.
Apple's relevance score rewards listings that convert well organically. Studios that rank in the top 10 for a keyword typically see 20–35% lower CPTs for that same keyword in ASA, creating a virtuous cycle.
The ASO playbook has evolved beyond keywords and screenshots. The most impactful levers today include:
Custom Product Pages (CPPs) aligned to UA creative themes. Studios running 8–12 CPPs matched to their top-performing ad creative themes report 15–25% higher post-click conversion rates versus a generic default page.
In-App Event (IAE) optimization on the App Store. Games that publish 3–4 IAEs per month with keyword-rich titles see measurable ranking lifts for those terms. The events surface in search results, browse tabs, and editorial placements.
Short-form video previews optimized for muted autoplay. The first 3 seconds of an App Store video preview now function essentially as a performance ad. Studios testing and iterating these previews on a biweekly cadence see 10–18% lifts in browse-to-install conversion.
Google Play Store Listing Experiments. Running continuous A/B tests on icons, feature graphics, and short descriptions remains one of the highest-ROI activities available. A single icon test that lifts CVR by 5% compounds across every impression source — paid, organic, and featuring.
The critical insight is that ASO is not a substitute for paid UA. It is a force multiplier for paid UA. Every dollar spent on acquisition performs better when the storefront is optimized, and the optimization itself generates installs that carry zero marginal cost. In a market where CPI is rising 20–35% year-over-year, that multiplier effect is the difference between sustainable growth and cash-burn.
Here is a pattern that repeats across underperforming UA teams: they optimize in a vacuum. They test creatives against their own historical benchmarks. They bid on keywords based on internal search volume estimates. They set geo targets based on where they have run campaigns before. At no point do they systematically analyze what their competitors are doing, where competitors are spending, which creatives competitors are scaling, or which markets competitors are entering or exiting.
This is the single largest source of wasted UA spend in mobile gaming today.
Consider a mid-core strategy game launching a UA push in the US market. Without competitive intelligence, the UA team makes educated guesses:
Which keywords are competitors bidding on in ASA? Unknown.
What is the competitor's estimated daily spend on Meta and Google UAC? Unknown.
Which ad creatives have competitors been running for 30+ days (indicating strong performance)? Unknown.
Is a major competitor about to launch a seasonal event that will spike category CPIs? Unknown.
Each of these unknowns translates directly into wasted budget. Bidding on keywords where an entrenched competitor has a 4.8-star rating and 500K reviews is a losing proposition at any CPT. Launching a UA push during a competitor's major event — when category CPMs are elevated 25–40% — destroys ROAS. Running creative concepts that a competitor already tested and abandoned means repeating someone else's expensive failure.
The studios that consistently outperform on CPI efficiency have built (or bought) systematic competitive intelligence capabilities. The core data layers include:
Ad Creative Intelligence
Tracking competitor ad creatives across Meta, Google, Unity, AppLovin, and TikTok. The valuable signals are not just what creatives exist, but which ones have been running longest (longevity = performance), which formats they use (playable, UGC, cinematic), and which hooks they test. Studios with this data can leapfrog the creative testing cycle by starting from concepts that are already validated in-market.
Keyword and ASA Competitive Mapping
Understanding which keywords competitors rank for organically, which they bid on in ASA, and where gaps exist. This is not guesswork — platforms like FoxData's mobile game analytics solutions provide granular visibility into competitor keyword portfolios, ranking movements, and estimated search ad spend.
Download and Revenue Trend Monitoring
Tracking competitor download velocity and revenue estimates at the daily or weekly level reveals campaign timing, seasonal patterns, and market response to updates. A competitor showing a sudden 3x spike in downloads in a specific geo is a clear signal of a UA push — and a signal to either counter-program or avoid that market temporarily.
Feature and Update Tracking
Monitoring competitor app updates, new feature releases, and content drops. A competitor launching a major content update will typically see improved organic conversion rates, making it a suboptimal time to compete for the same keywords.
The most effective competitive intelligence programs do not just collect data — they operationalize it into what some industry practitioners call a "GameIQ" framework: a continuous loop of Gather, Analyze, Map, Execute, and Iterate, with Quantified outcomes at each step.
In practice, this looks like a weekly competitive review cycle:
Monday: Ingest updated competitor creative libraries, keyword rankings, and download estimates.
Tuesday–Wednesday: Identify the top 3 competitive insights that should change current UA allocation — a new keyword opportunity, a creative angle worth testing, a geo where competitor spend has dropped (signaling either poor performance or budget exhaustion).
Thursday–Friday: Execute changes to campaigns based on those insights. Shift budget toward identified opportunities. Pause campaigns in overheated segments.
Following Monday: Measure impact, feed results back into the model.
Studios running this cadence consistently report 20–40% lower CPIs compared to their pre-intelligence baselines, with the largest gains coming from avoided waste (not bidding into overheated auctions) and creative acceleration (reaching winning concepts 2–3 weeks faster).
The reflex for most Western-focused studios is to run UA primarily in the US, UK, Germany, and Japan — the four largest markets by ARPU. But in 2026, this reflex is increasingly expensive and increasingly unnecessary.
Consider the CPI differential:
|
Market |
Mid-Core iOS CPI |
Mid-Core Android CPI |
Avg. D7 ROAS |
|---|---|---|---|
|
United States |
$6.40 |
$3.90 |
12–18% |
|
Southeast Asia (avg.) |
$0.90 |
$0.45 |
8–14% |
|
Brazil |
$1.20 |
$0.55 |
10–16% |
|
Mexico |
$1.10 |
$0.50 |
9–15% |
|
India |
$0.35 |
$0.15 |
3–6% |
At first glance, the lower ROAS in emerging markets seems to cancel out the lower CPI. But this analysis misses two critical factors:
Creative and concept validation at 80–90% lower cost.
Running a creative test matrix in the Philippines or Brazil costs a fraction of running it in the US. A studio can test 50 creative variants in Southeast Asia for the same budget as 5 variants in the US. The winning concepts transfer — not perfectly, but with a 60–70% predictive hit rate for Tier-1 market performance. This dramatically accelerates the creative learning cycle.
The LTV gap is closing.
In-app purchase ARPU in Southeast Asia grew 28% year-over-year in 2025, driven by expanding mobile payment infrastructure, rising smartphone penetration in the mid-tier segment, and growing player sophistication. Markets like Thailand, Vietnam, and Indonesia are increasingly viable for mid-core and RPG titles that rely on whale-driven monetization. For a deeper analysis of where downloads and revenue are trending, FoxData's analysis of top app markets in 2025–2026 provides detailed breakdowns by region and category.
Smart studios are not simply "launching in new markets." They are building structured regional testing pipelines that feed intelligence back into their global UA strategy:
1: Soft Launch in a Low-CPI Market (2–4 weeks) Deploy the game in a single Southeast Asian or LATAM market with minimal UA spend ($5K–$15K). The goal is not revenue — it is data. Measure D1/D7/D30 retention, session length distribution, monetization funnel conversion, and ad engagement rates. This data informs whether the global launch version needs tuning.
2: Creative Testing at Scale (2–3 weeks) Run 30–60 creative variants across Meta and Google in 3–4 emerging markets simultaneously. Identify the top 5 performers by IPM and CTR. These creatives become the starting portfolio for Tier-1 market launches, saving 2–4 weeks of expensive Tier-1 testing.
3: Geo-Expansion with Proven Playbooks (Ongoing) For titles that show strong retention and monetization metrics in emerging markets, run full-scale UA in those geos as a permanent revenue stream — not just a testing ground. The economics work: a game generating $0.08 ARPDAU in Thailand with a $0.45 Android CPI reaches D30 ROAS breakeven, which is faster than many Tier-1 campaigns.
4: Tier-1 Launch with Pre-Validated Assets Enter US/UK/JP/KR with creatives, messaging, and even monetization balancing that have already been stress-tested. The result is a faster ramp to efficient CPI and shorter time-to-positive-ROAS.
This pipeline approach typically reduces overall global UA cost by 25–35% compared to a Tier-1-first launch strategy, primarily through creative waste reduction and faster iteration cycles.
Theory without measurement is just opinion. The studios that consistently reduce CPI over time share a commitment to event-driven analytics frameworks that connect upstream UA decisions to downstream business outcomes. Below is a generalized case study framework based on patterns observed across high-performing mobile game teams.
In 2026, a typical mobile game UA operation runs campaigns across 6–10 ad networks, 3–4 DSPs, Apple Search Ads, Google App Campaigns, and organic channels. Attribution is fragmented across SKAdNetwork (SKAN 4.0+), Google's Privacy Sandbox Attribution Reporting API, probabilistic models, and MMPs. No single source provides a complete picture.
The result is that most studios cannot confidently answer basic questions:
Which campaign drove the users who completed the Day 7 retention milestone?
What is the true incremental ROAS of a specific creative variant, controlling for organic cannibalization?
Did the ASA keyword campaign last month actually drive net-new users, or did it merely cannibalize organic installs?
High-performing studios address this by building event-driven attribution maps that connect four data layers:
1: Campaign Metadata
Every campaign, ad set, and creative variant is tagged with structured metadata: geo, platform, network, creative theme, bidding strategy, and target audience segment. This seems obvious, but inconsistent naming conventions are one of the most common sources of attribution failure.
2: Install and Post-Install Event Streams
All post-install events — tutorial completion, first purchase, D1/D7/D30 retention flags, level milestones, ad impressions viewed — are captured with campaign attribution appended. For SKAN-attributed installs, coarse conversion values are mapped to post-install event ranges.
3: Revenue and LTV Models
Predicted LTV at D7, D30, and D90 is calculated per cohort, segmented by campaign source. This enables real-time ROAS estimation even before actual revenue data matures. Models are retrained monthly using actual revenue outcomes from prior cohorts.
4: Competitive Context Overlay
This is where competitive intelligence closes the loop. Campaign performance data is overlaid with competitive market data — category ranking changes, competitor download trends, seasonal CPM patterns — to separate campaign-specific performance from market-level effects. A campaign that shows declining ROAS during a period when a major competitor is running a $2M launch push is performing differently than a campaign showing the same ROAS decline in a quiet market.
Platforms like FoxData's mobile game analytics solutions enable this competitive context layer by providing real-time market and competitor data that can be integrated into internal analytics pipelines.
Consider a mid-core strategy game studio running $500K/month in UA across the US and UK.
Before implementing the framework:
Blended CPI: $5.80
D30 ROAS: 22%
Breakeven timeline: D90+
Creative testing cycle: 3–4 weeks to identify winners
After 90 days with event-driven analytics + competitive intelligence:
Blended CPI: $4.10 (29% reduction)
D30 ROAS: 31% (41% improvement)
Breakeven timeline: D60
Creative testing cycle: 10–14 days
The CPI reduction came from three sources: pausing campaigns in overheated keyword auctions identified through competitive monitoring (accounting for 40% of the savings), shifting 20% of budget to LATAM for creative validation (30% of savings), and improving store listing conversion through CPP optimization informed by ASO analytics (~30% of savings).
The ROAS improvement came from better user quality, driven by more precise audience targeting informed by competitor audience overlap analysis and improved post-install funnel conversion from better-matched creative-to-store-listing experiences.
The most effective approaches combine three strategies: (1) systematic competitive intelligence to avoid bidding into overheated auctions and to accelerate creative learning, (2) active ASO management with ASA synergy to maximize organic install volume as a force multiplier for paid campaigns, and (3) regional diversification using low-CPI markets for creative testing and concept validation before committing Tier-1 budgets. Studios implementing all three consistently achieve 20–40% lower CPIs than category averages.
The most impactful analytics tools for mobile game UA teams in 2026 combine competitive intelligence, ASO optimization, and market trend analysis in a single platform. Look for tools that provide ad creative tracking across networks, keyword-level competitive mapping for ASA, download and revenue estimates for competitor titles, and regional market trend data. FoxData's platform is purpose-built for this use case, offering integrated competitive intelligence and ASO analytics for mobile game publishers.
"Good" CPI varies dramatically by genre and market. In the US, a well-optimized casual game campaign might achieve CPIs of $2.00–$2.50 on iOS (vs. the $3.20 category median). For mid-core titles, $4.50–$5.50 represents strong performance against a $6.40 median. RPG titles below $7.00 are performing in the top quartile. The key metric is not absolute CPI but CPI relative to predicted LTV — a $8.00 CPI is excellent if D90 LTV is $25, and a $2.00 CPI is wasteful if D90 LTV is $1.50.
Increasingly, yes. Southeast Asian markets (particularly Thailand, Vietnam, Indonesia, and the Philippines) offer CPIs that are 70–85% lower than US equivalents. While ARPU remains lower, the gap is closing — IAP revenue in the region grew 28% YoY in 2025. More importantly, these markets serve as highly cost-effective environments for creative testing and concept validation, producing insights that transfer to Tier-1 markets with a 60–70% predictive accuracy rate.
Competitive intelligence reduces UA costs through three mechanisms: waste avoidance (not bidding into auctions where entrenched competitors make winning uneconomical), creative acceleration (learning from competitor creative performance to start testing from higher-probability concepts), and timing optimization (launching campaigns during periods of lower competitive intensity rather than during competitor event pushes when category CPMs are elevated 25–40%).
Rising CPI is not a problem that can be solved by negotiating better rates with ad networks or by finding the next undiscovered traffic source. The structural forces driving cost increases — privacy regulation, network consolidation, creative fatigue — are permanent features of the mobile game landscape.
The studios that will thrive in this environment are the ones that build systematic advantages across three pillars:
Pillar 1: Competitive Intelligence as Core Infrastructure
Not a quarterly report. Not an occasional competitor teardown. A continuous, operationalized data pipeline that informs weekly UA decisions — where to bid, what to create, when to scale, and when to pull back. This is the single highest-leverage investment a mobile game UA team can make in 2026.
Pillar 2: ASO as a Paid UA Force Multiplier
Every paid install should generate organic lift. Every organic ranking gain should reduce paid costs. The ASO + ASA synergy loop, when properly managed, can deliver 30–50% more total installs from the same paid budget. This requires active, data-driven store listing management — not set-and-forget metadata.
Pillar 3: Market Timing and Regional Diversification
Launch when competitors are quiet, not when they are loud. Test in markets where failure is cheap, not where it is catastrophic. Build a global install base that reduces dependence on any single high-CPI market. The data to execute this strategy — competitor launch calendars, regional CPI trends, market growth trajectories — exists. The question is whether your team is using it.
The common denominator across all three pillars is data. Specifically, competitive and market data that extends beyond your own campaign performance into the broader ecosystem. Studios that invest in this data infrastructure today are building moats that compound over time: lower CPIs enable higher budgets, which drive more organic lift, which further reduces CPIs.
The CPI curve is not going to bend on its own. Bend it yourself — with intelligence.
© 2020-2026 FoxData. All Rights Reserved.
