Are you still spending time checking the "Top Charts" on the App Store and Google Play on your phone?
Are you unsure how to use the "Top Charts" for your research?
Don't worry, this blog is here to help you out.
FoxData's free "Top Charts" feature integrates and enhances this section of the App Store and Google Play, making it easier and more comprehensive for developers, market analysts, and regular users to understand the dynamics of the mobile app market.
What is Top Charts?
"Top Charts" typically refers to a ranking or list of the most popular or highest-performing items in a specific category. In the context of app stores like the Apple App Store and Google Play Store, "Top Charts" showcases the most downloaded or top-grossing apps and games.
These charts are updated regularly to reflect current trends and user preferences, providing insights into which apps and games are trending or maintaining popularity over time.
FoxData's free "Top Charts" feature integrates and enhances this section of the App Store and Google Play!
Not only can you directly view the daily "Top Charts" for the overall app market or specific categories in different countries on the App Store and Google Play, but you can also check the "Top Charts" under more detailed category tags and access historical "Top Charts" data.
Is there more? Of course!
This feature by FoxData is specifically designed to help developers, market analysts, and regular users conduct market research more conveniently.
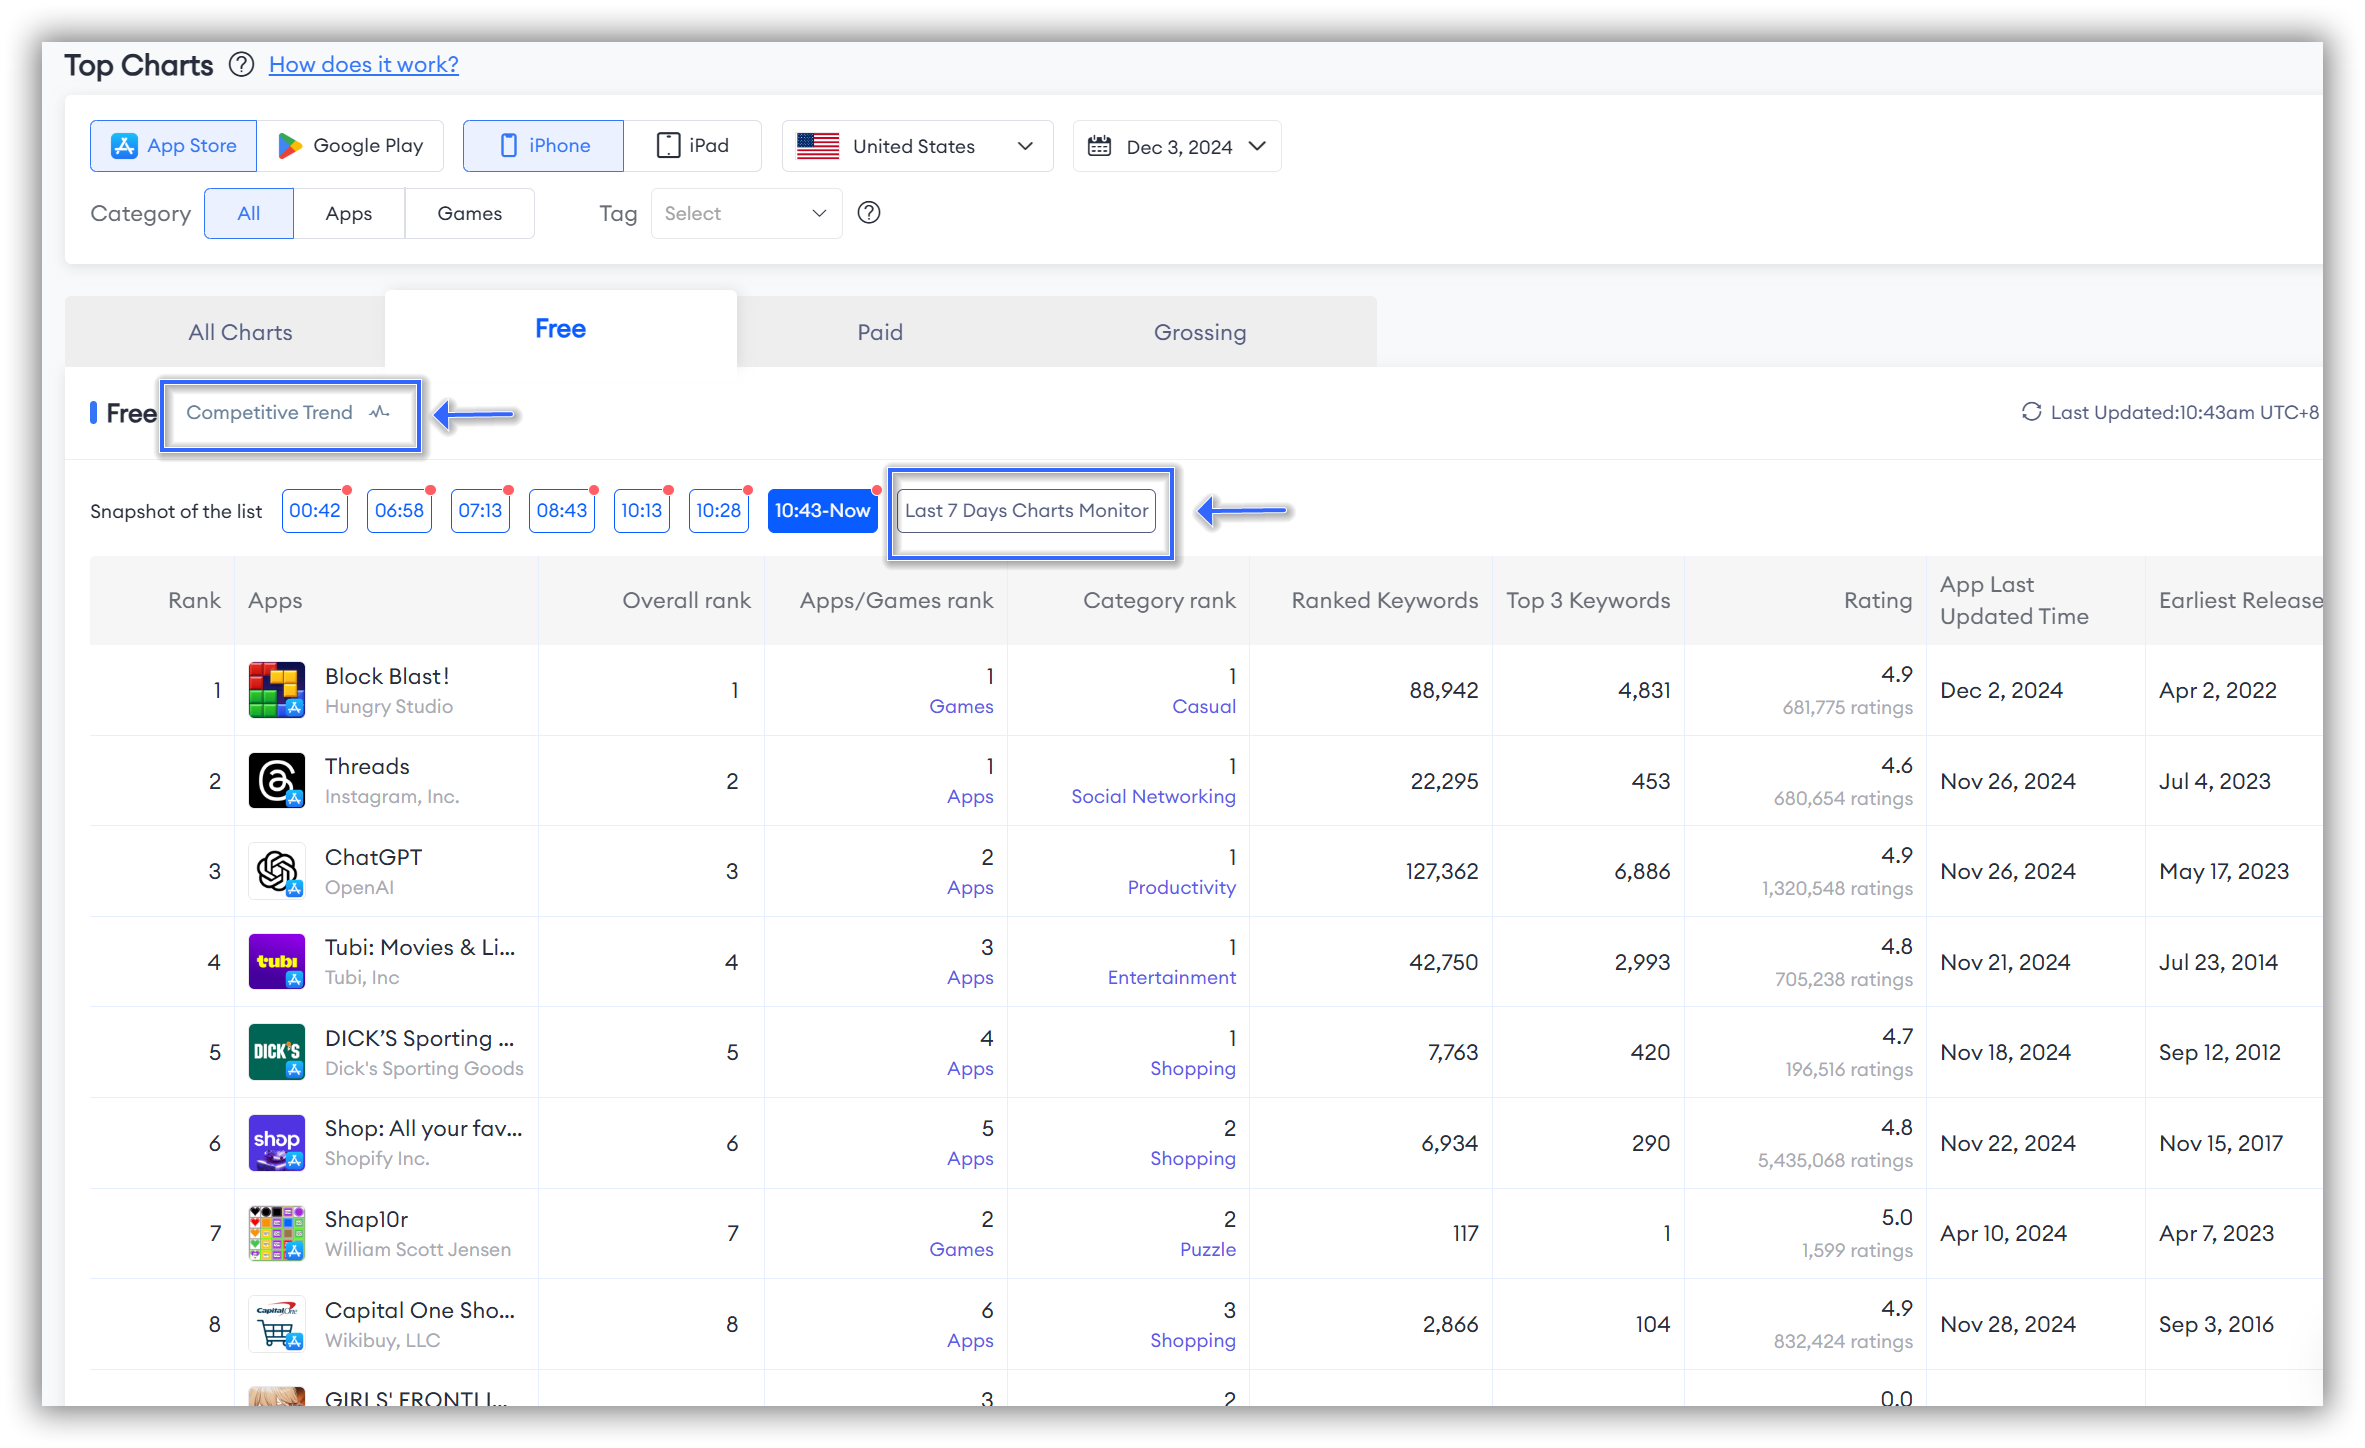
So, FoxData's "Top Charts" also allows you to view the "Last 7 Days Charts Monitor" and "Competitive Trend" under detailed rankings.
Simply click "Charts" to reach the "Top Charts" overview page, and you can start using this free feature!👇
Want to know how to use this feature to aid your research?
Let's dive in and explore together!
How can you utilize it to assist you in your work?
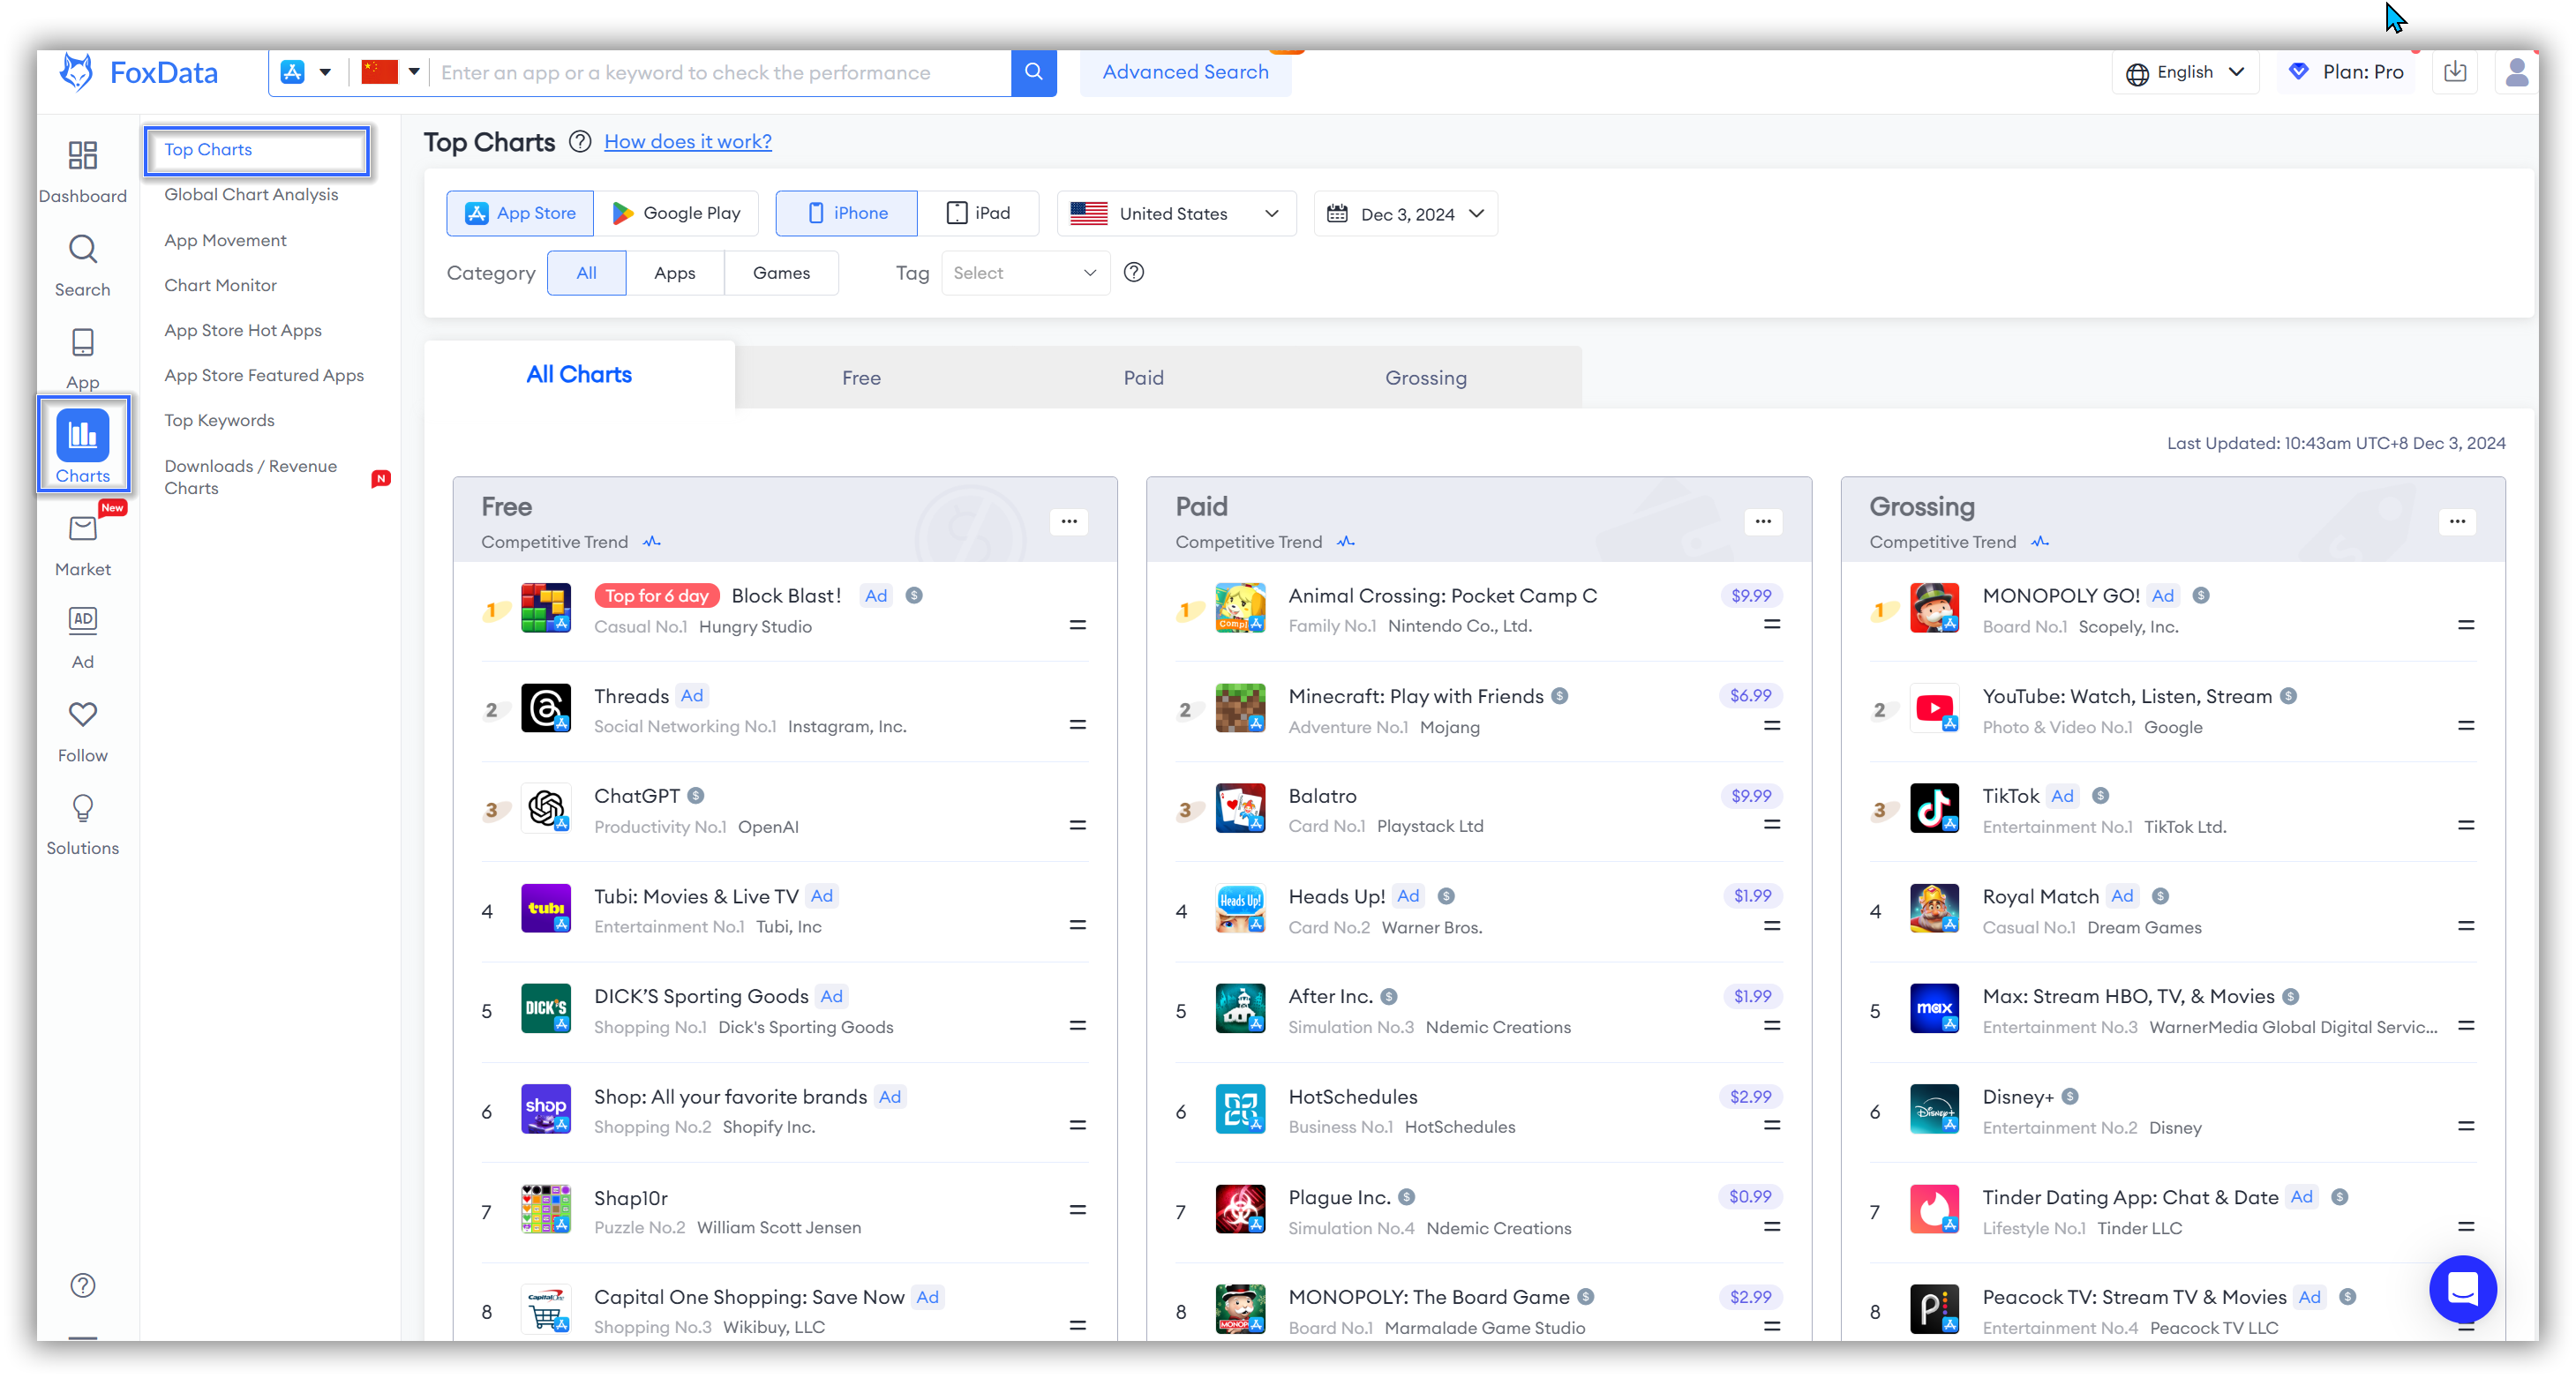
1. Market Trend Analysis
The rankings can help developers and market researchers identify popular apps and games in the current market, providing insights into user preferences and market trends.
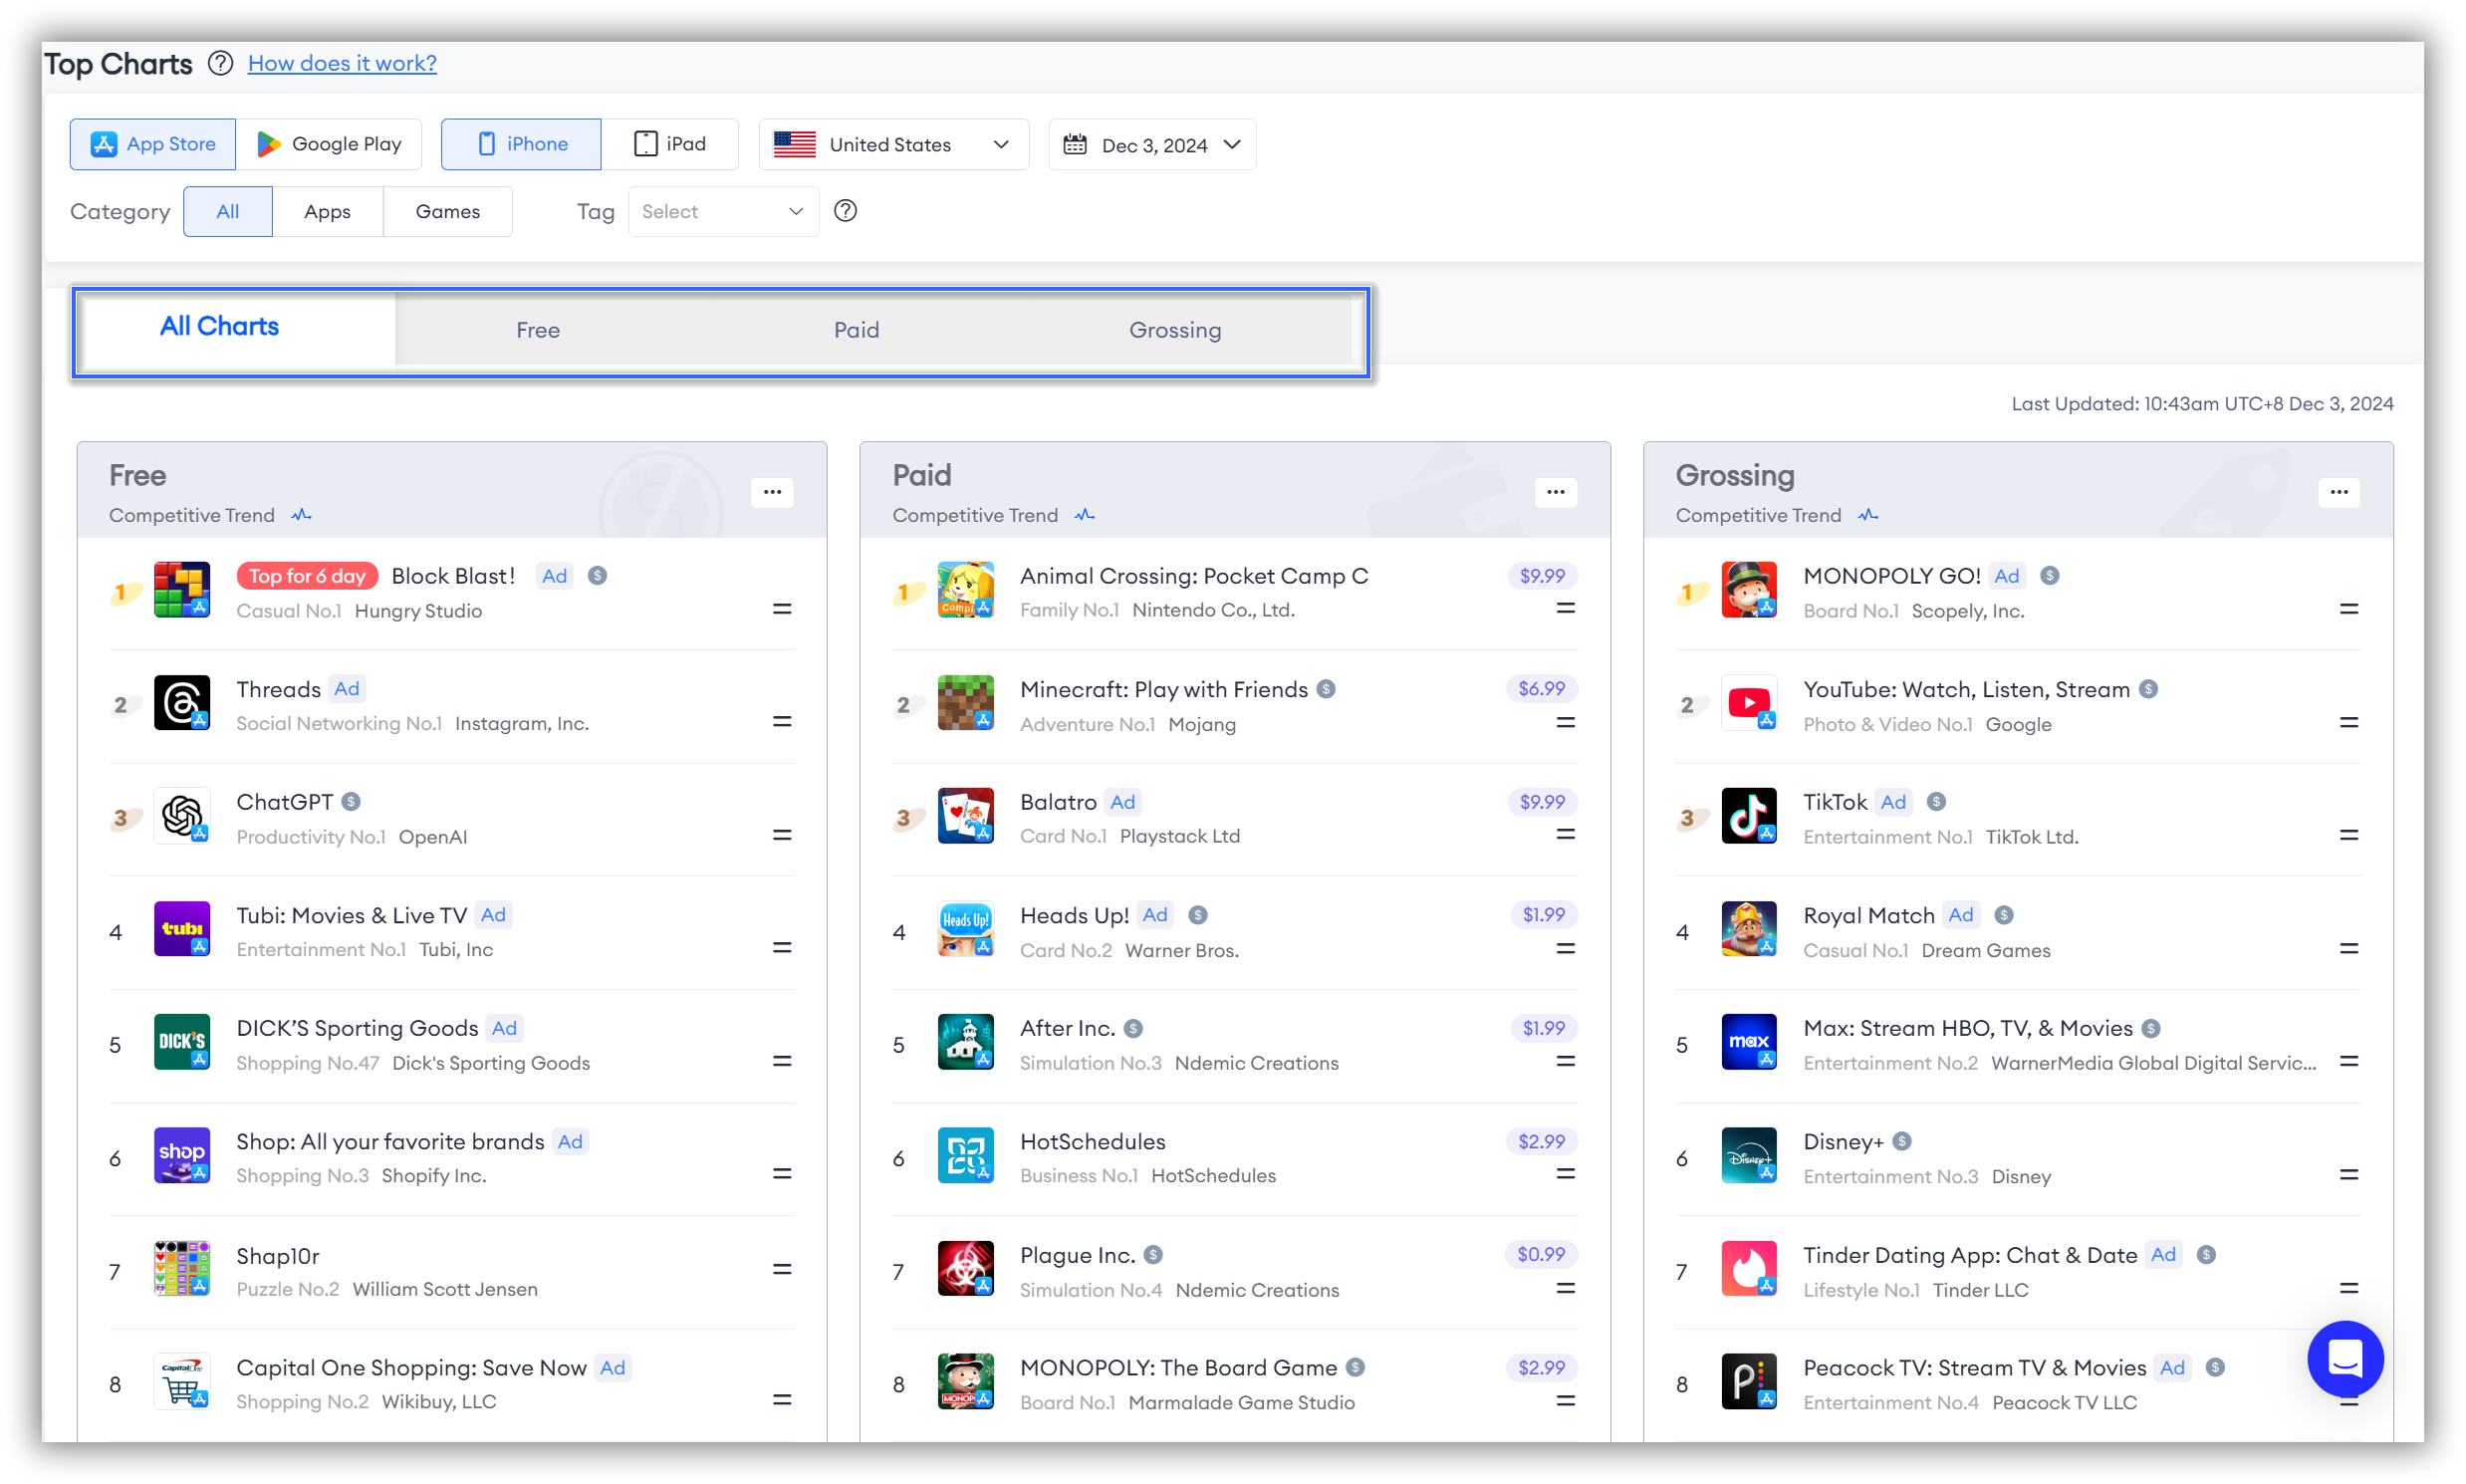
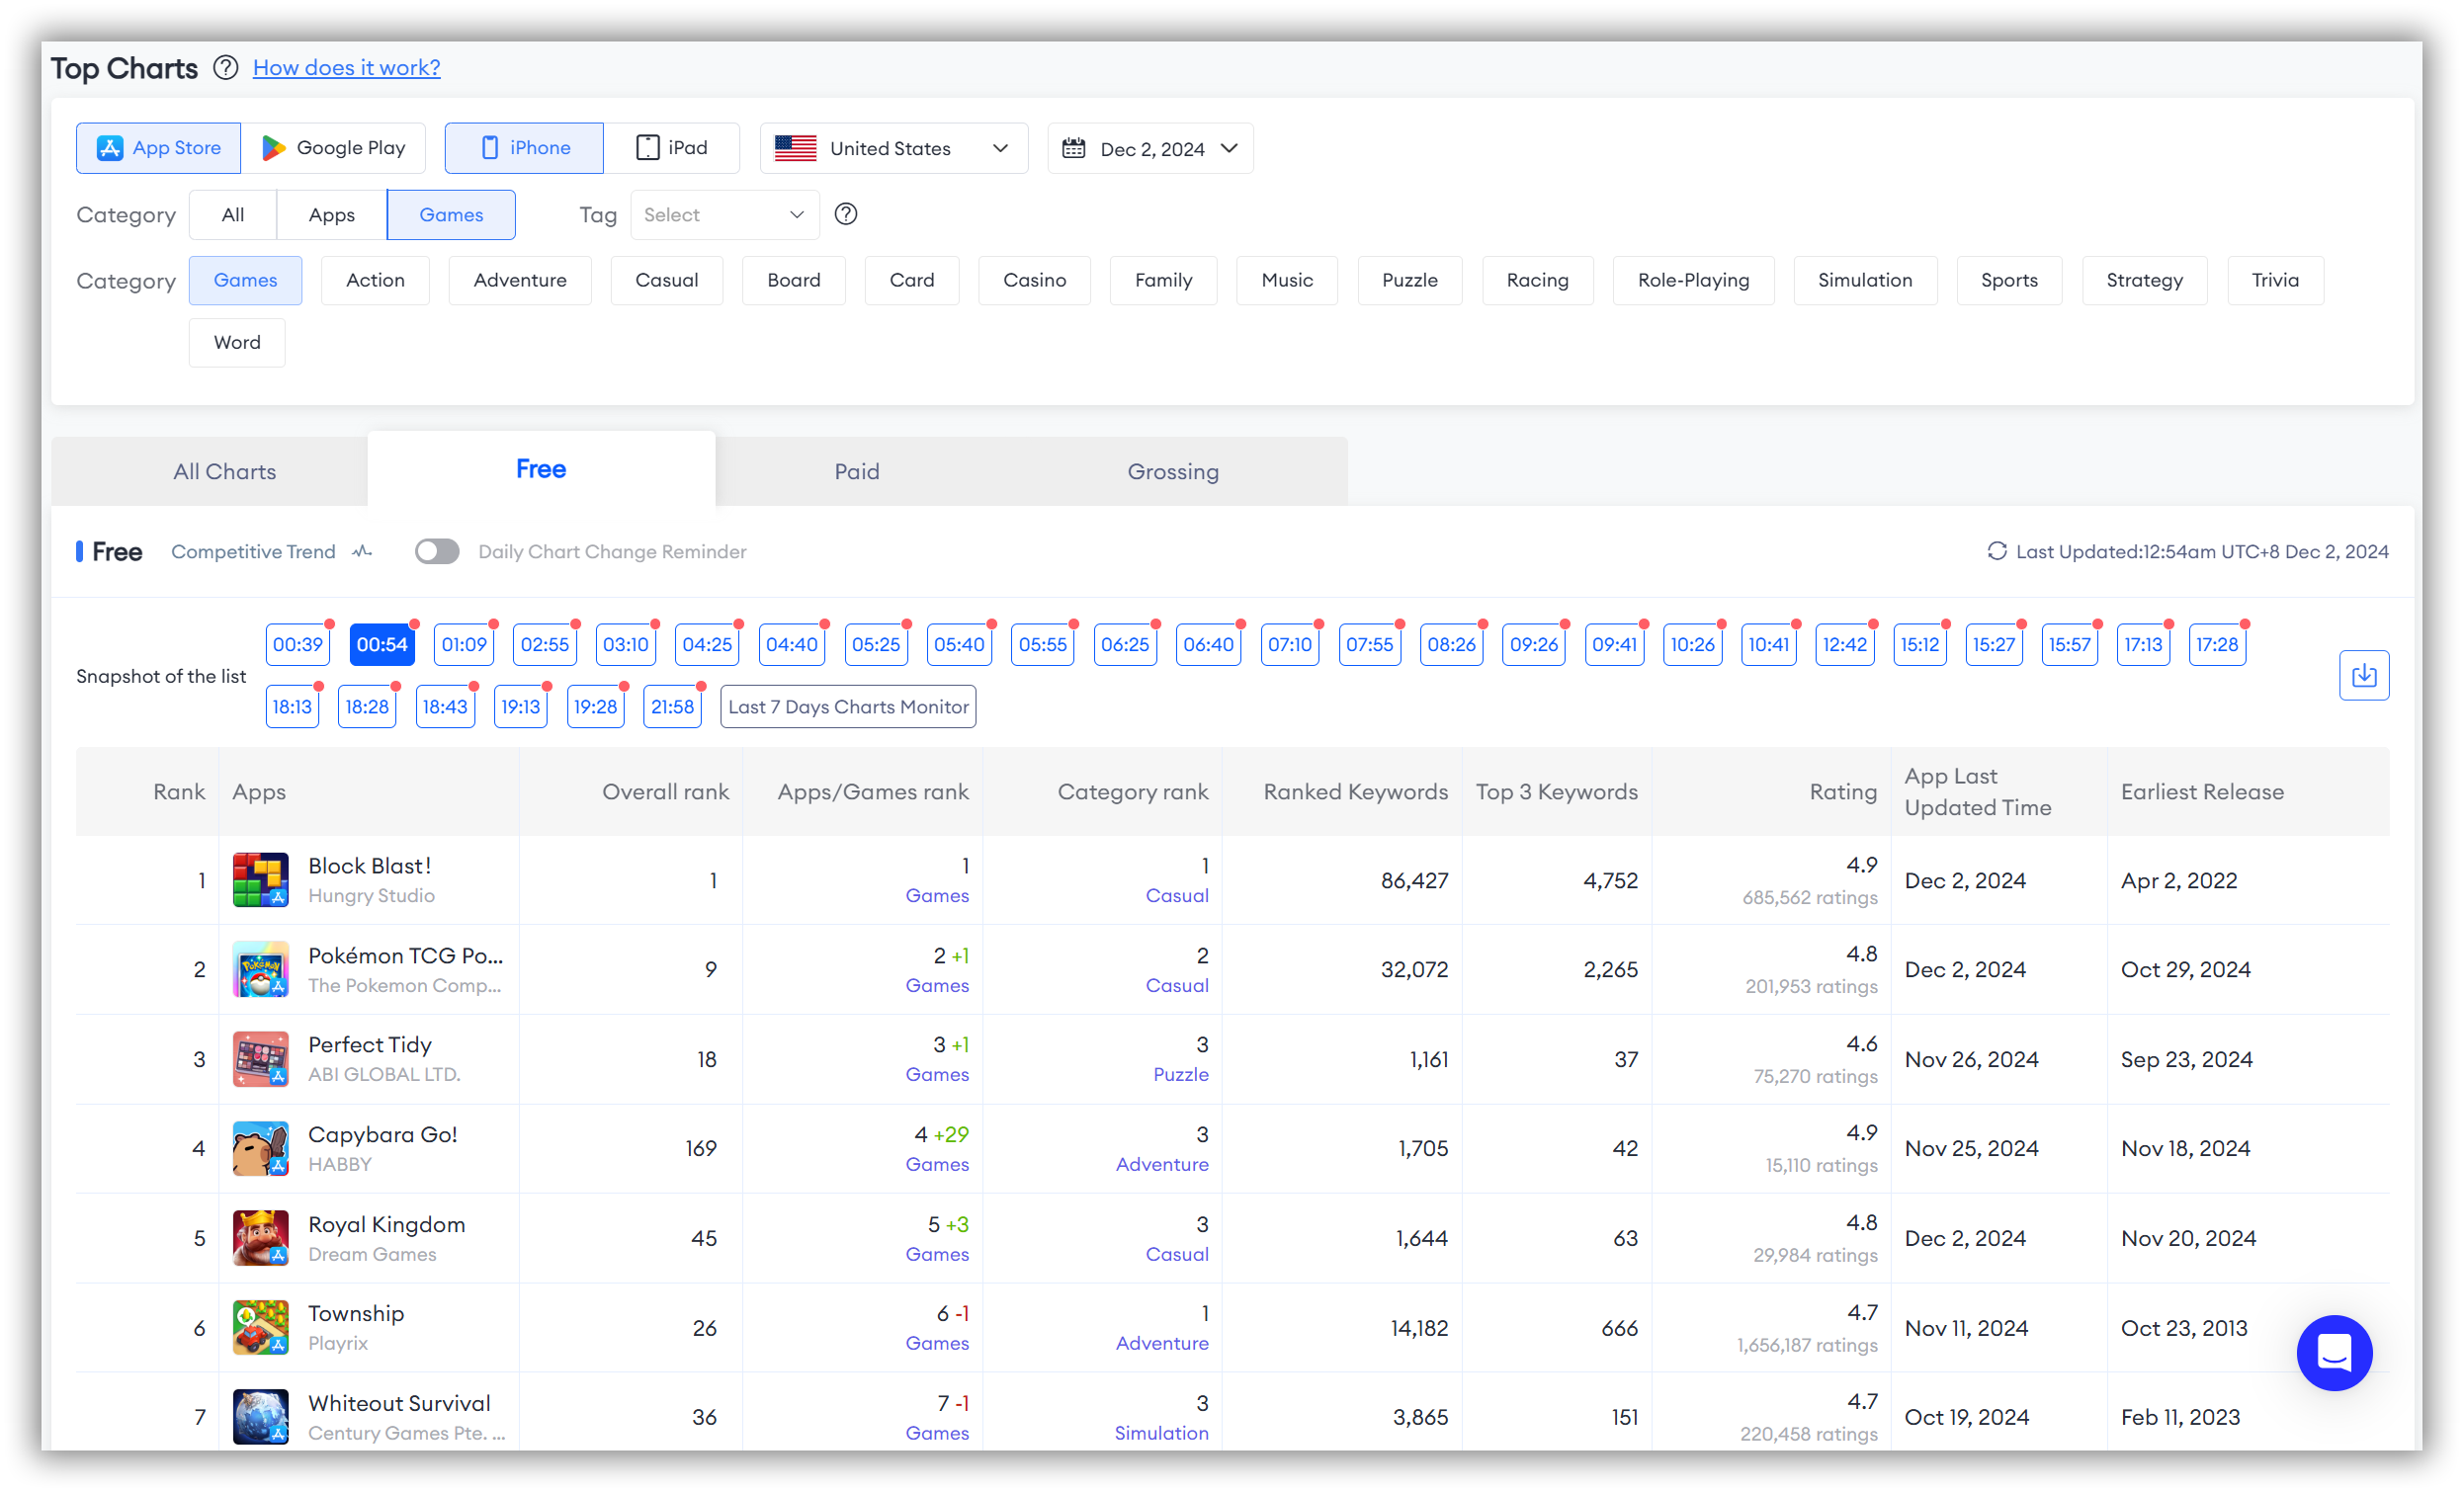
Simply filter by your target country in the "Top Charts" to view the real-time top apps or games under the overall rankings and subcategories "Free," "Paid," and "Grossing," allowing you to understand the overall market trends.
🗒️ Note: The subcategories for the App Store are "Free," "Paid," and "Grossing," while for Google Play, they are "Free," "New Free," "Paid," "New Paid," and "Grossing."
- Free: This chart displays the top free apps with the highest download volumes.
- Paid: This chart lists the top paid apps with the highest download volumes.
- Grossing: This chart shows the top-grossing apps, combining in-app purchases, subscriptions, and ad revenue.
- New Free: This chart showcases newly launched free apps that have achieved high download volumes in a short period.
- New Paid: This chart showcases newly launched paid apps that have achieved high download volumes in a short period.
By analyzing these rankings, developers can gain a better understanding of user behavior and market demand, allowing them to adjust their app development and marketing strategies.
At the same time, market researchers can use this data to predict industry trends and identify new market opportunities.
Want to observe dynamic market trends?
"FoxData - Top Charts" supports you in observing dynamic market trends!
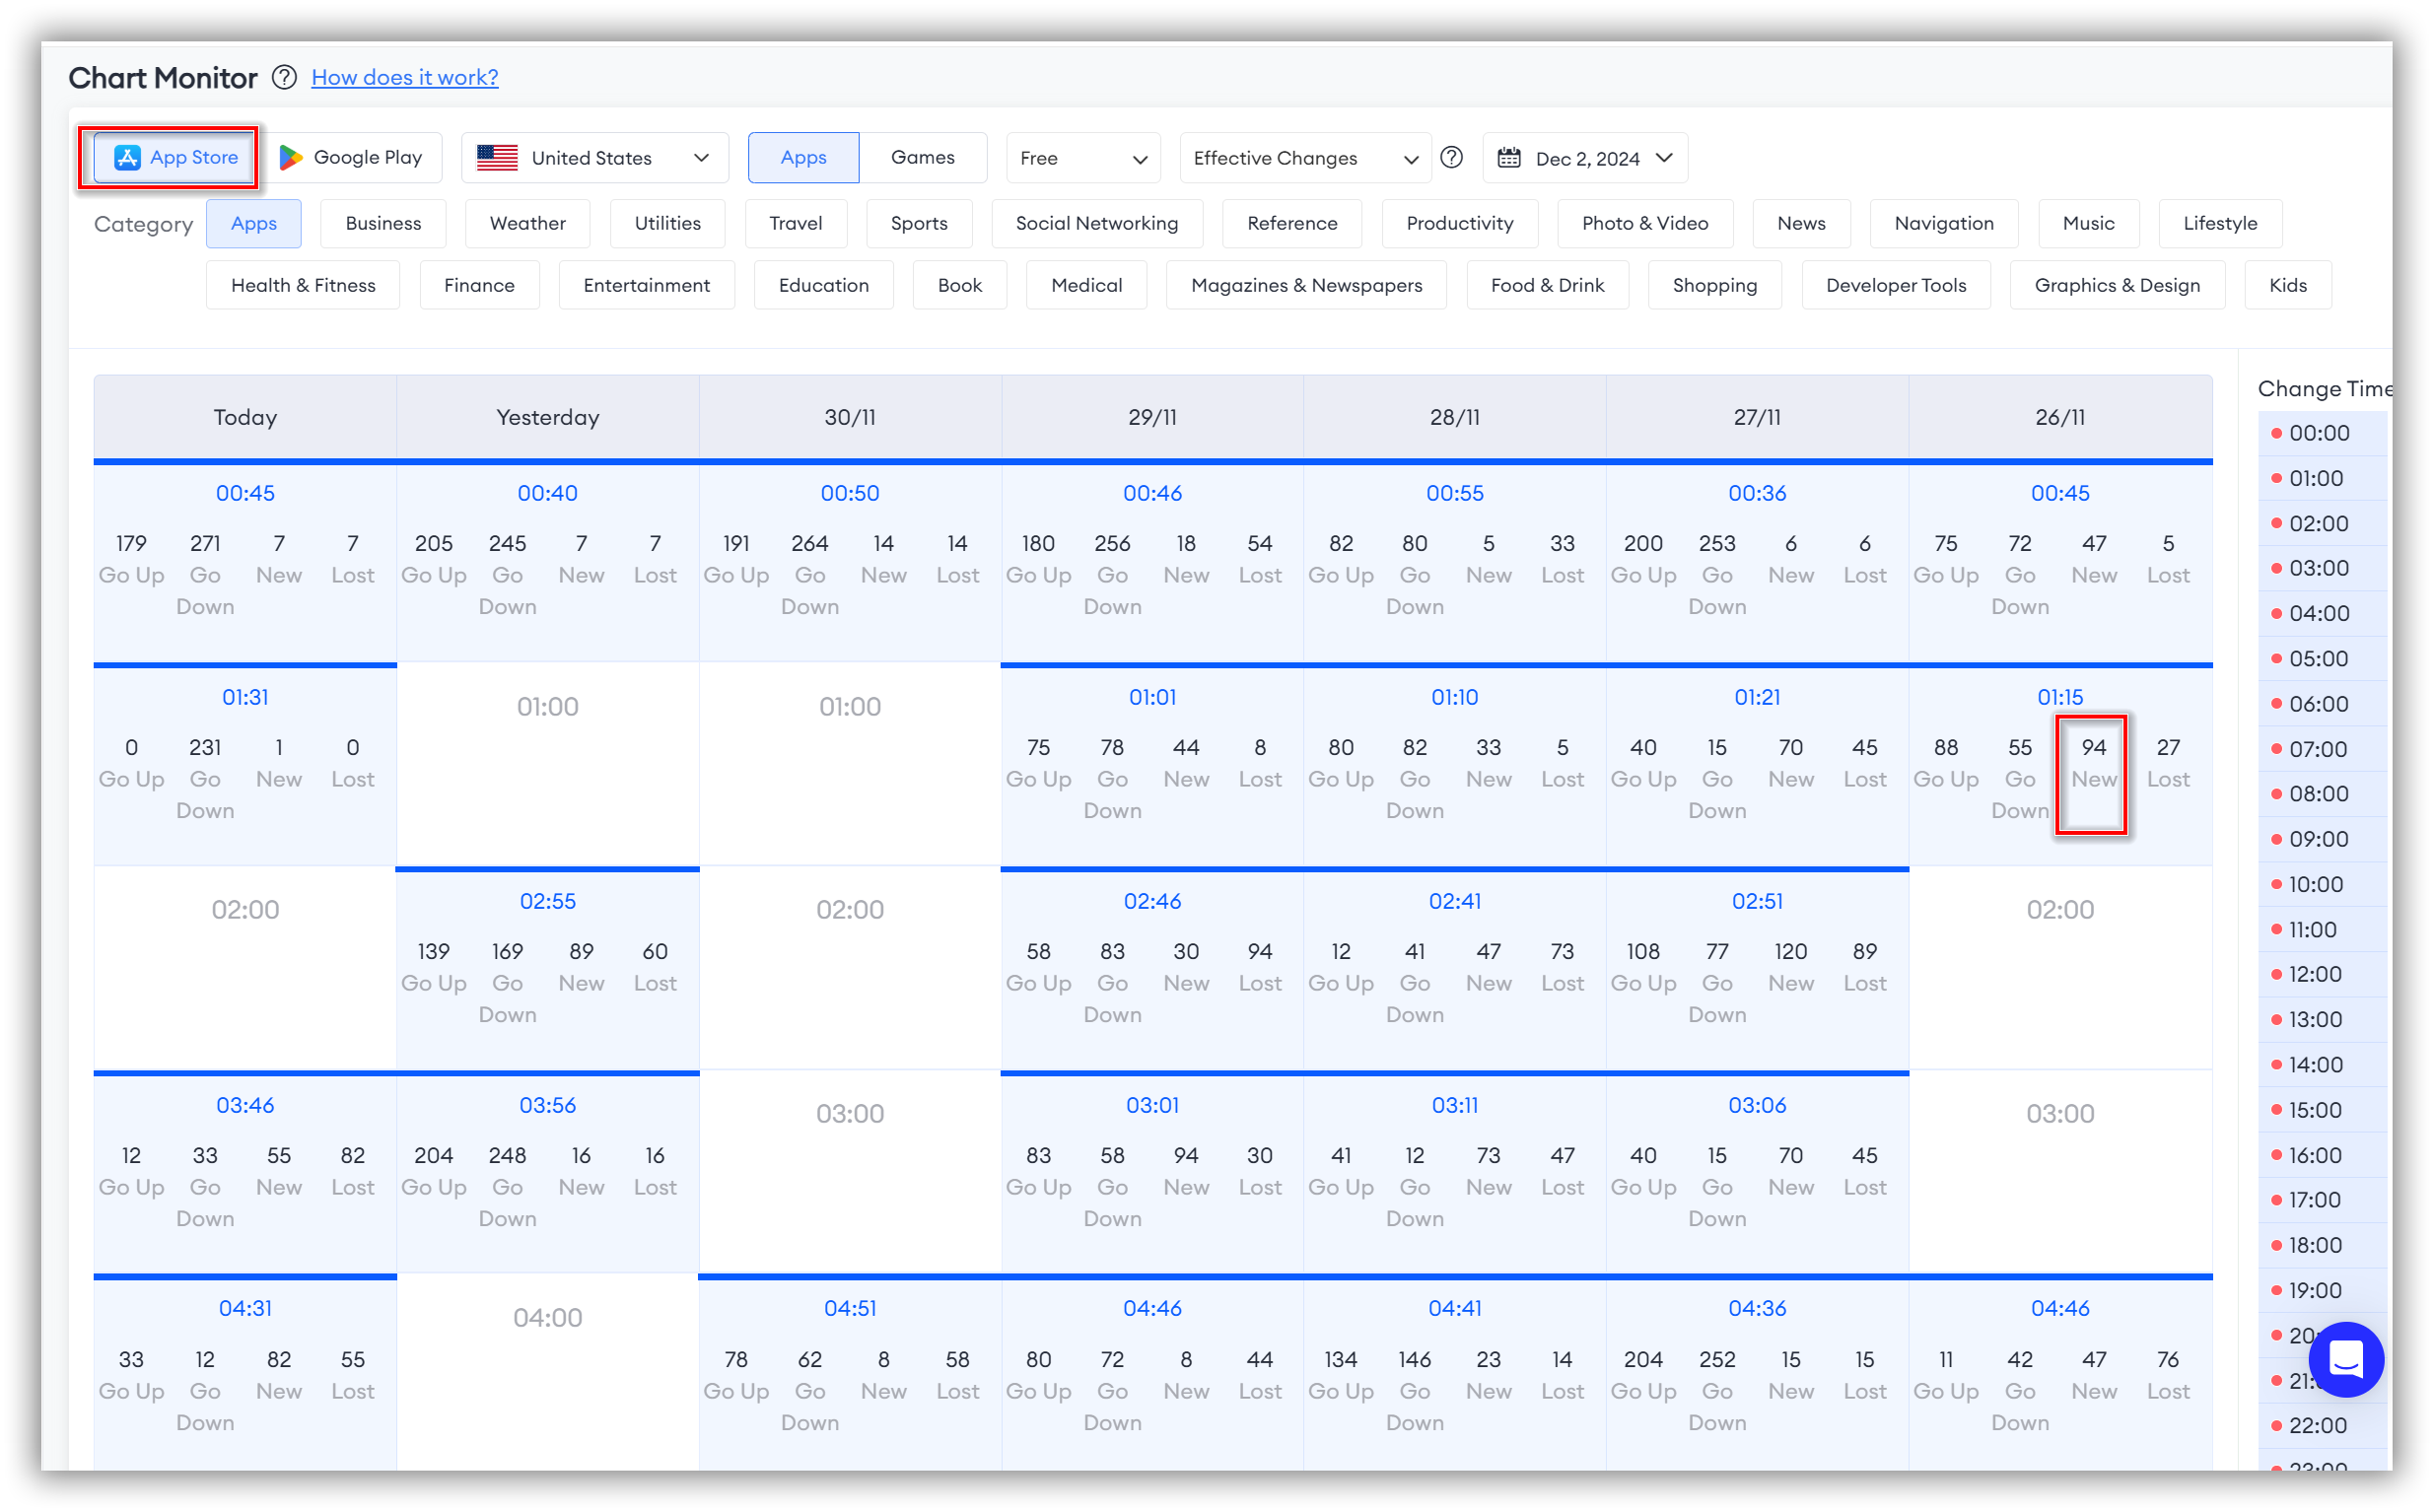
While examining sub-charts like "Free Chart," "Paid Chart," and "Grossing Chart," you can click on "Last 7 Days Charts Monitor" to study an overview of the overall market trends in the app market over the past 7 days.
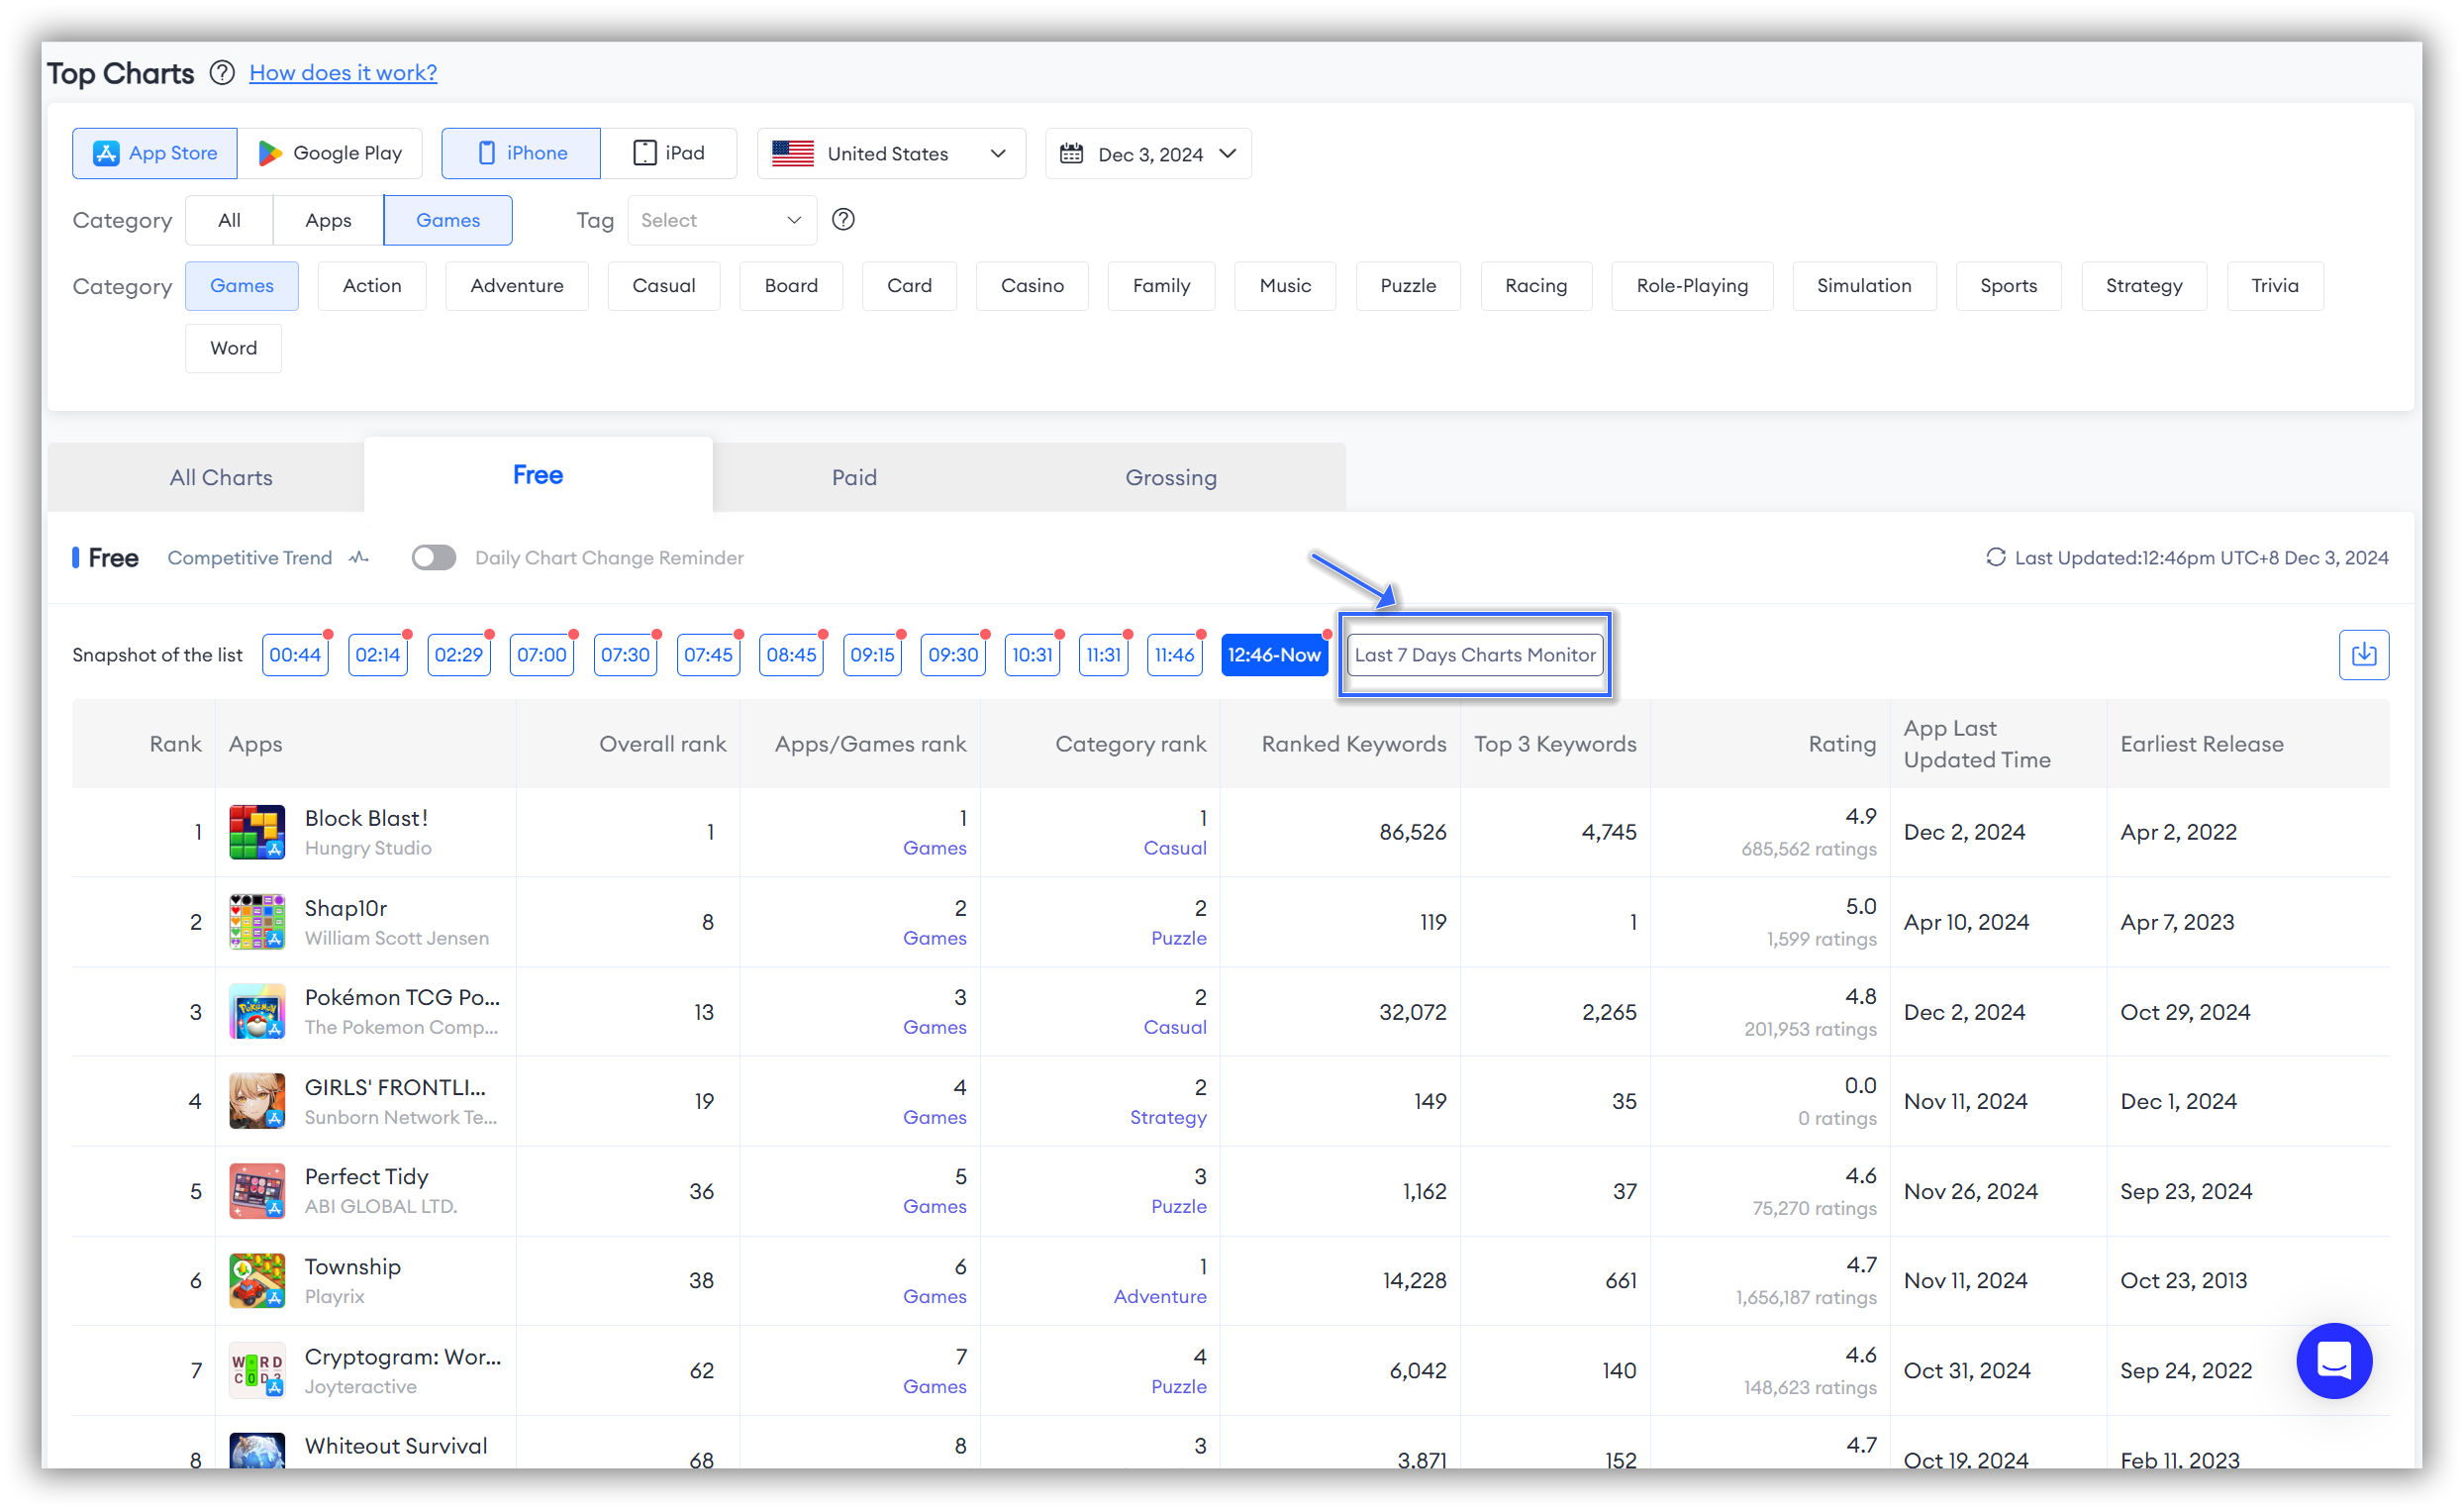
With this feature, you can identify unusual time points for more in-depth research.
As shown in the image below, it's evident that at "Yesterday 00:54," the changes in rising apps in the market were particularly notable, while at "01:09," the changes in declining apps were also especially pronounced.
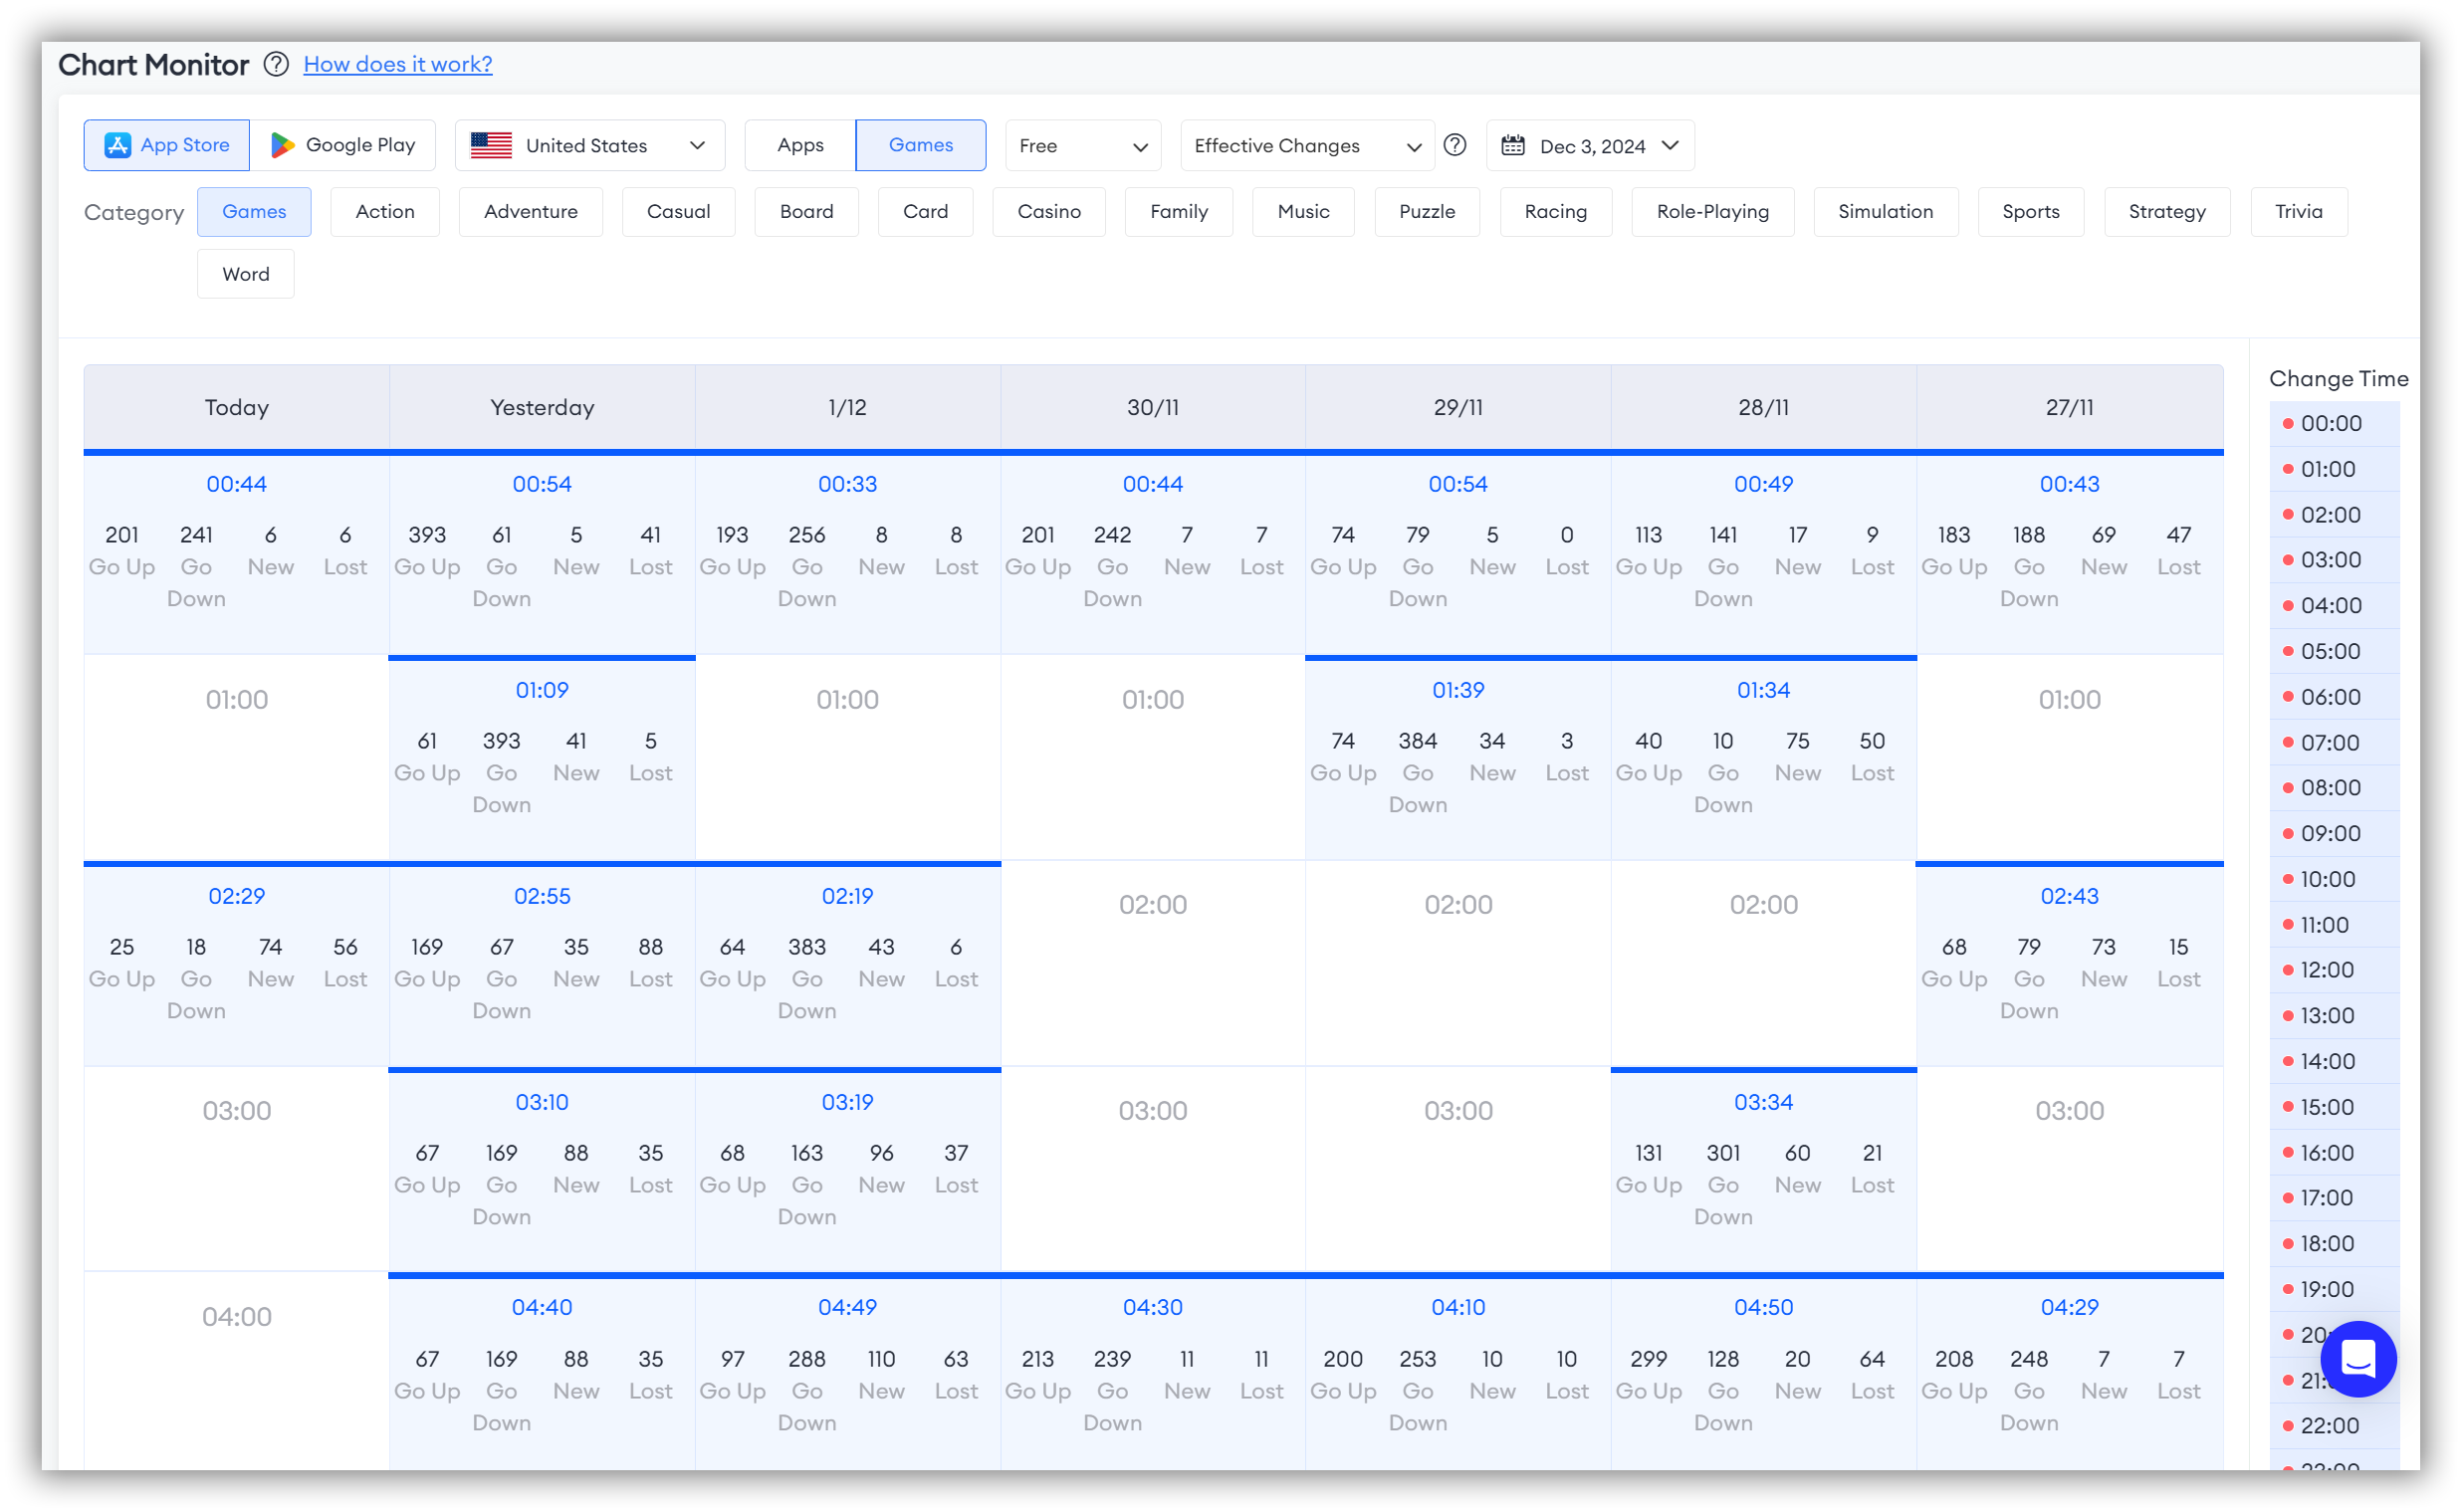
After understanding the market trend overview of specific unusual time points, you can click on the specific time node to view the details.
The above research methods are based on a single, clearly defined target market.
What if you don't have a target country market?
No worries, you can try another feature of FoxData—"
Global Chart Analysis"—to conduct a more comprehensive and in-depth market trend analysis.
This feature is located just below the "Top Charts" function.
With "Global Chart Analysis," you can observe the changes in the global charts overview.
🗒️ Note: When using this feature, don't forget to filter the "Free," "Paid," and "Grossing" sub-charts according to your needs.
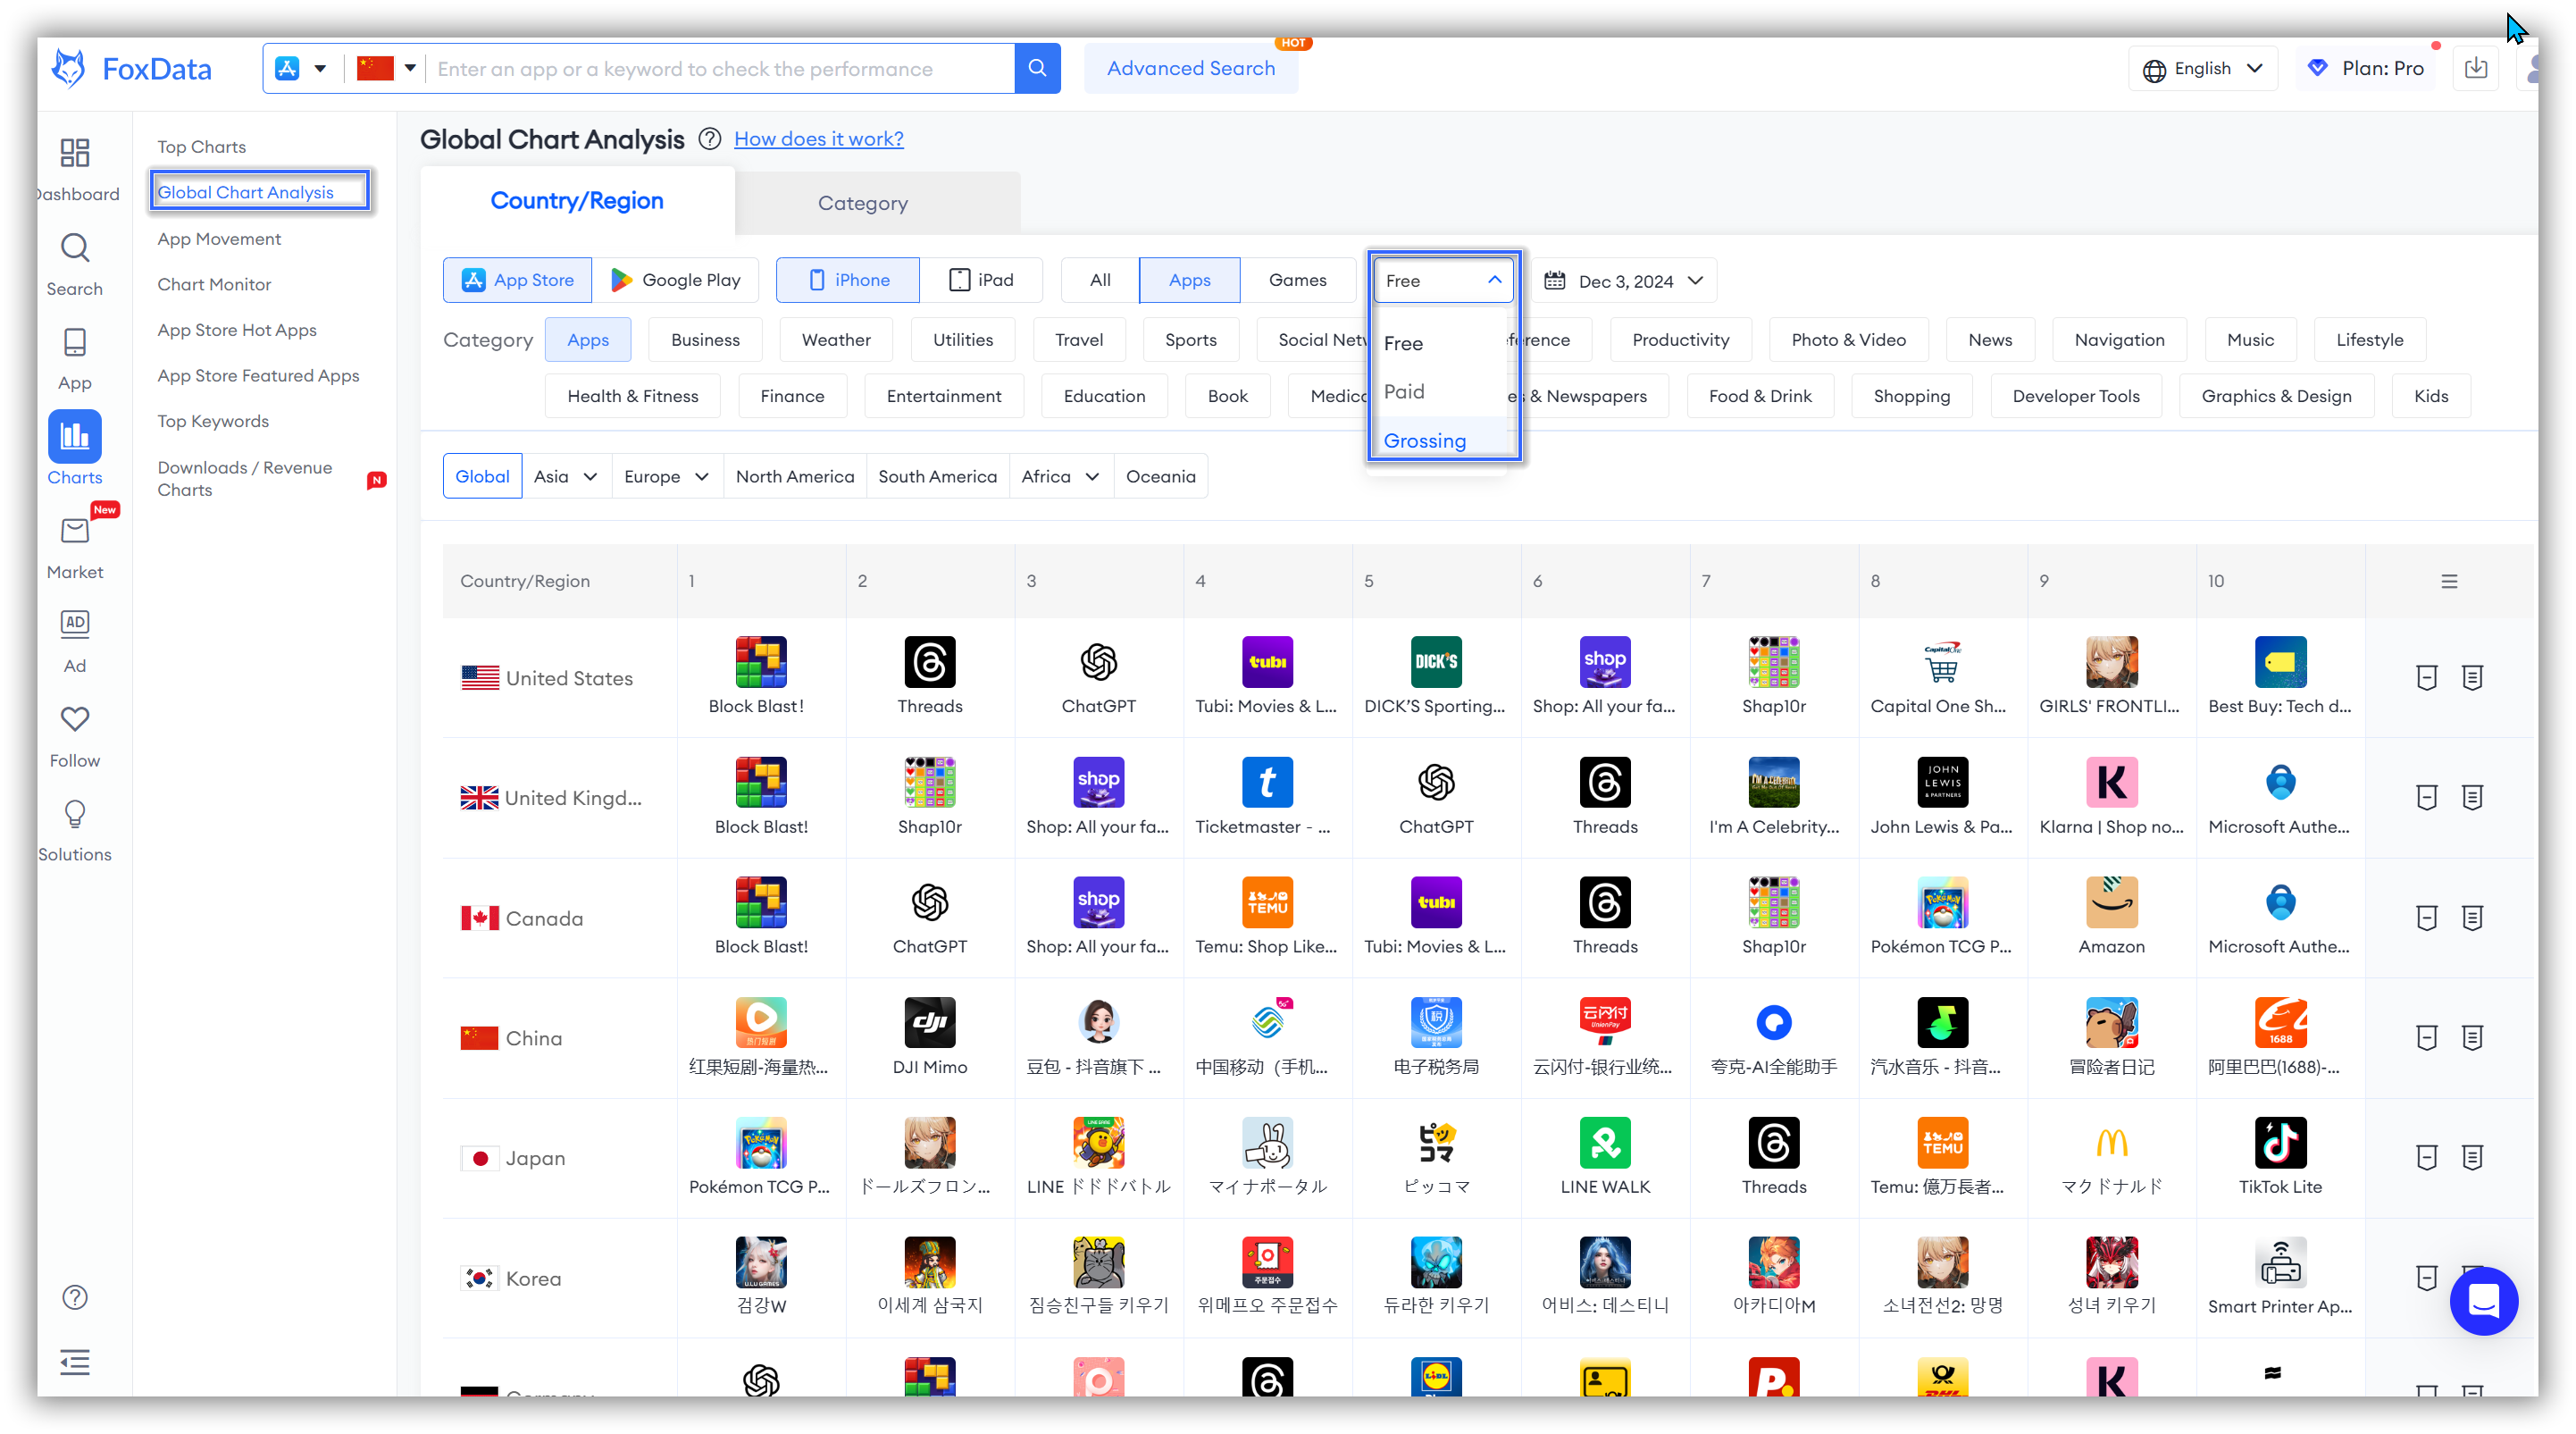
👏 Expert Tips: You can combine "Top Charts" and "Global Chart Analysis" for a comprehensive analysis of the overall market. This approach will provide a holistic perspective for your market research, revealing dynamics and user preferences in both global and regional markets.
2. Market Opportunity
Identify High-Potential Market Segments
By observing which categories of apps frequently appear in the rankings, developers can identify the areas that currently interest users the most.
Searching for underdeveloped segments within popular categories can help developers find market opportunities and offer more focused or differentiated products.
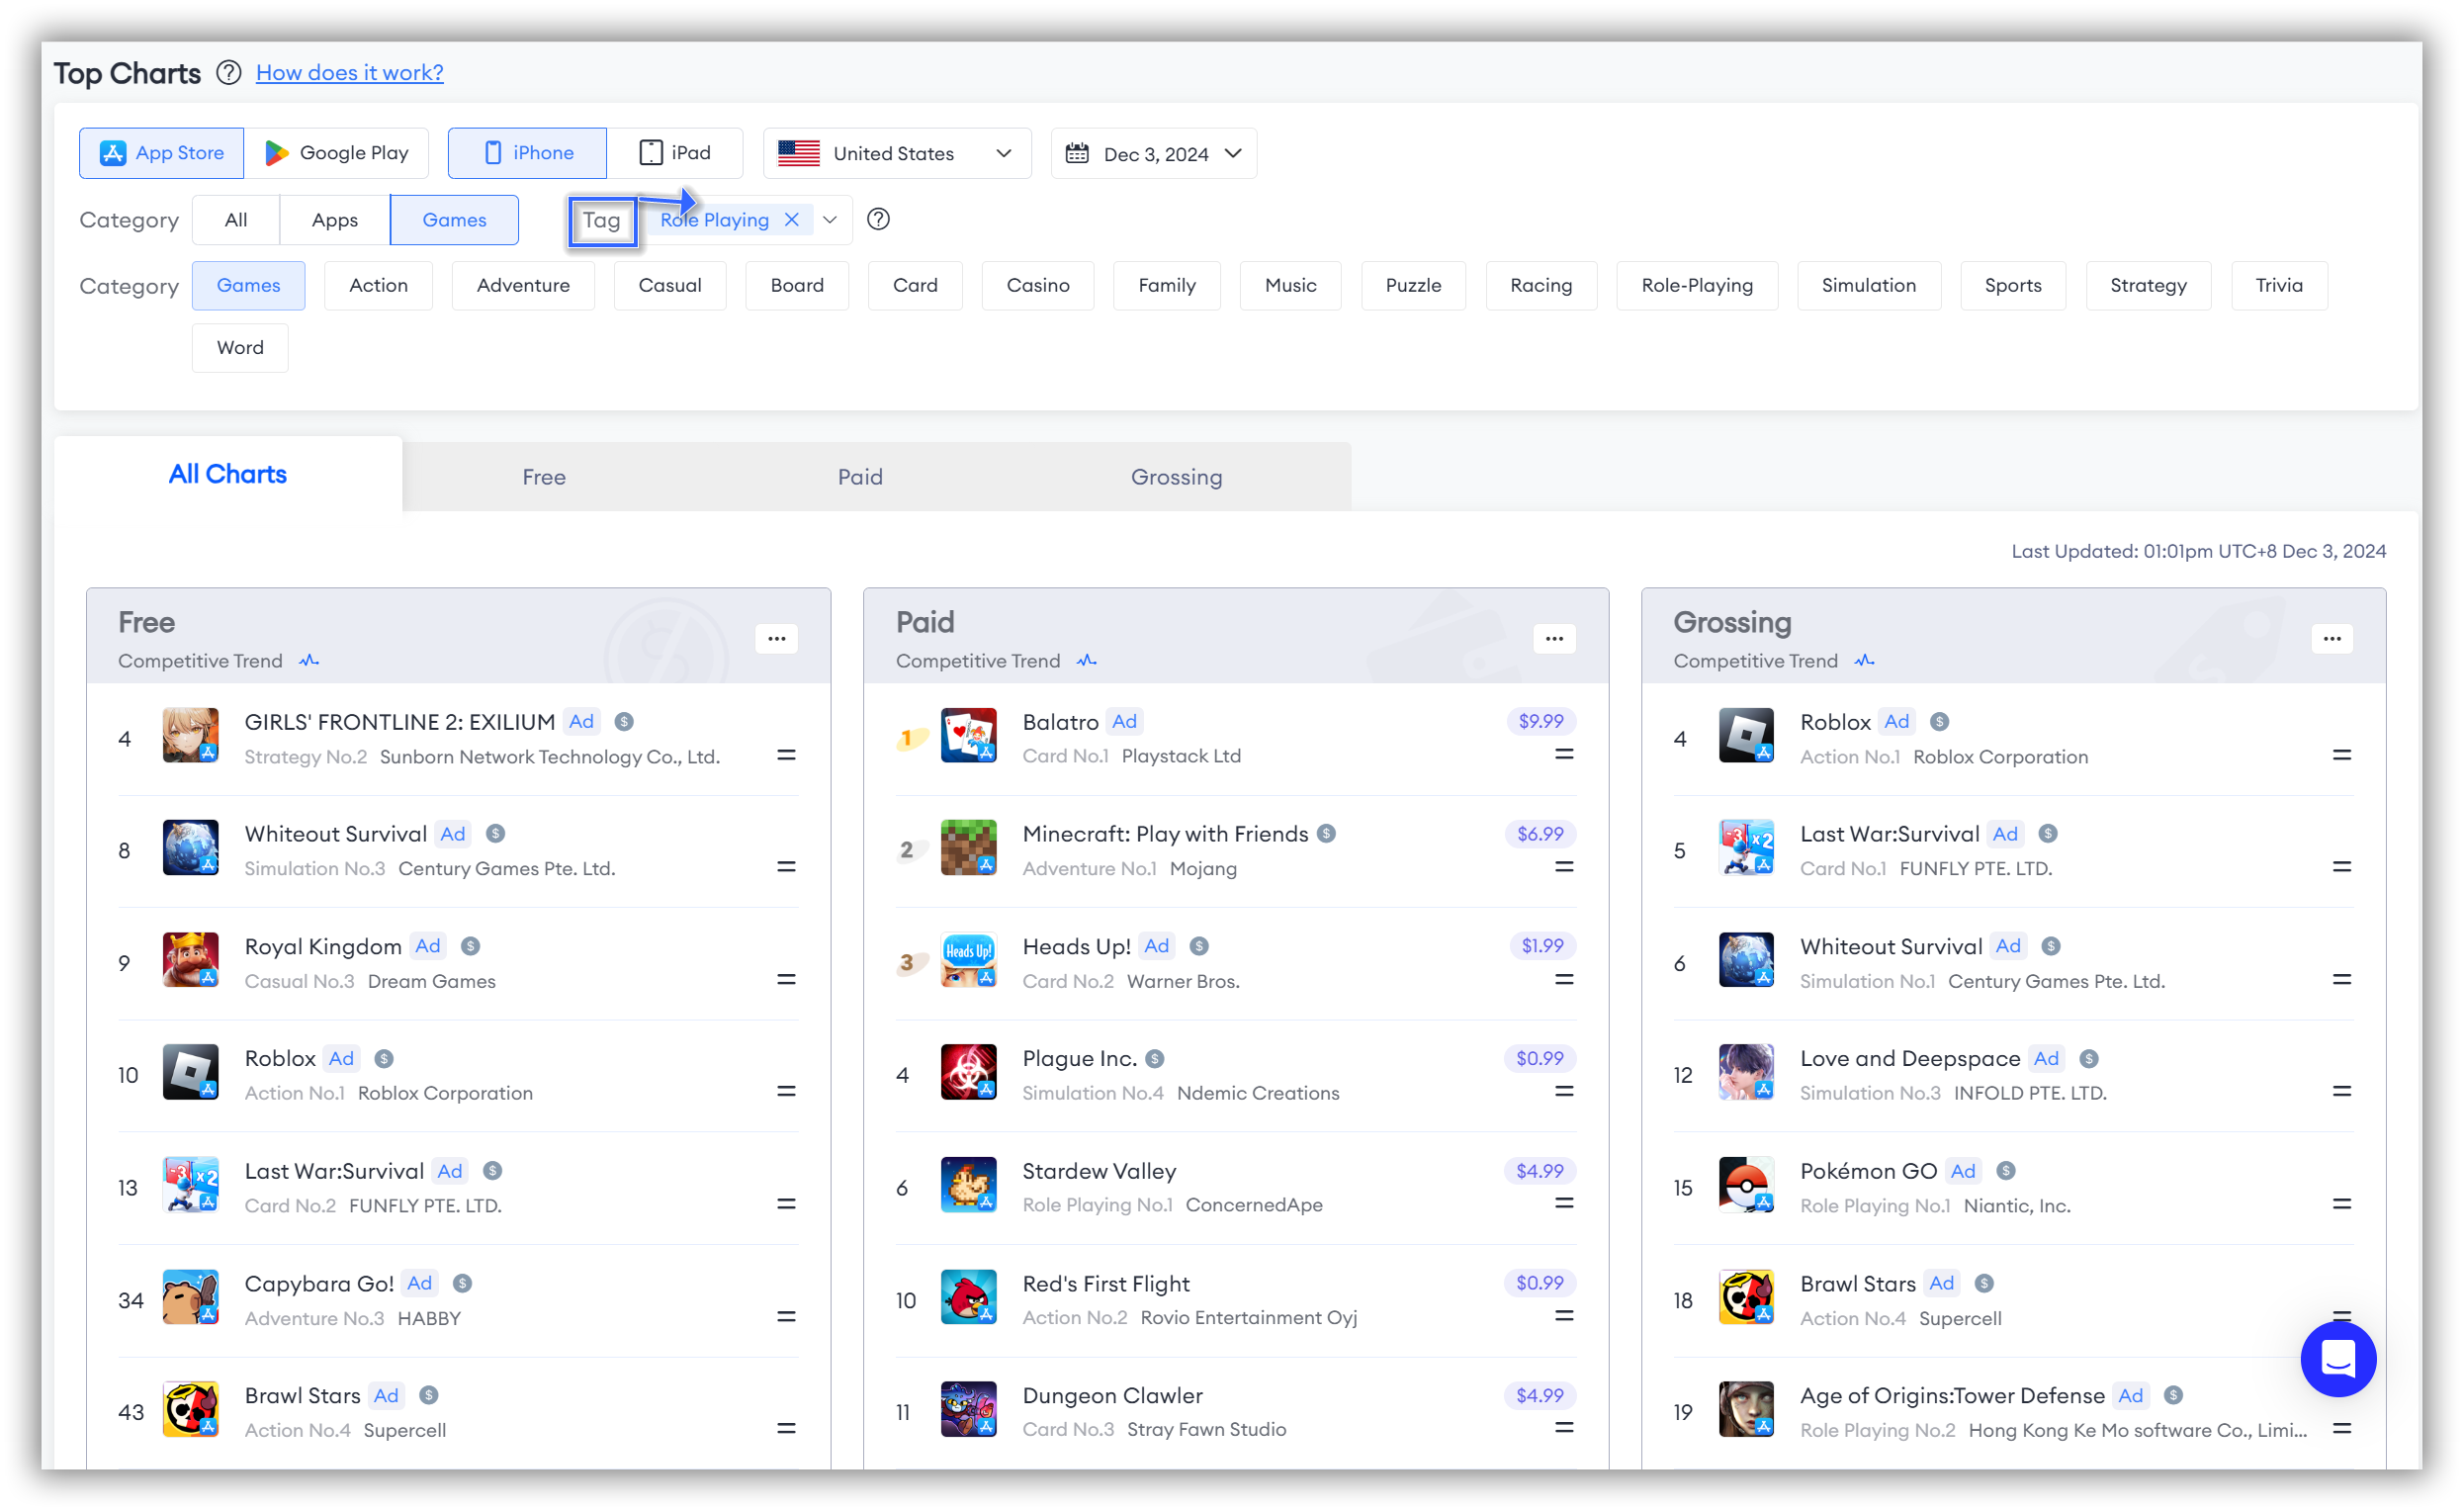
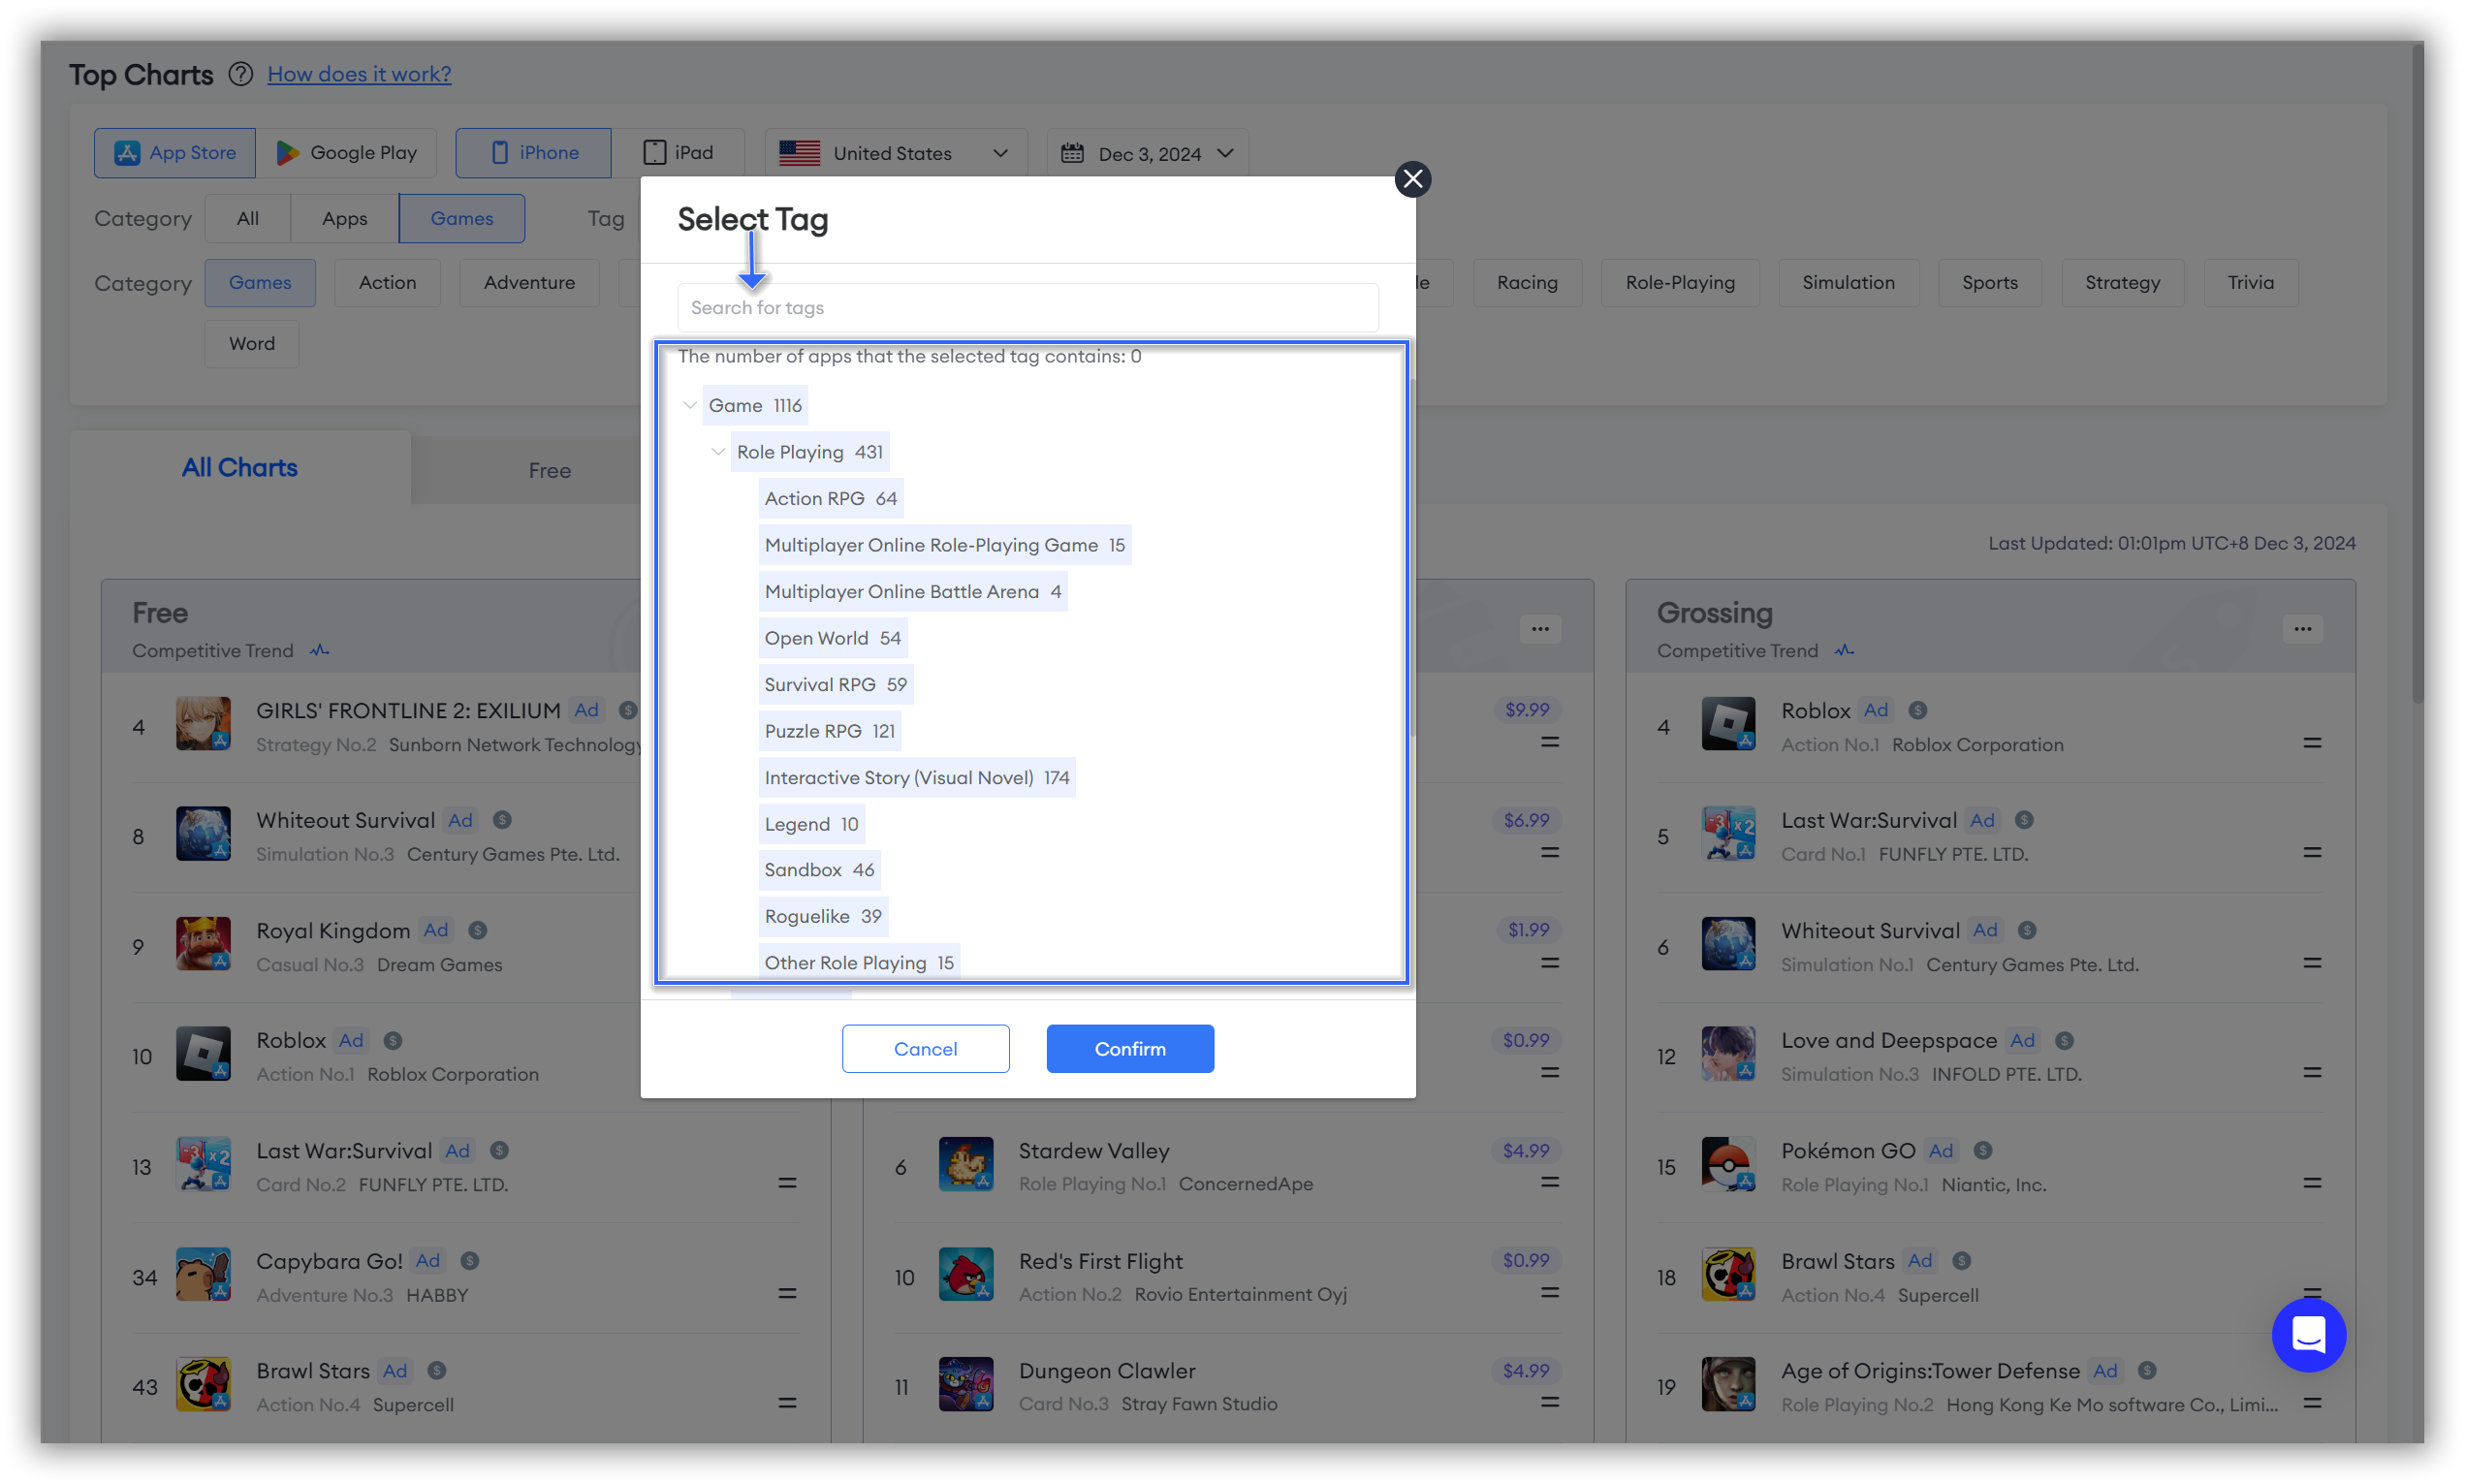
FoxData's "Top Charts" not only display app rankings but also show app categories.
Once you have easily identified the categories that frequently appear in the charts, you only need to study the segmented "tags" in the "Top Charts" to easily find those underdeveloped segments within popular categories.
Identify Emerging App Types
Developers and market researchers need to pay attention to the rise of new types of apps, as this may indicate changes in user demand.
For example, the rise of short video apps has provided new opportunities for content creators and related services.
By observing the trend of integration between different categories of apps, developers can create cross-category apps to meet diverse needs.
FoxData helps you conveniently observe emerging app types.
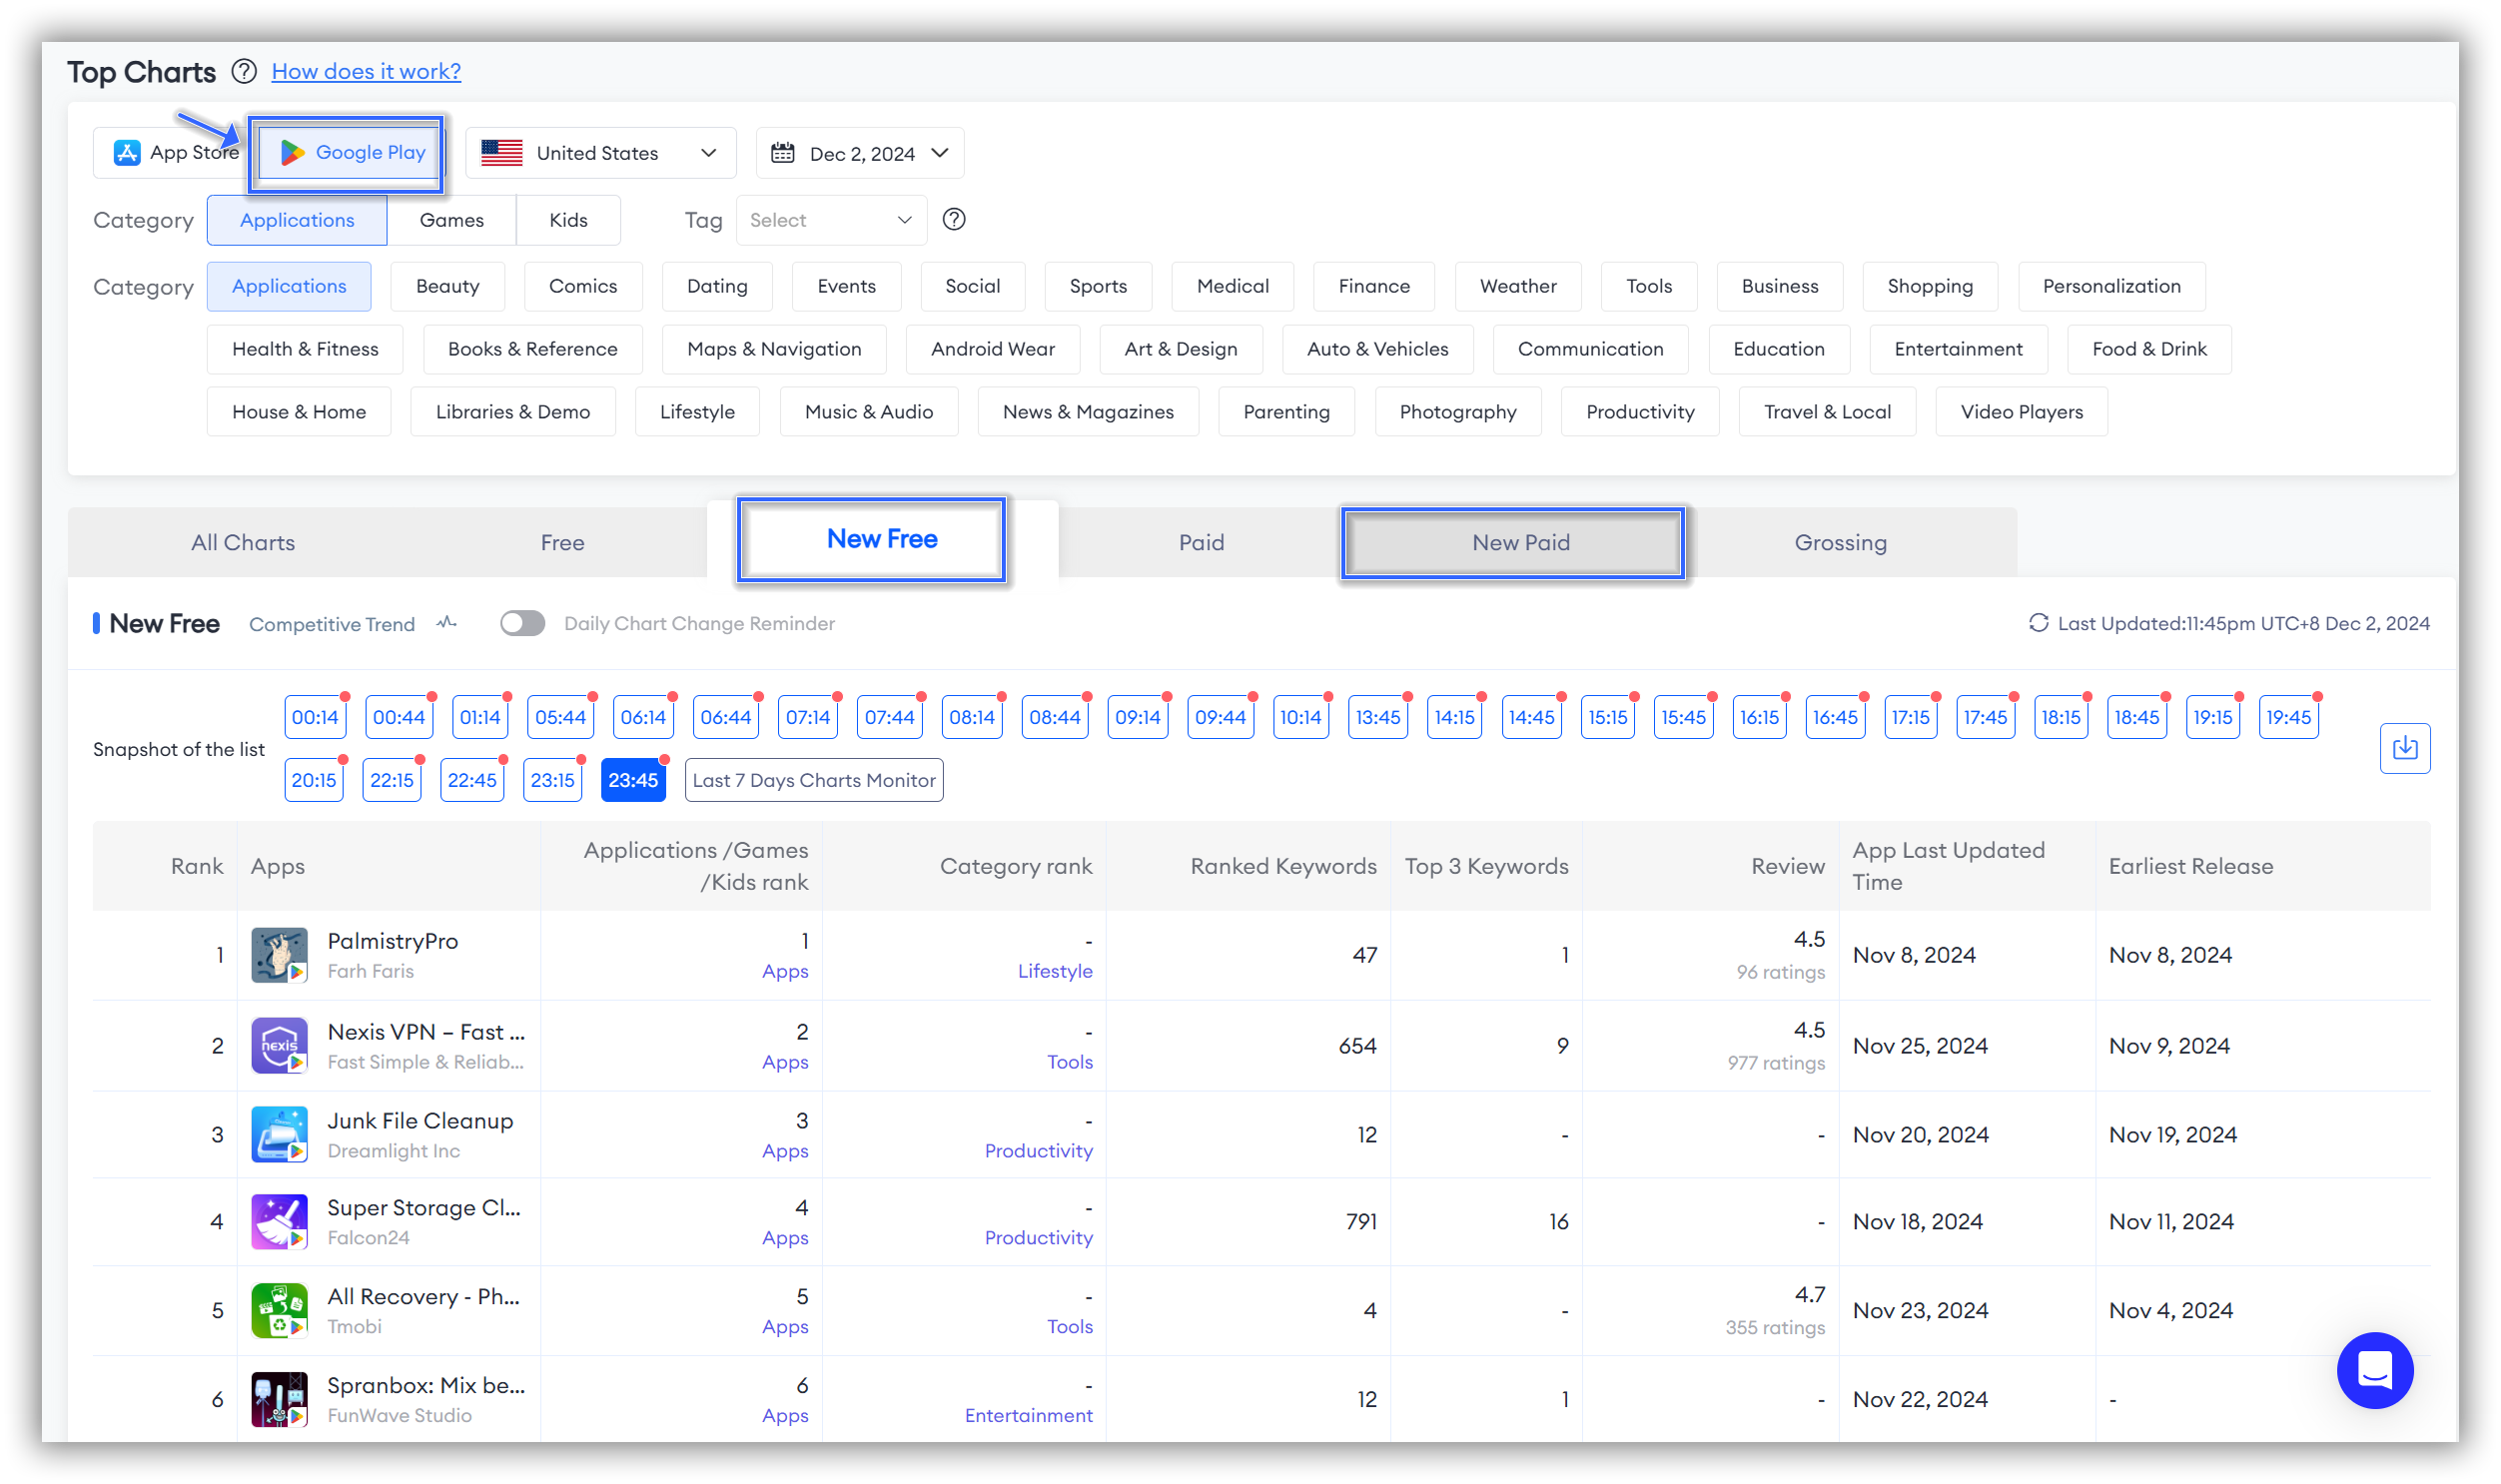
If you want to explore apps on Google Play, you just need to switch to Google Play to directly study the "New Free" and "New Paid" apps.
If you want to study apps on the App Store, you can use sub-charts like the "Free Chart," "Paid Chart," and "Grossing Chart."
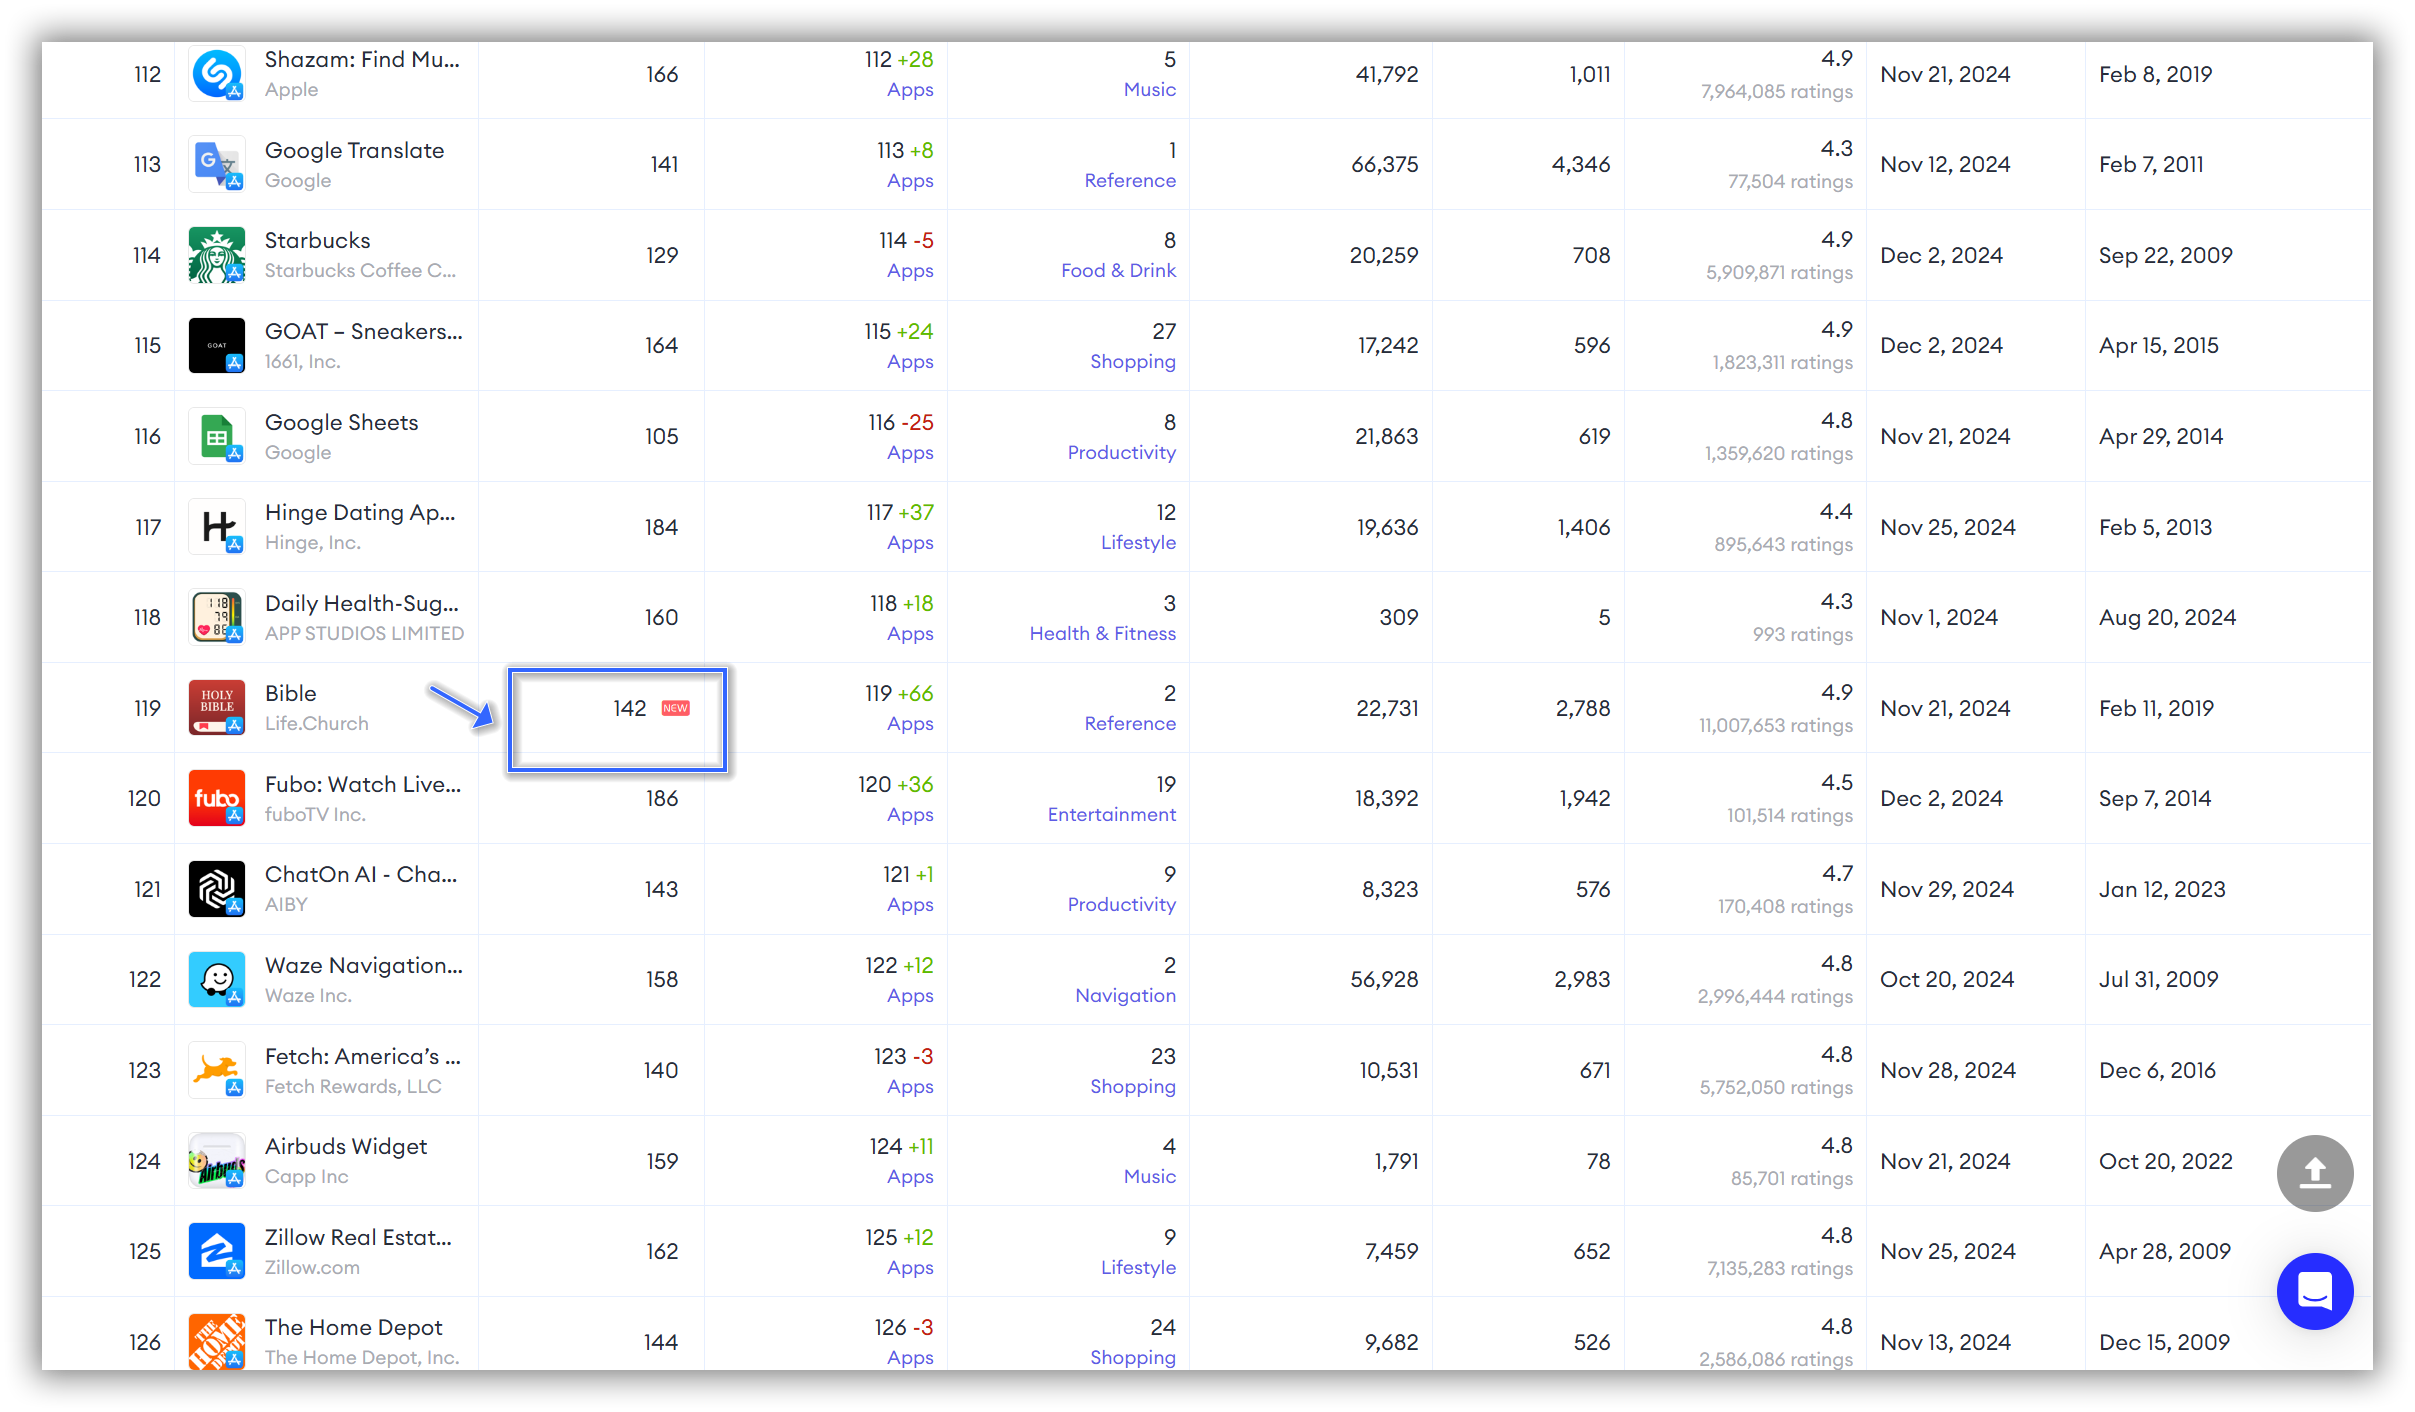
By examining the "New" indicator under the "Last 7 Days Charts Monitor," you can research new apps and types that have ranked high in the market over the past 7 days.
👏 Expert Tips: We recommend selecting time points with a high "New" indicator for detailed research, as this can help you quickly focus on and study newly listed apps.
After clicking on a time point to enter the detailed page, you can directly find apps marked with "New" on the page for in-depth research.
3. Product Optimization
By tracking changes in competitors' rankings on the charts, developers can understand shifts in market demand.
For example, if a competitor's ranking suddenly rises, it might indicate that they have launched new features or conducted a successful marketing campaign.
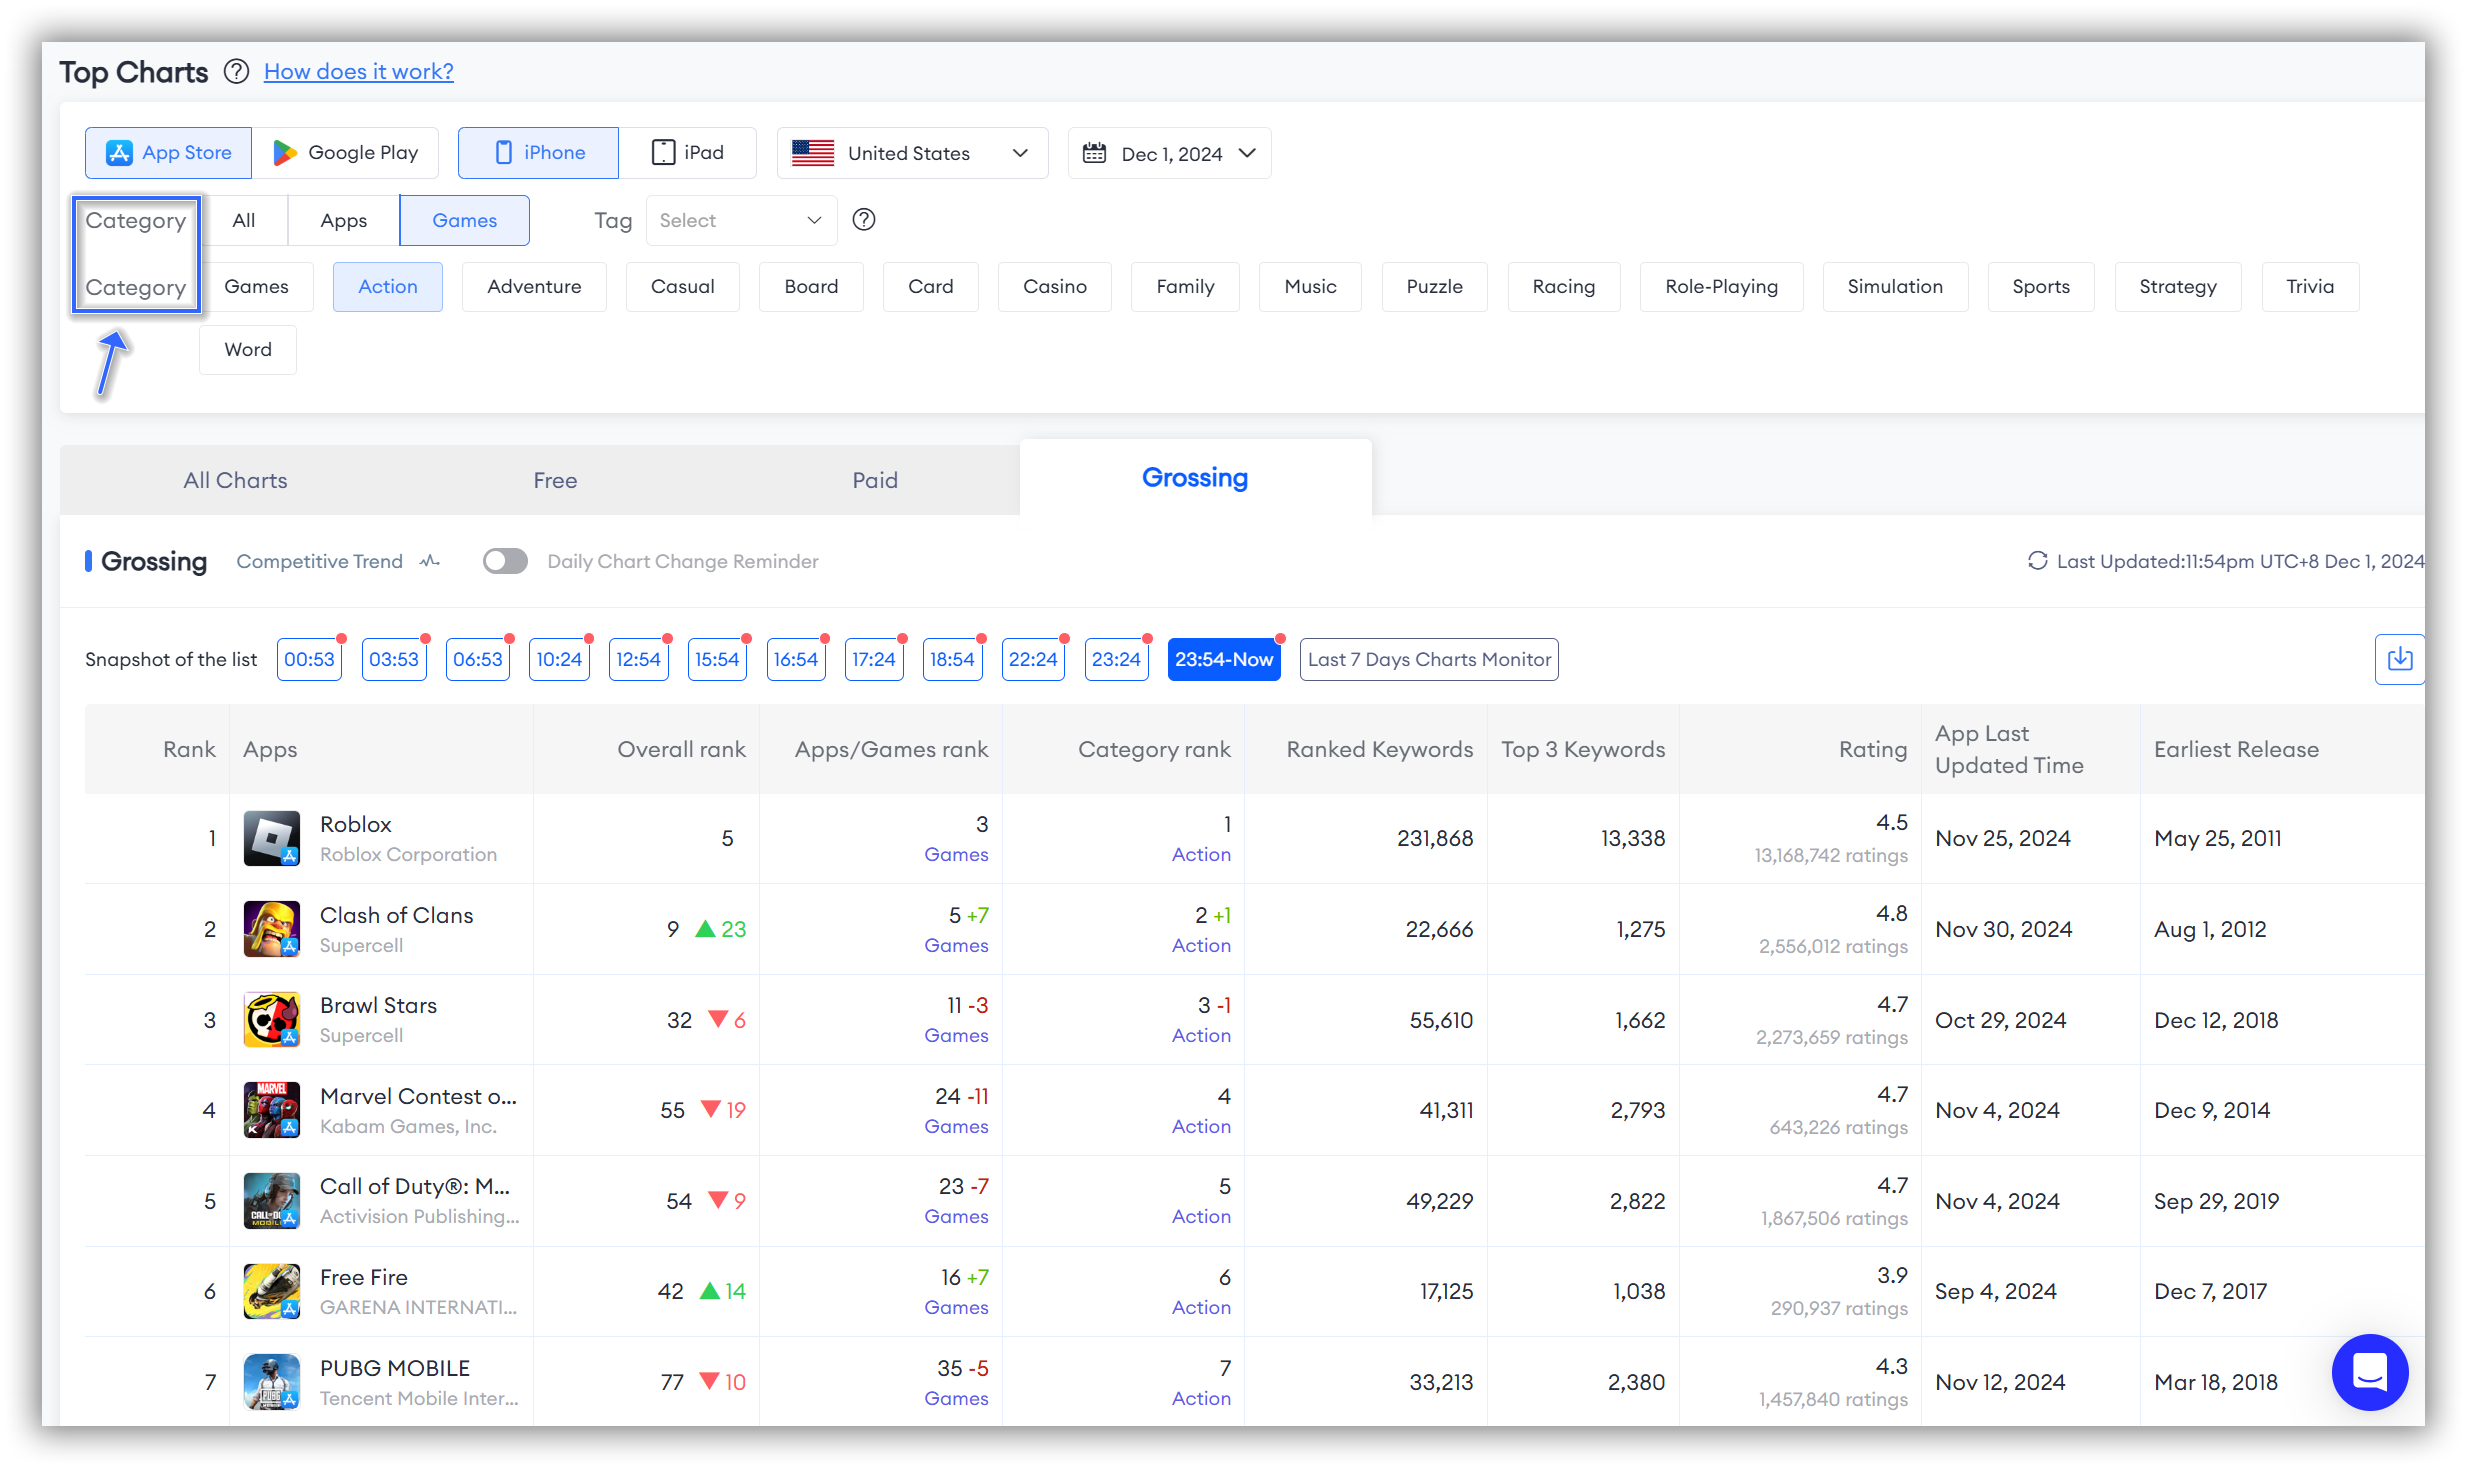
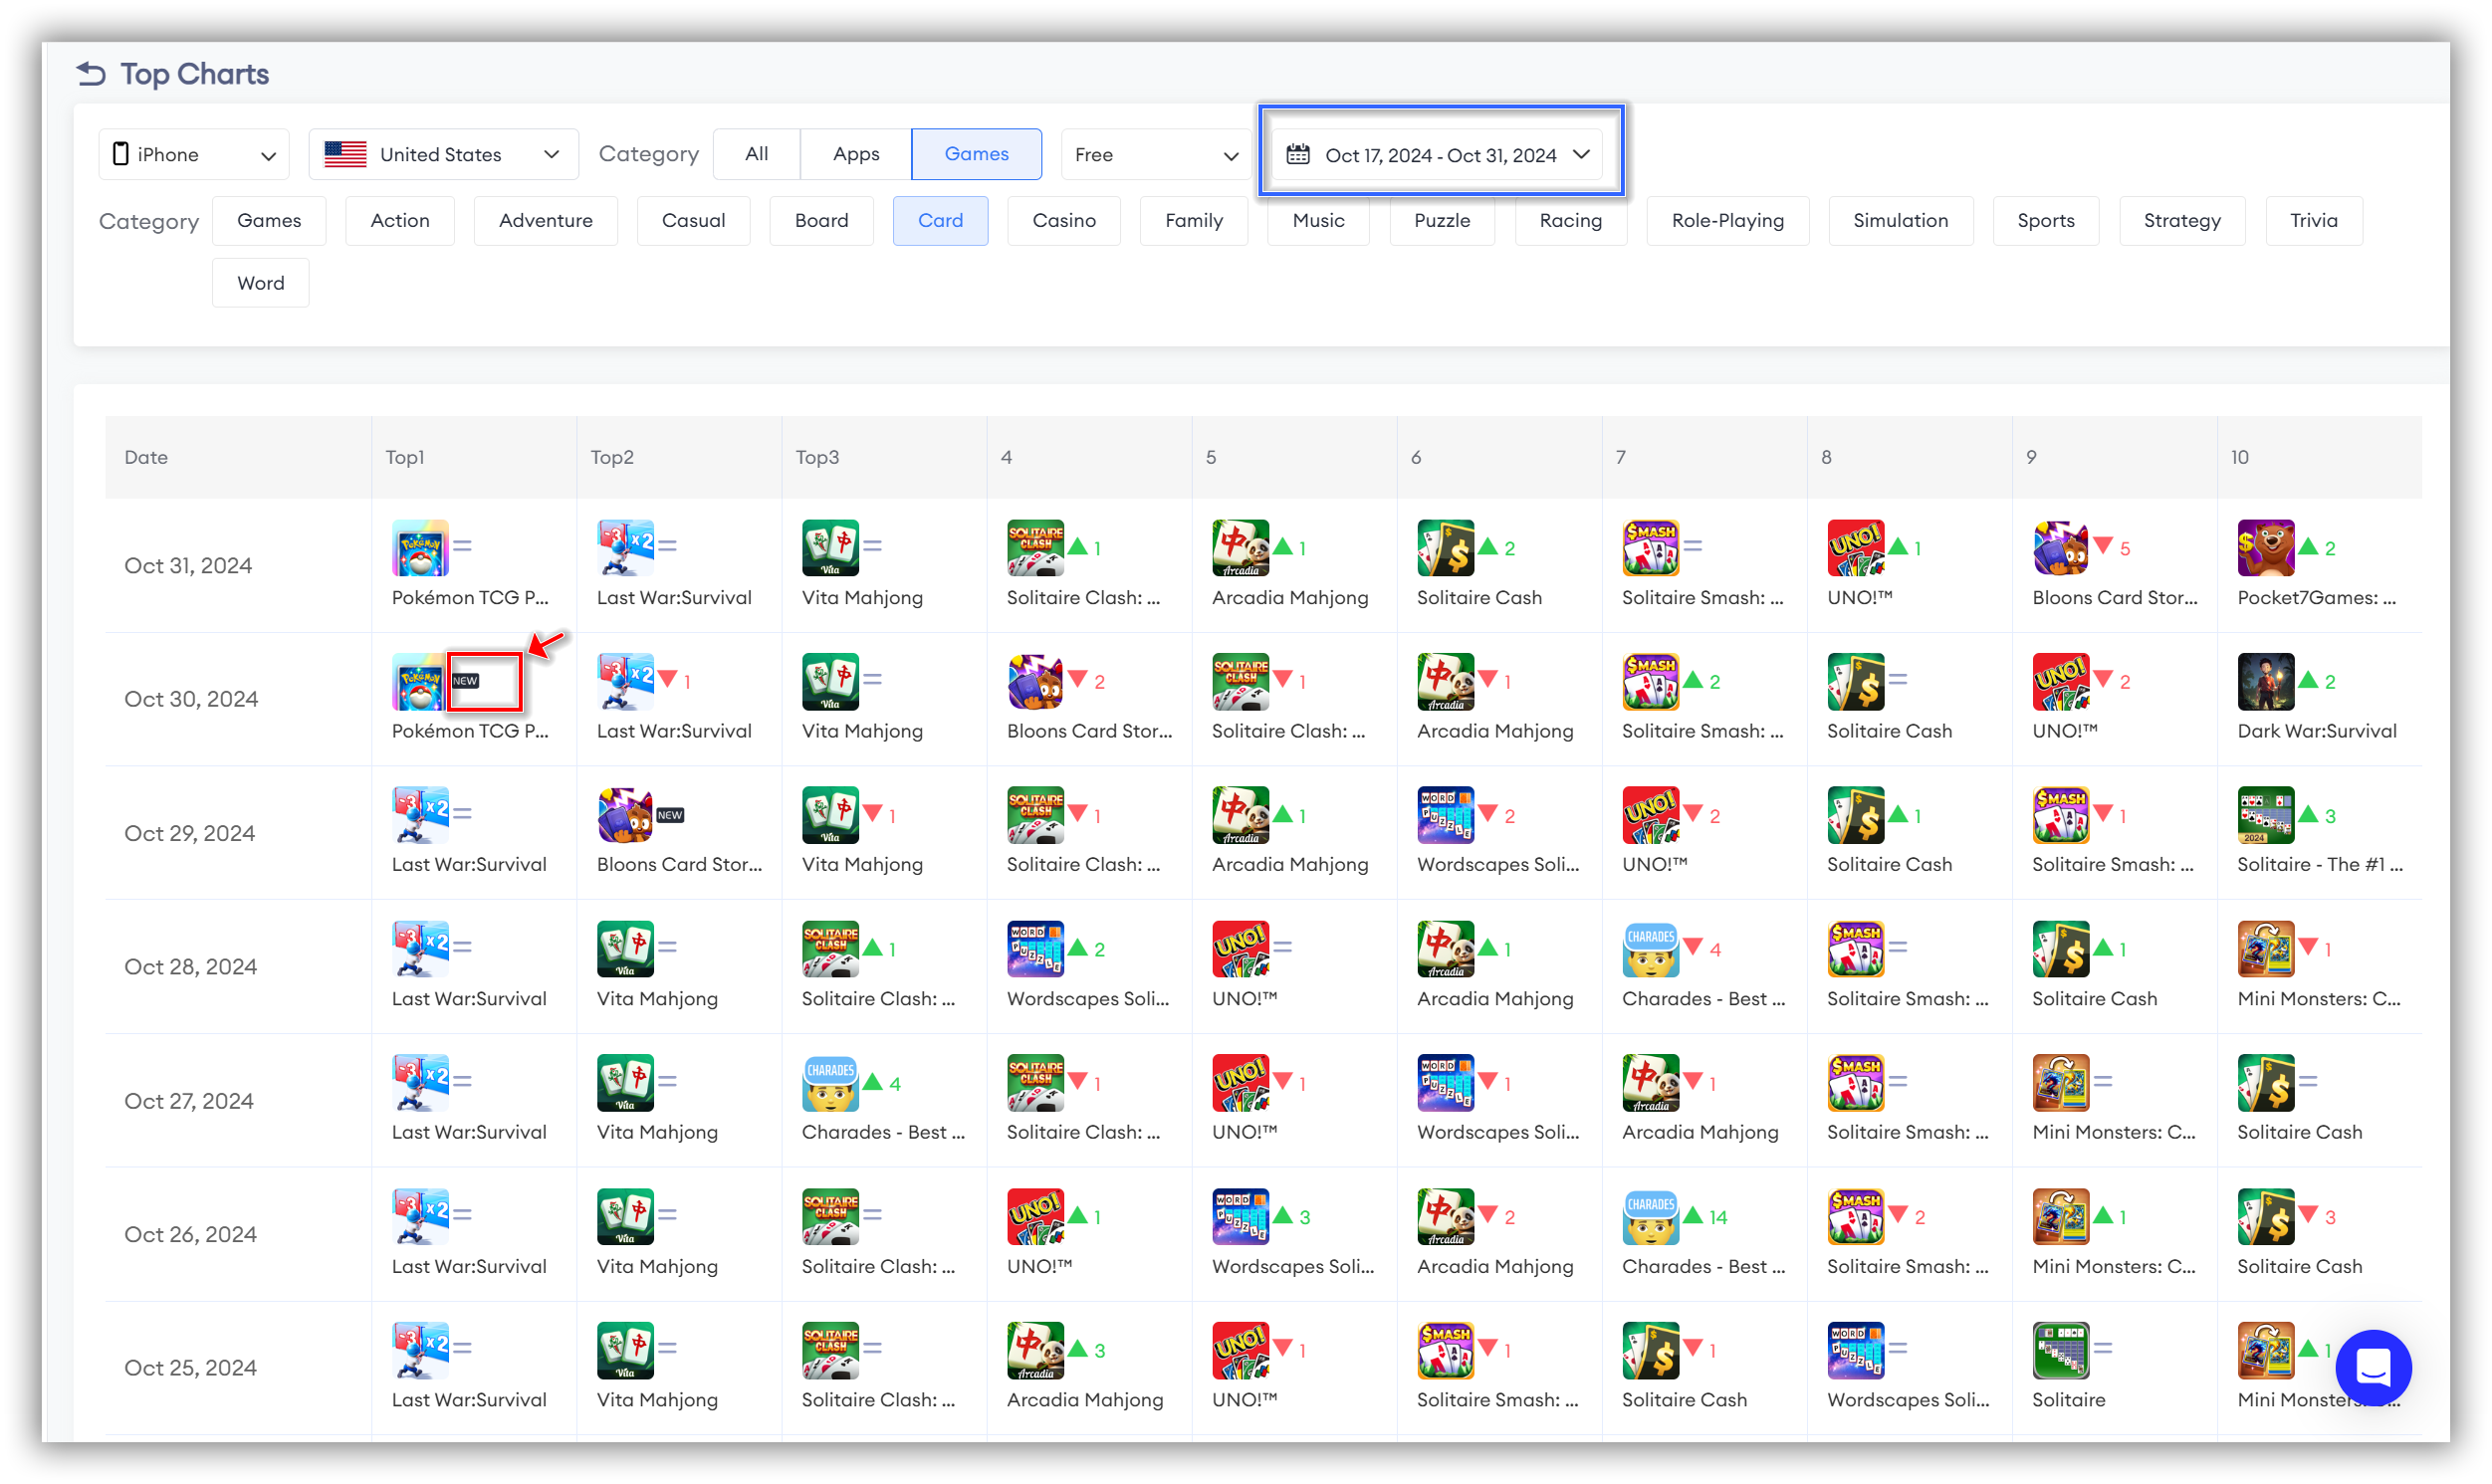
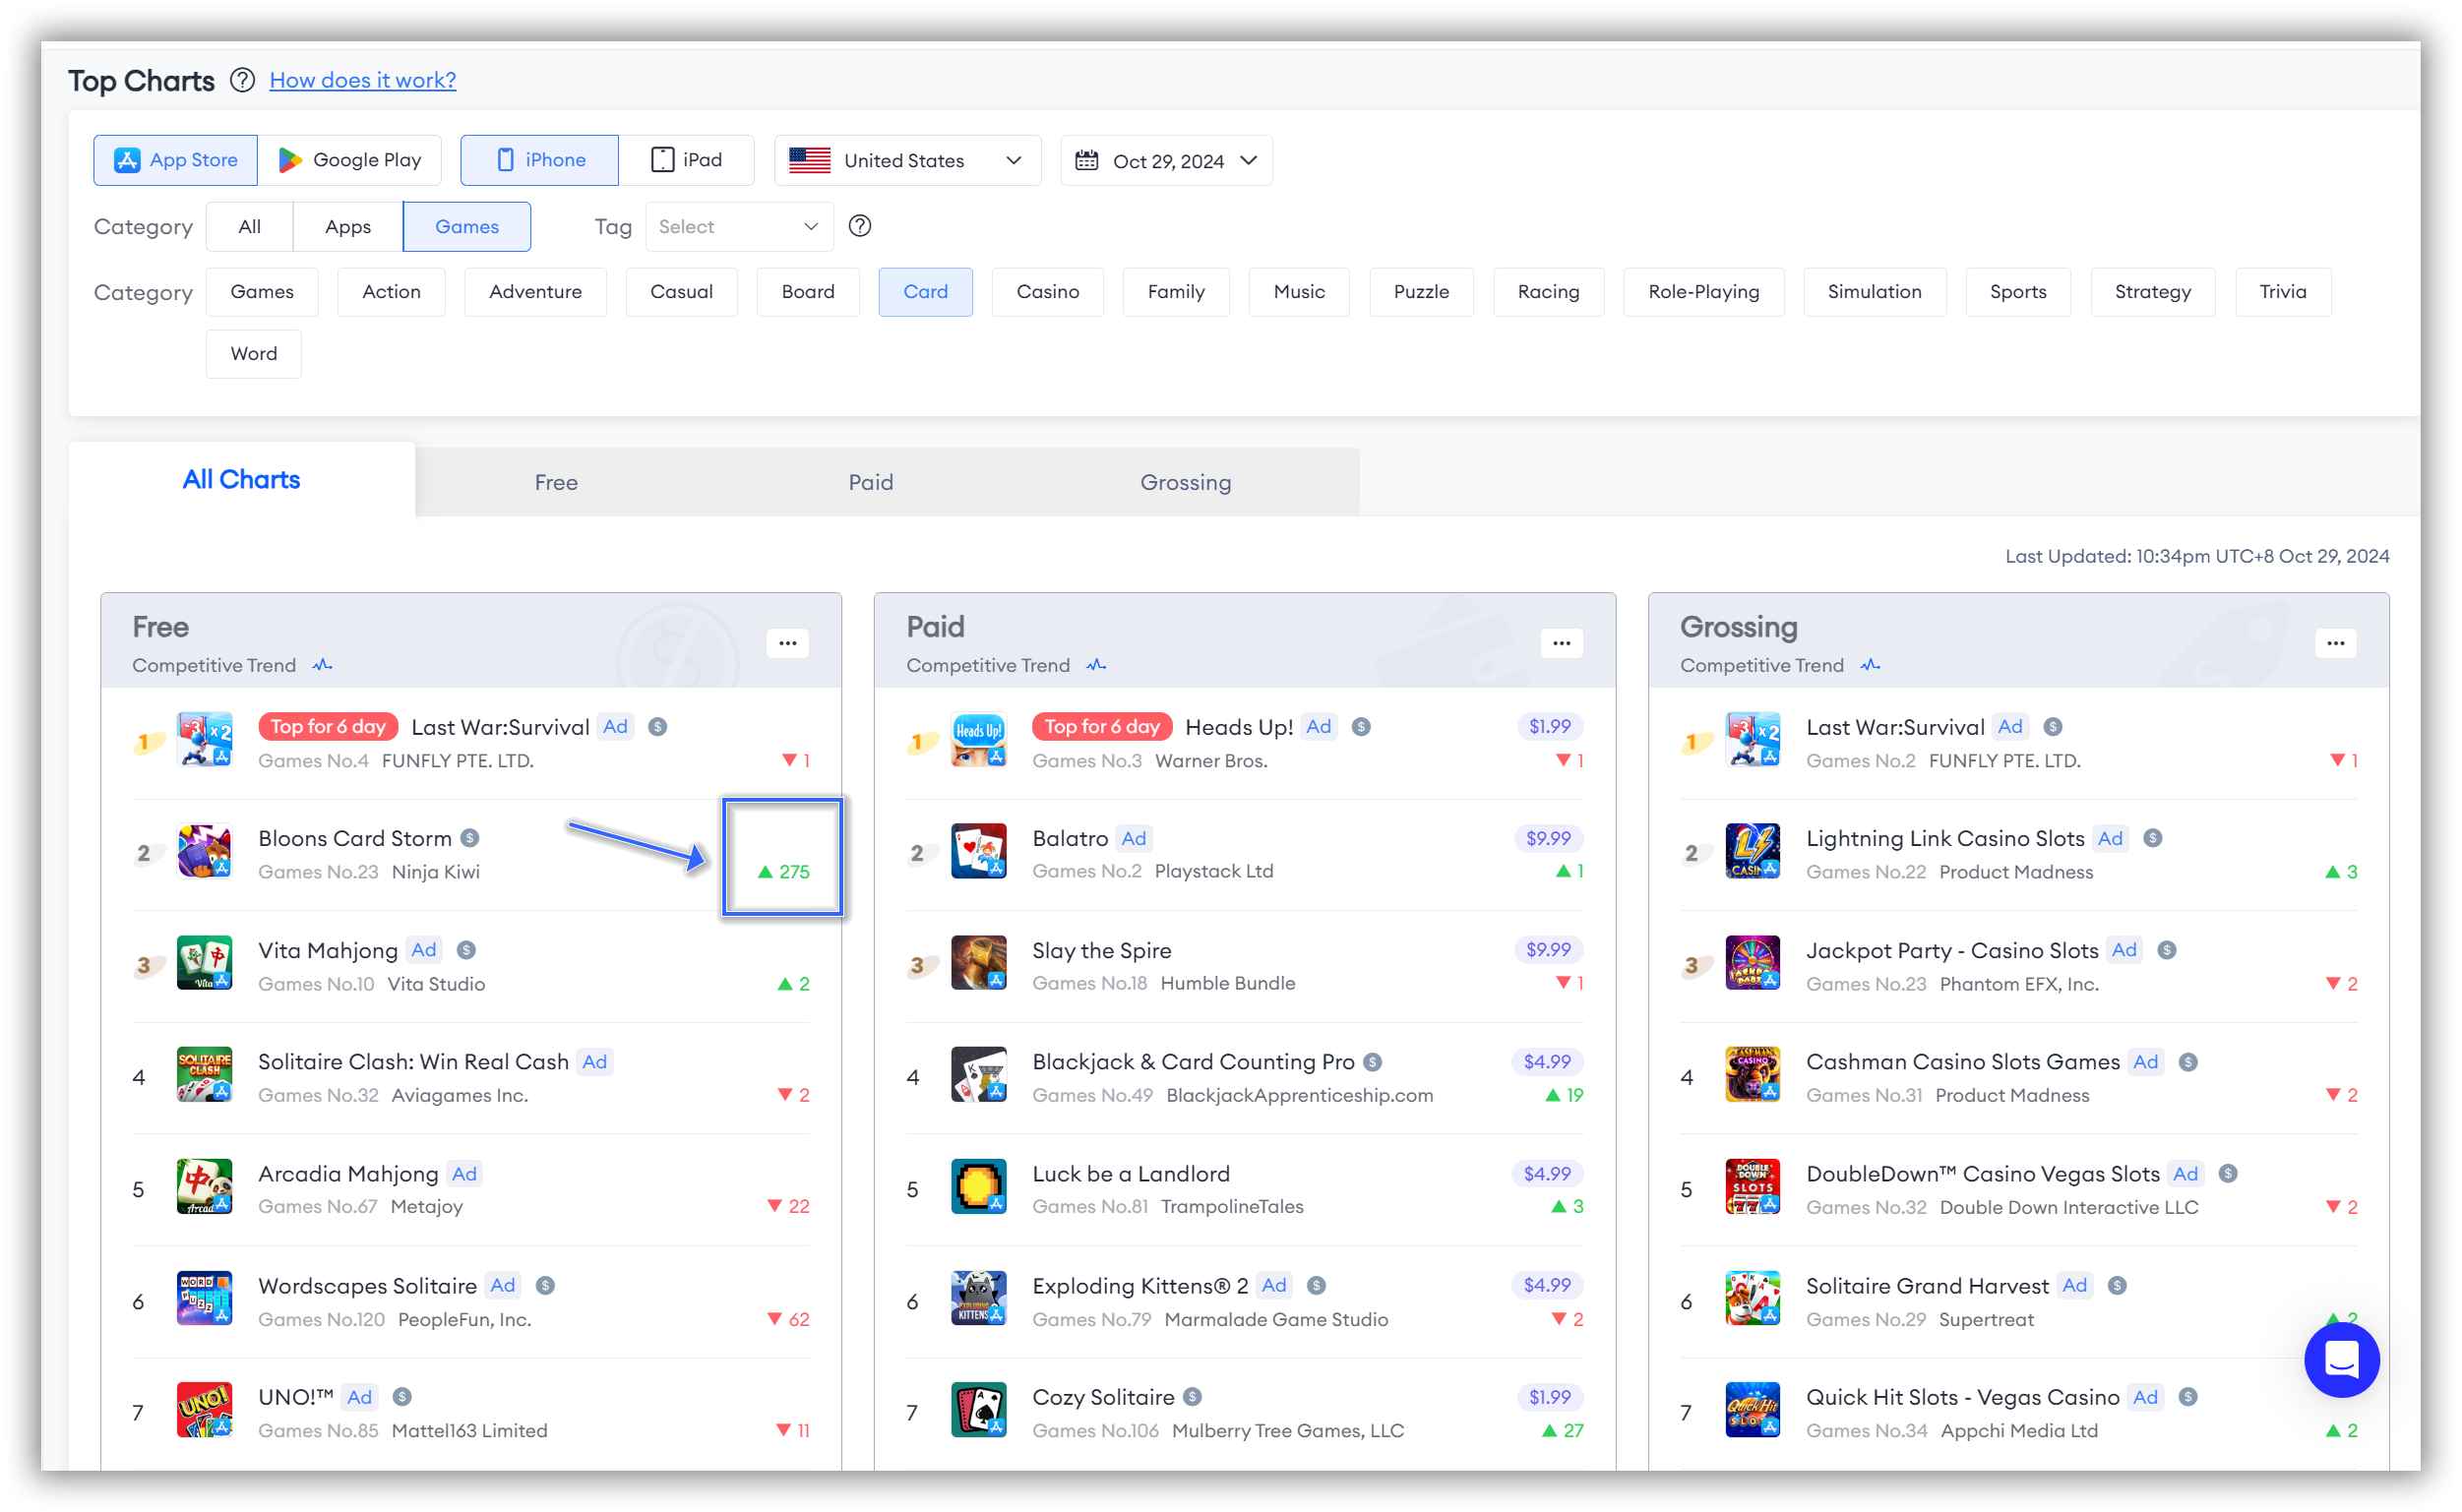
"Top Charts" can help you quickly identify the top competitors of your app to study them and achieve subsequent product optimization.
You can directly select the corresponding category of your app on "Top Charts" and conduct further research on the Top 10 popular competitor apps.
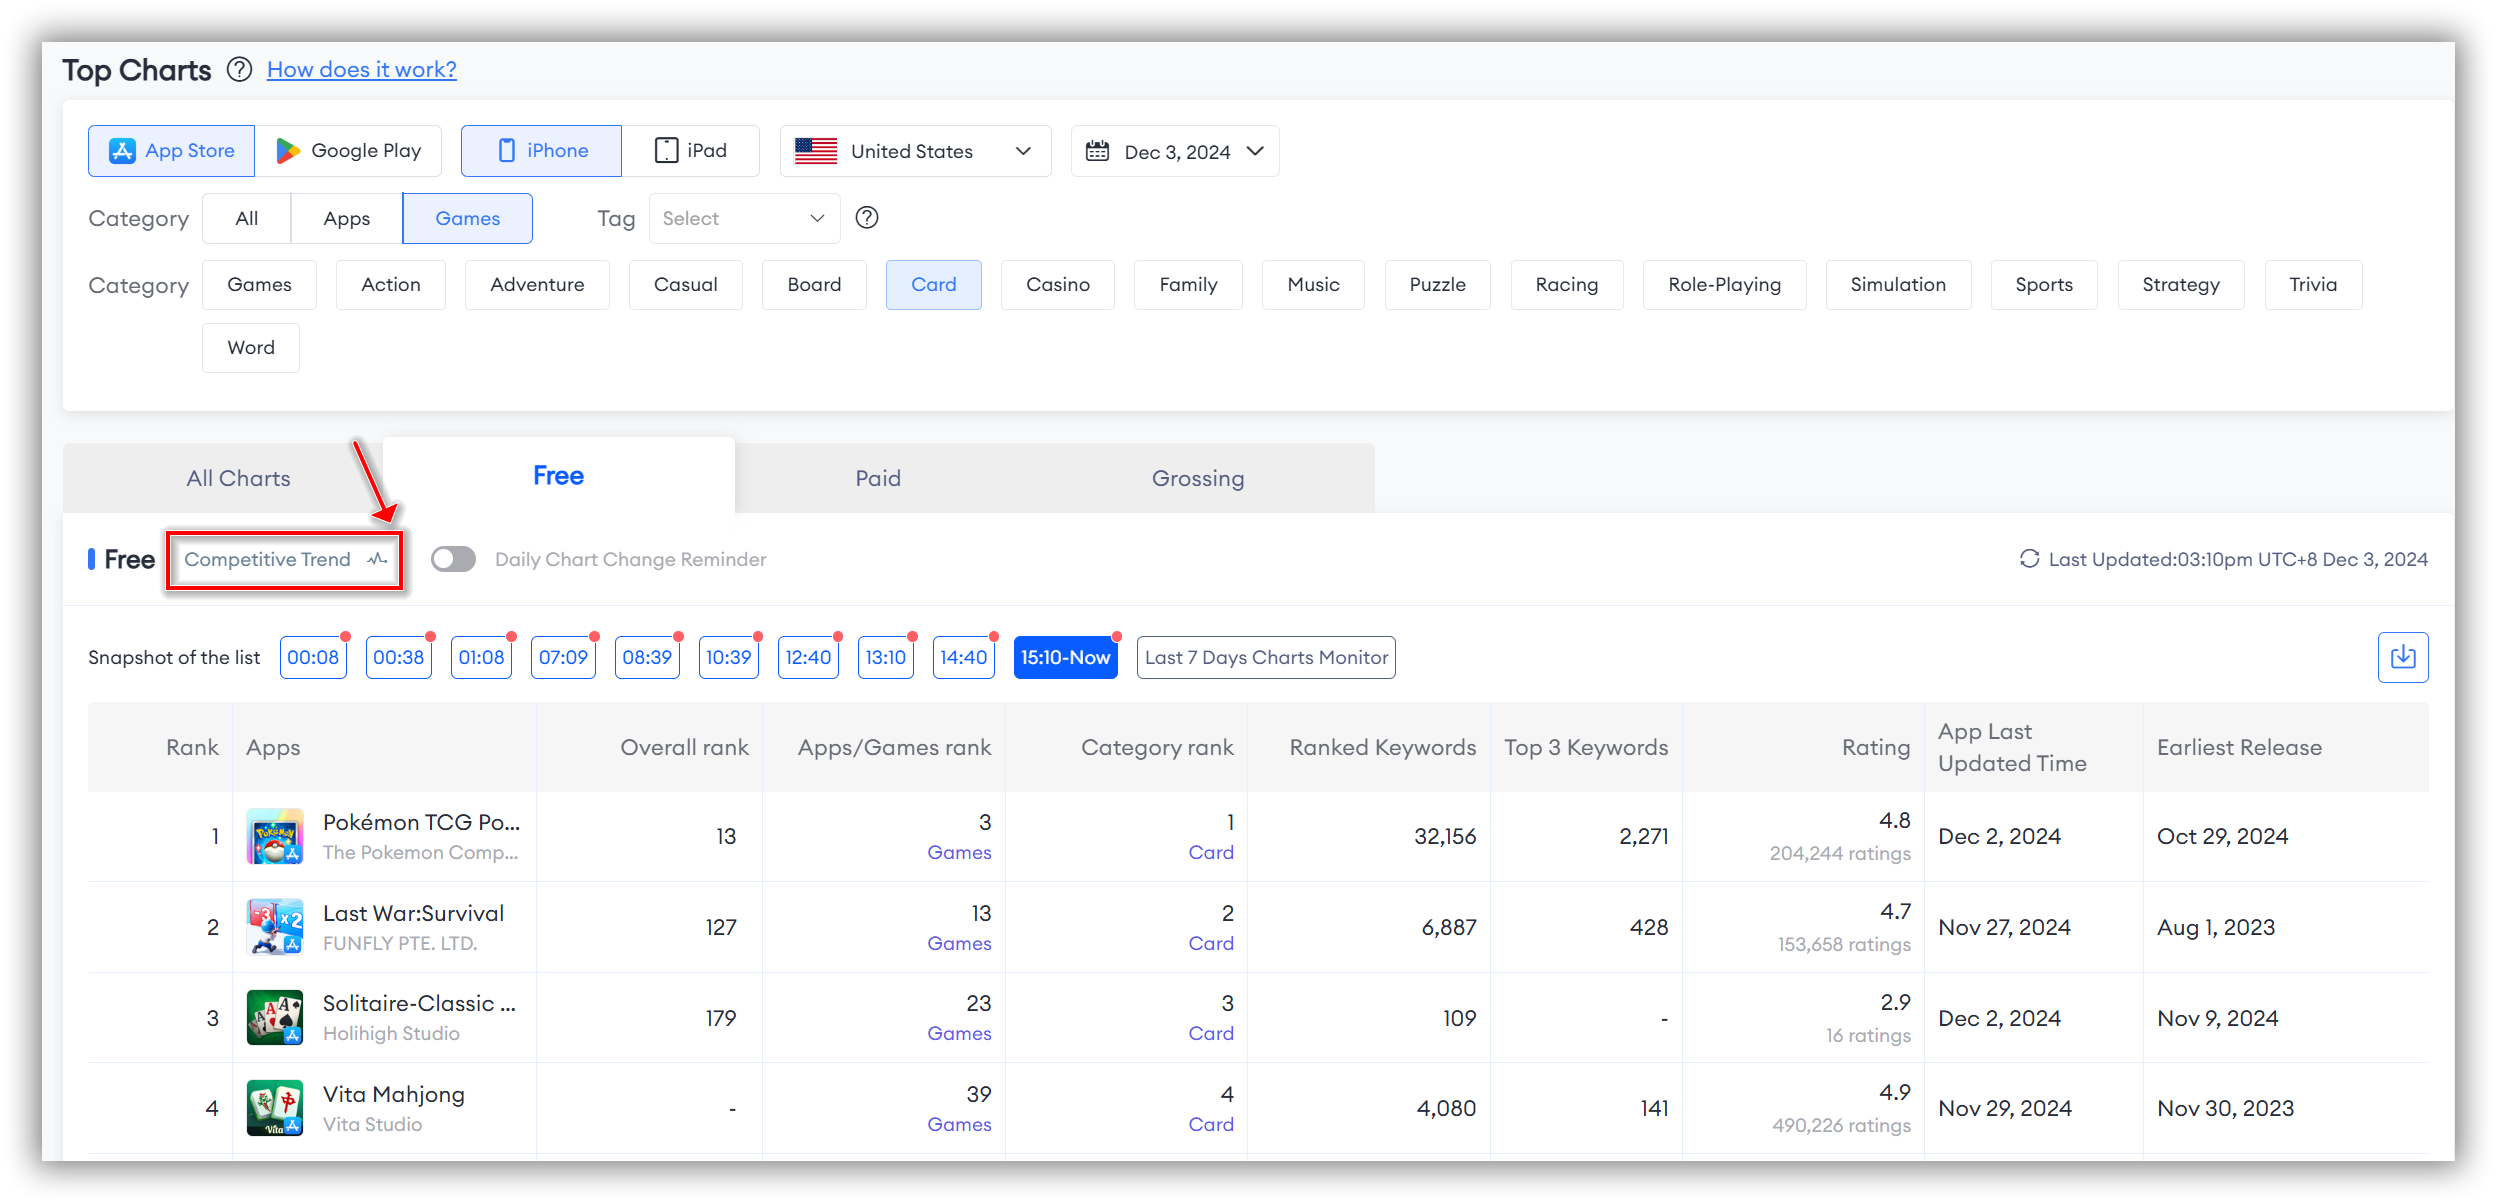
In addition, if you want to quickly identify top-ranking, rapidly rising apps or new apps for competitive research, you can click on "Competitive Trend" in the upper left corner and select a long-term dimension to study the Top 10 apps.
Feature or Events Innovation
After selecting samples from multiple top competitors, you can analyze the functional characteristics, user experience design, and real-time events of successful apps in the rankings.
This allows you to learn from these success factors to improve your own app.
How can you do this?
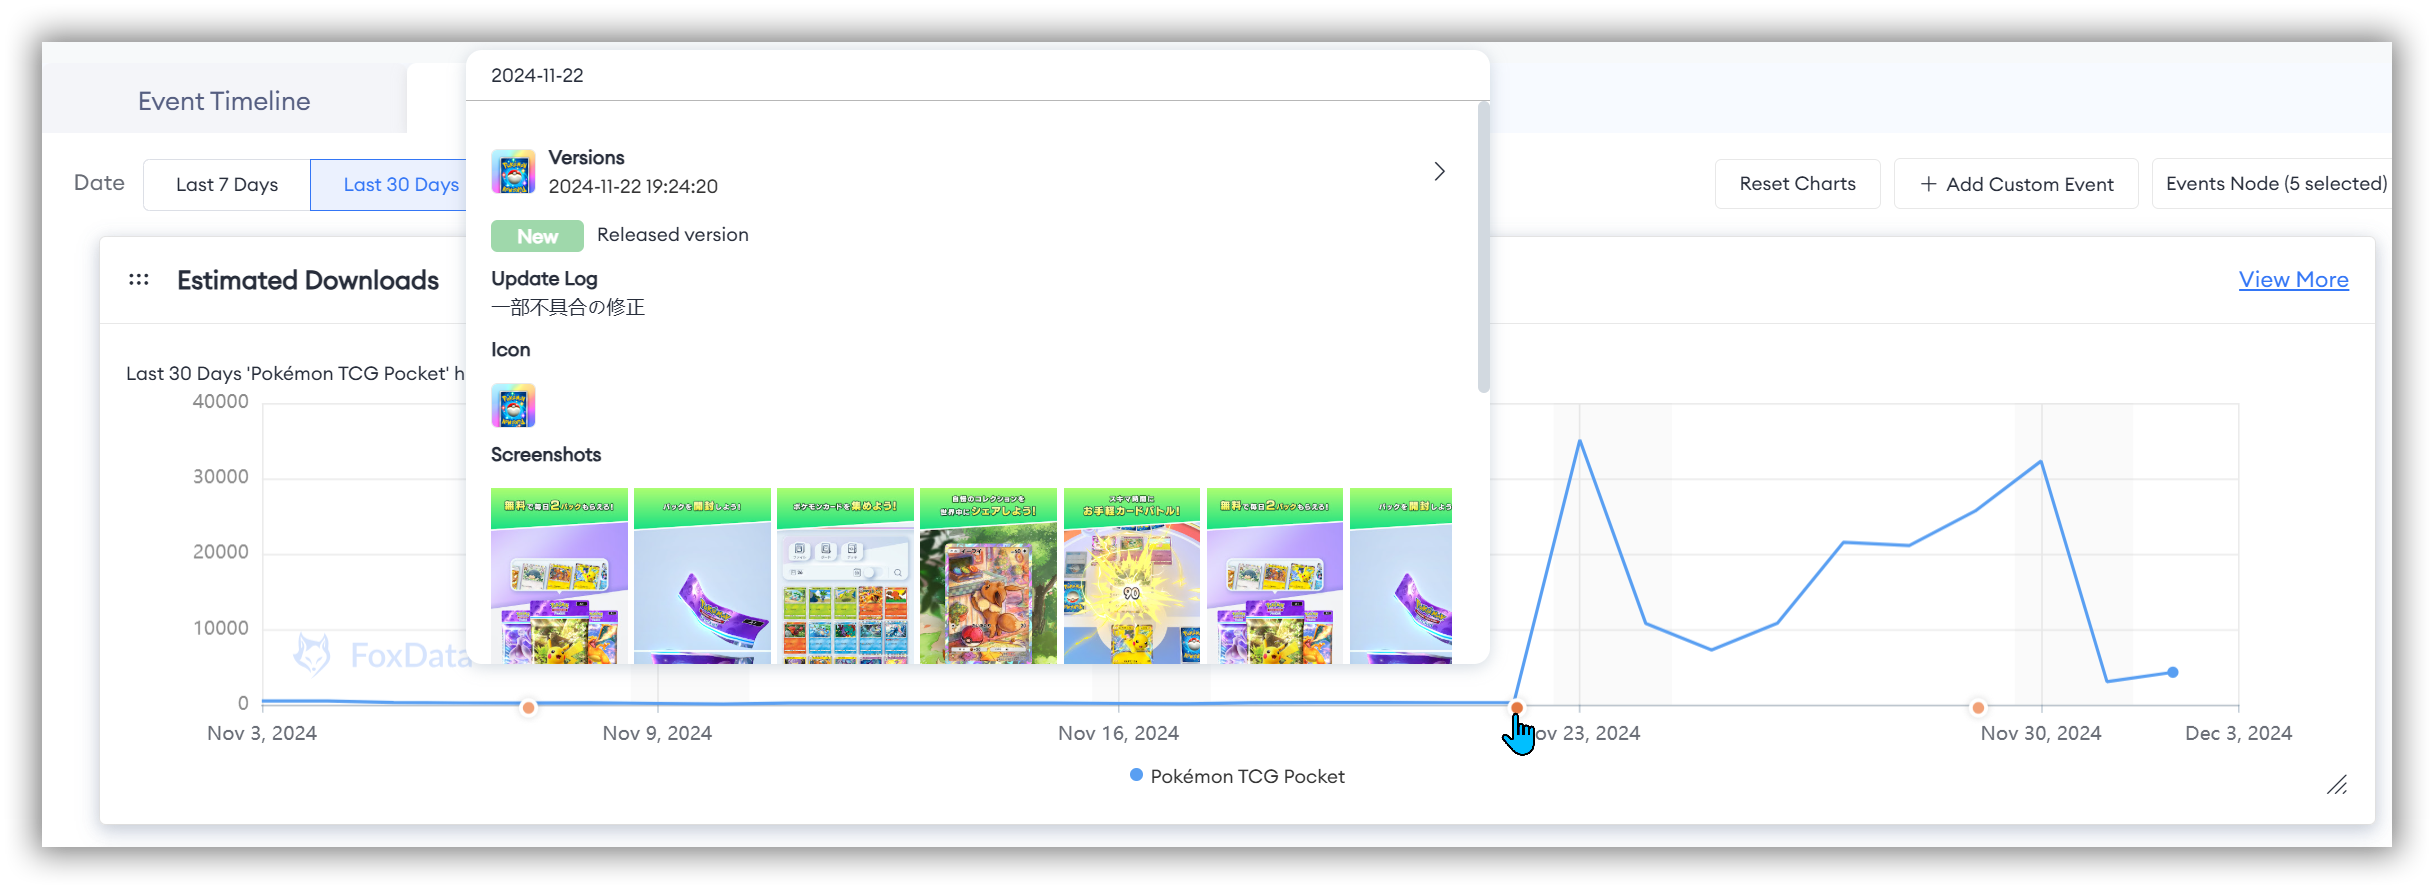
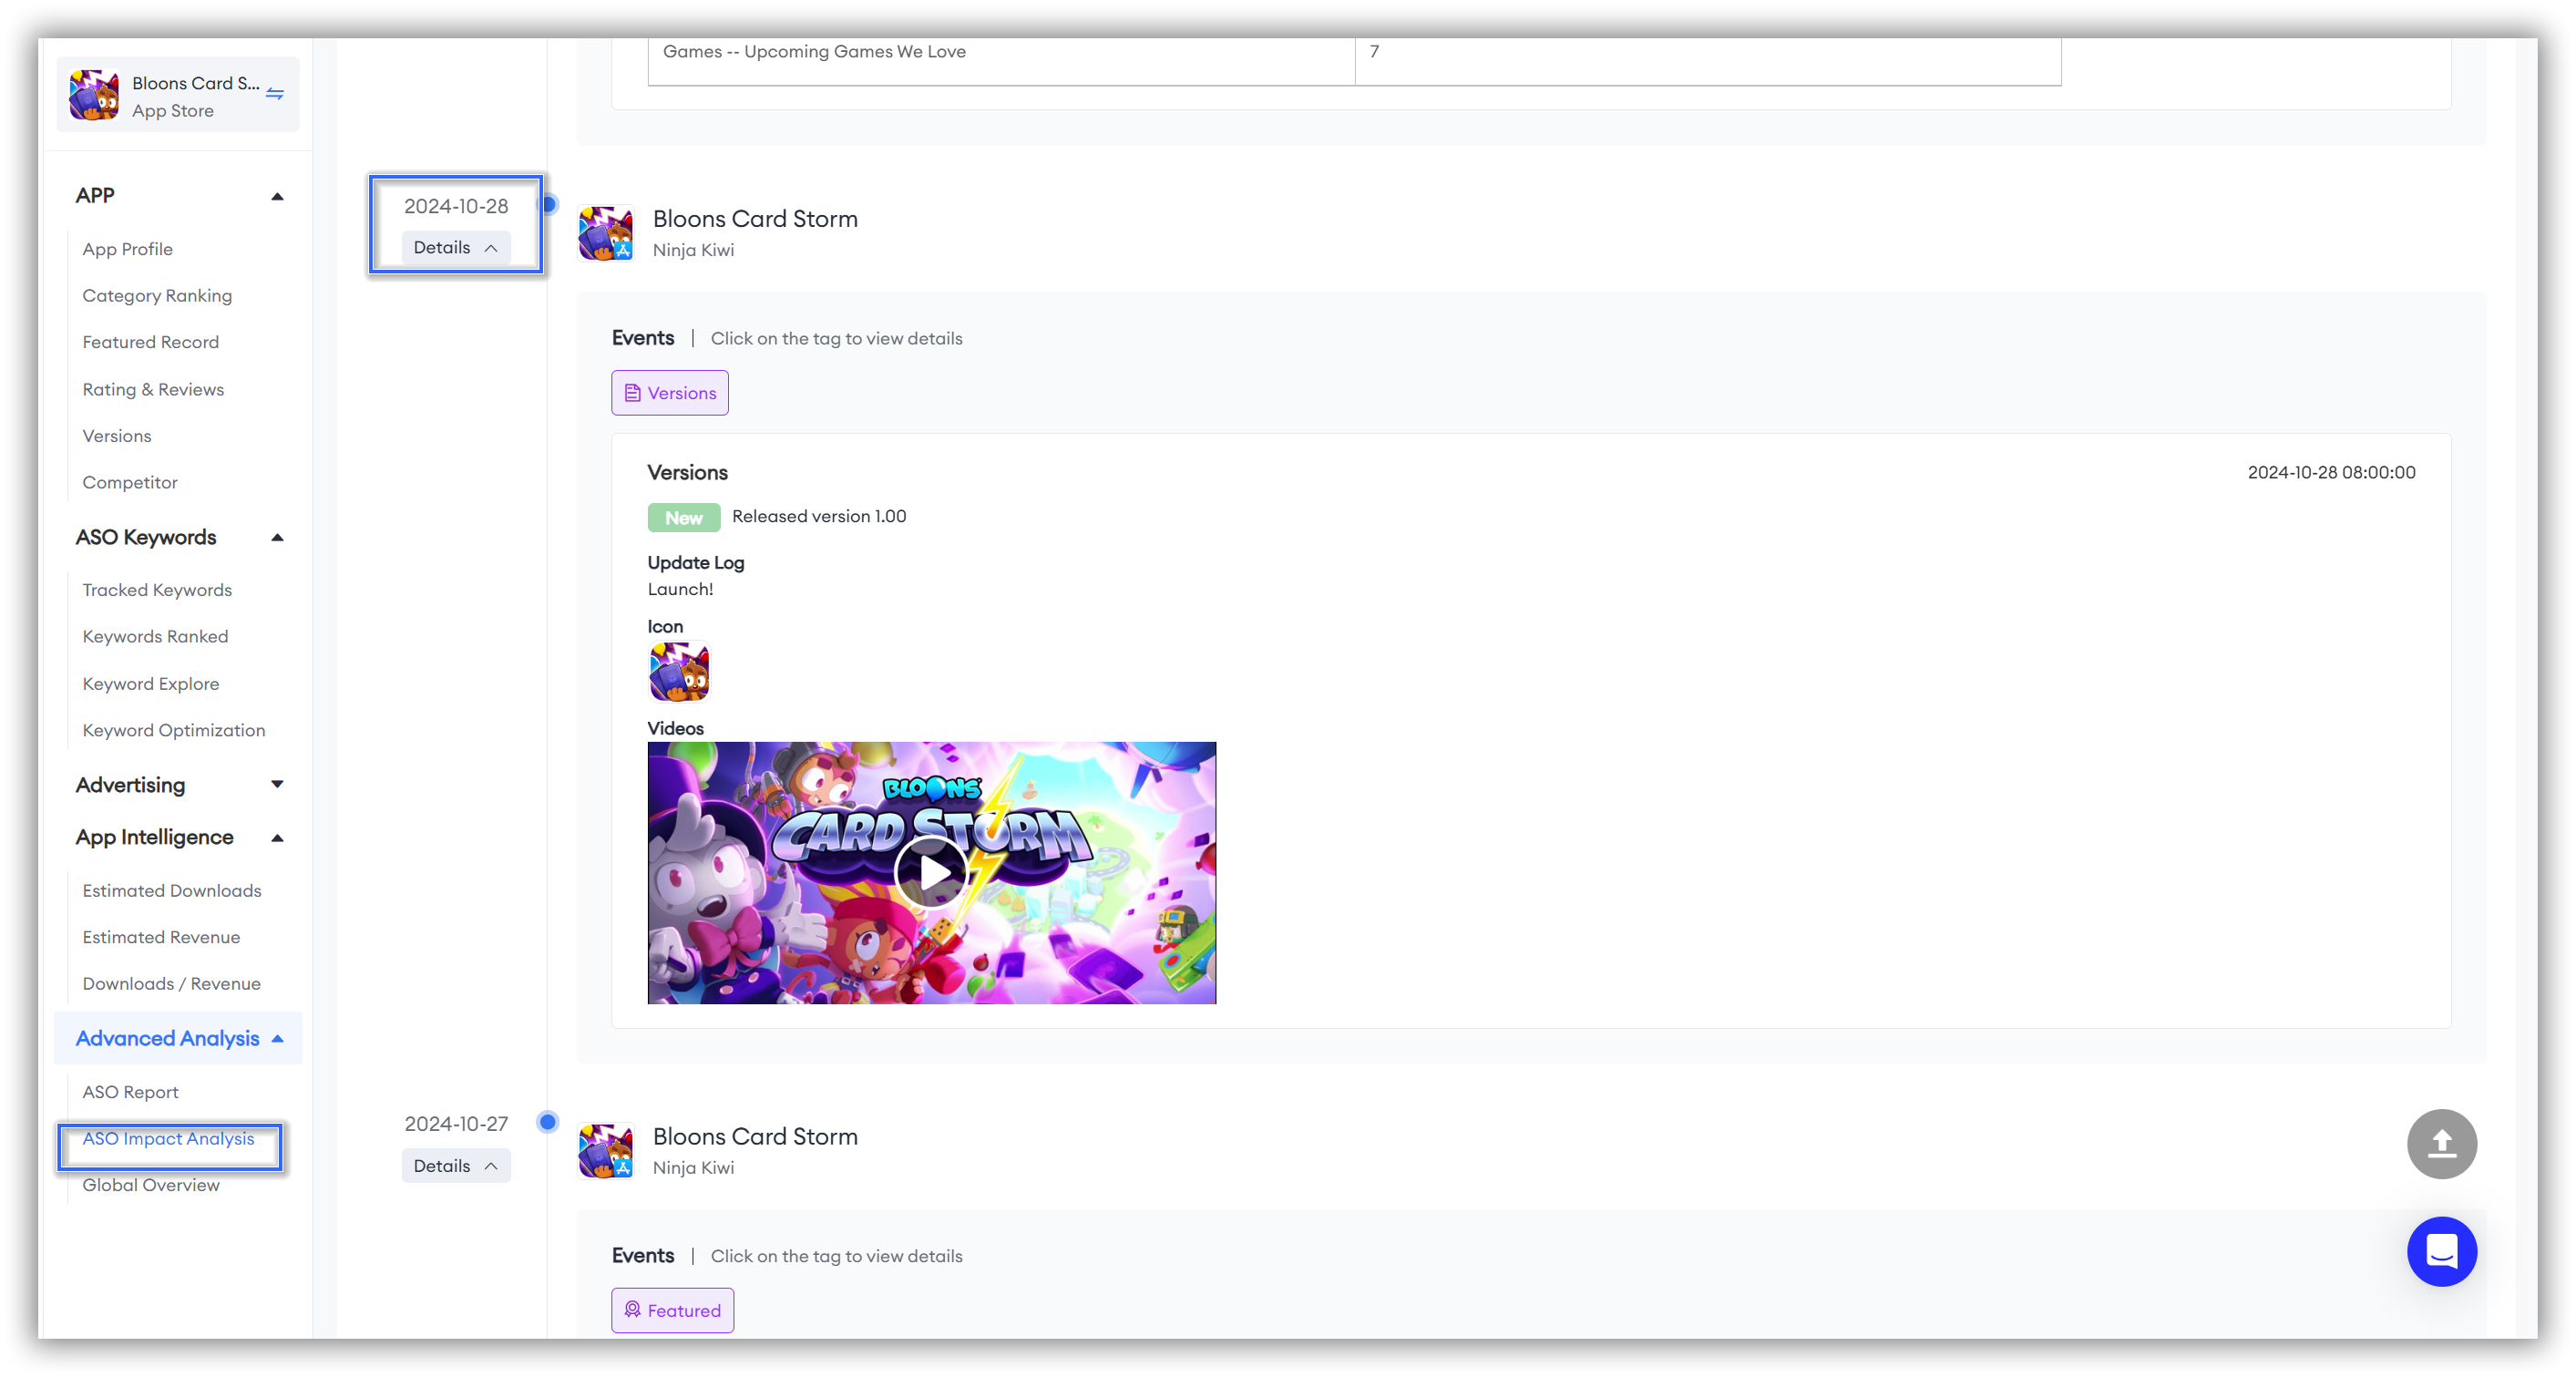
You can use FoxData's "
ASO Impact Analysis-Impact" feature to quickly identify the time points where there are significant changes in an app's download or revenue figures.
Then, you can directly click the orange button at that time point to view the updates and events the app implemented at that point.
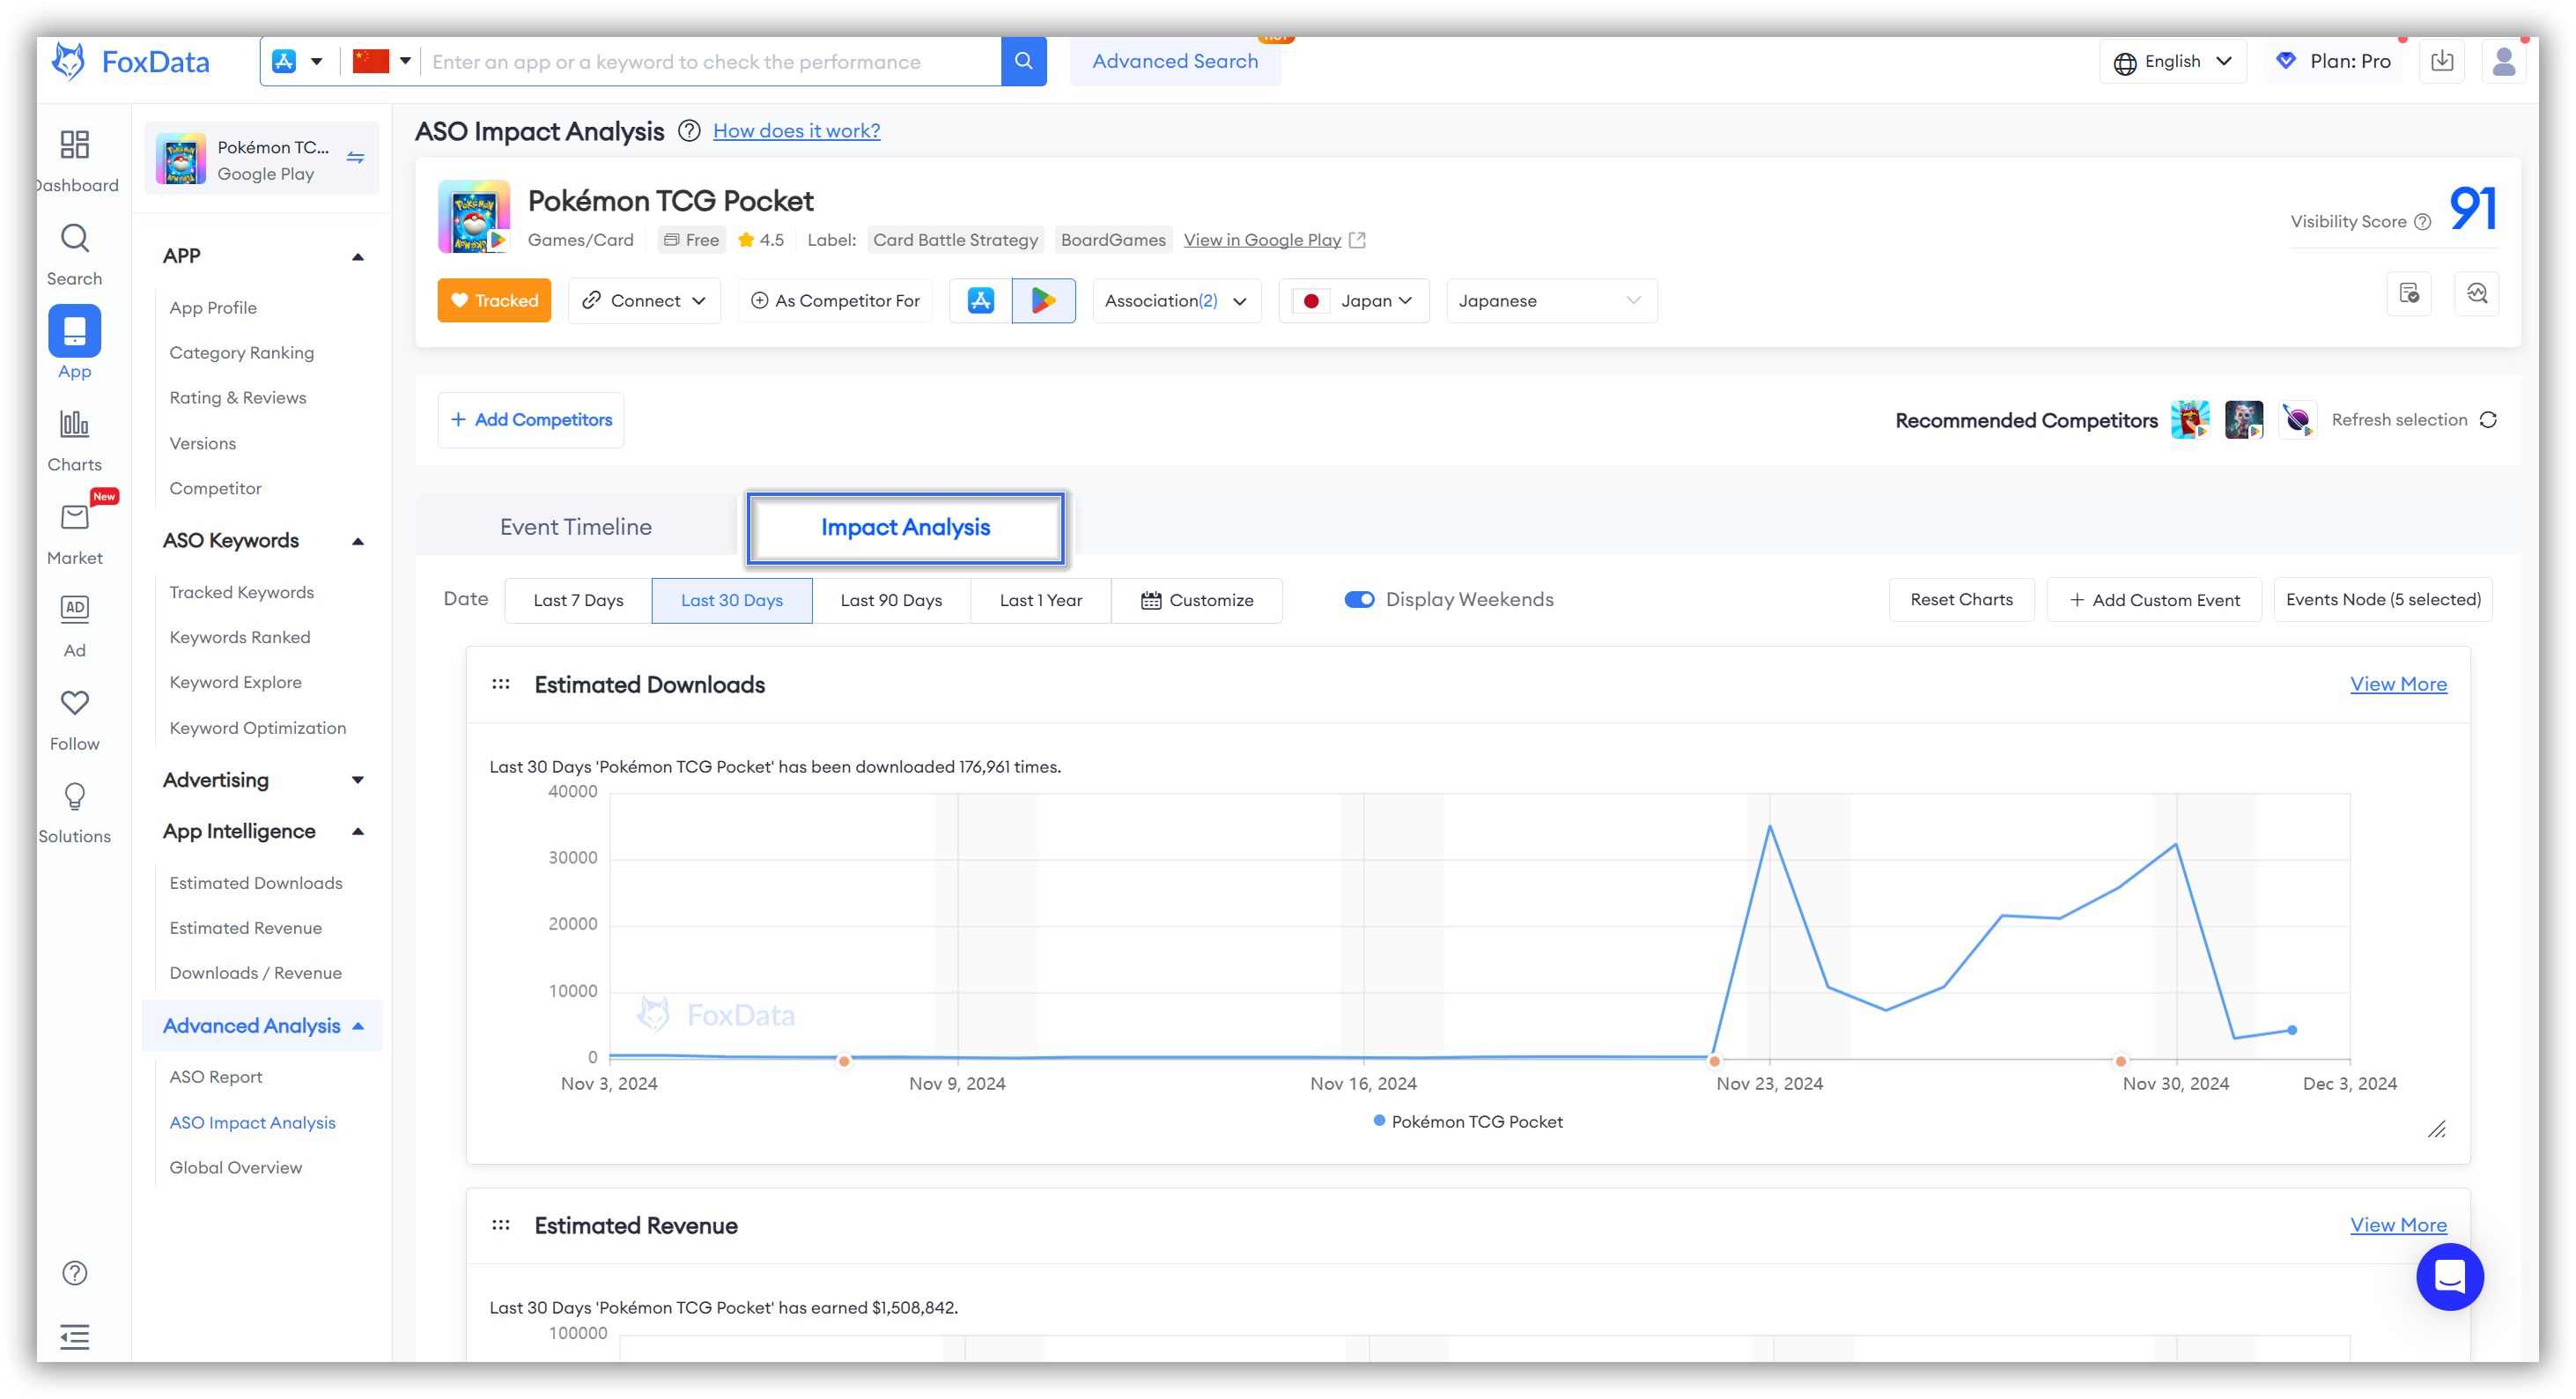
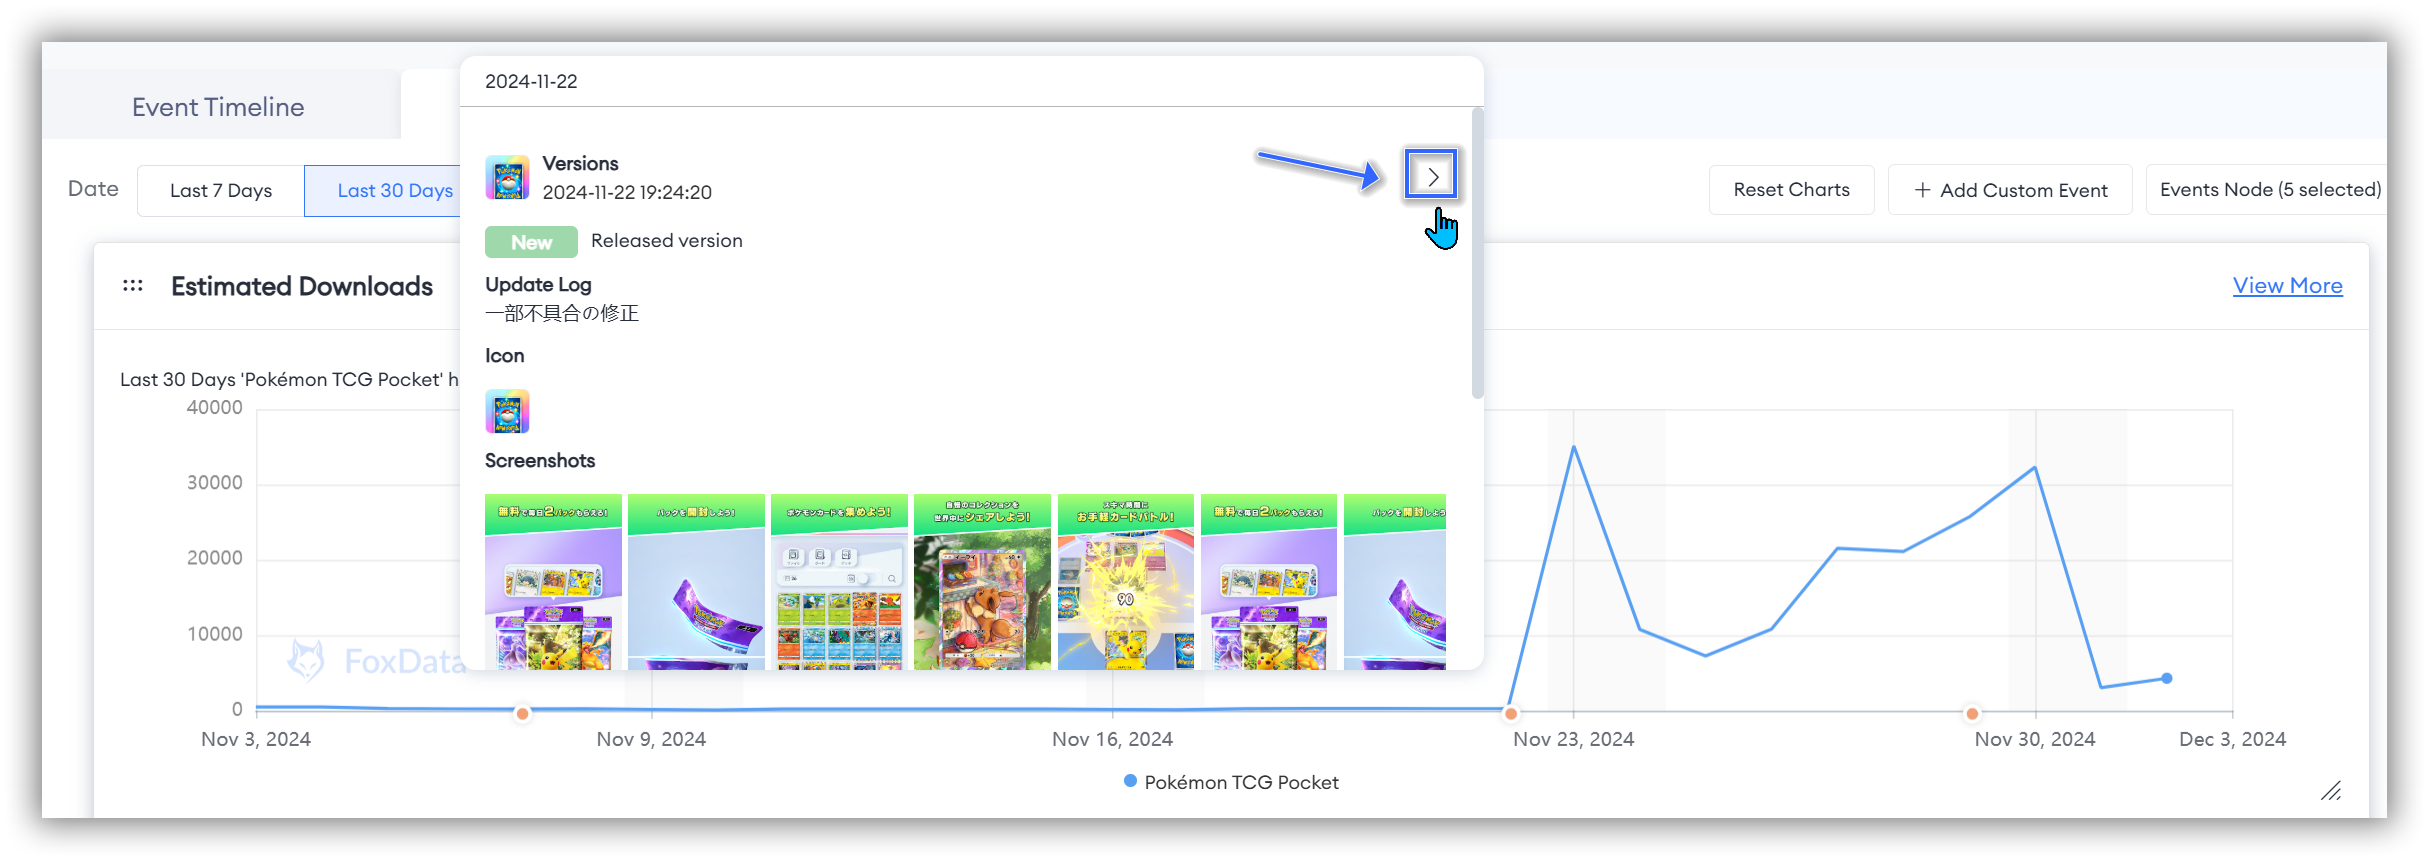
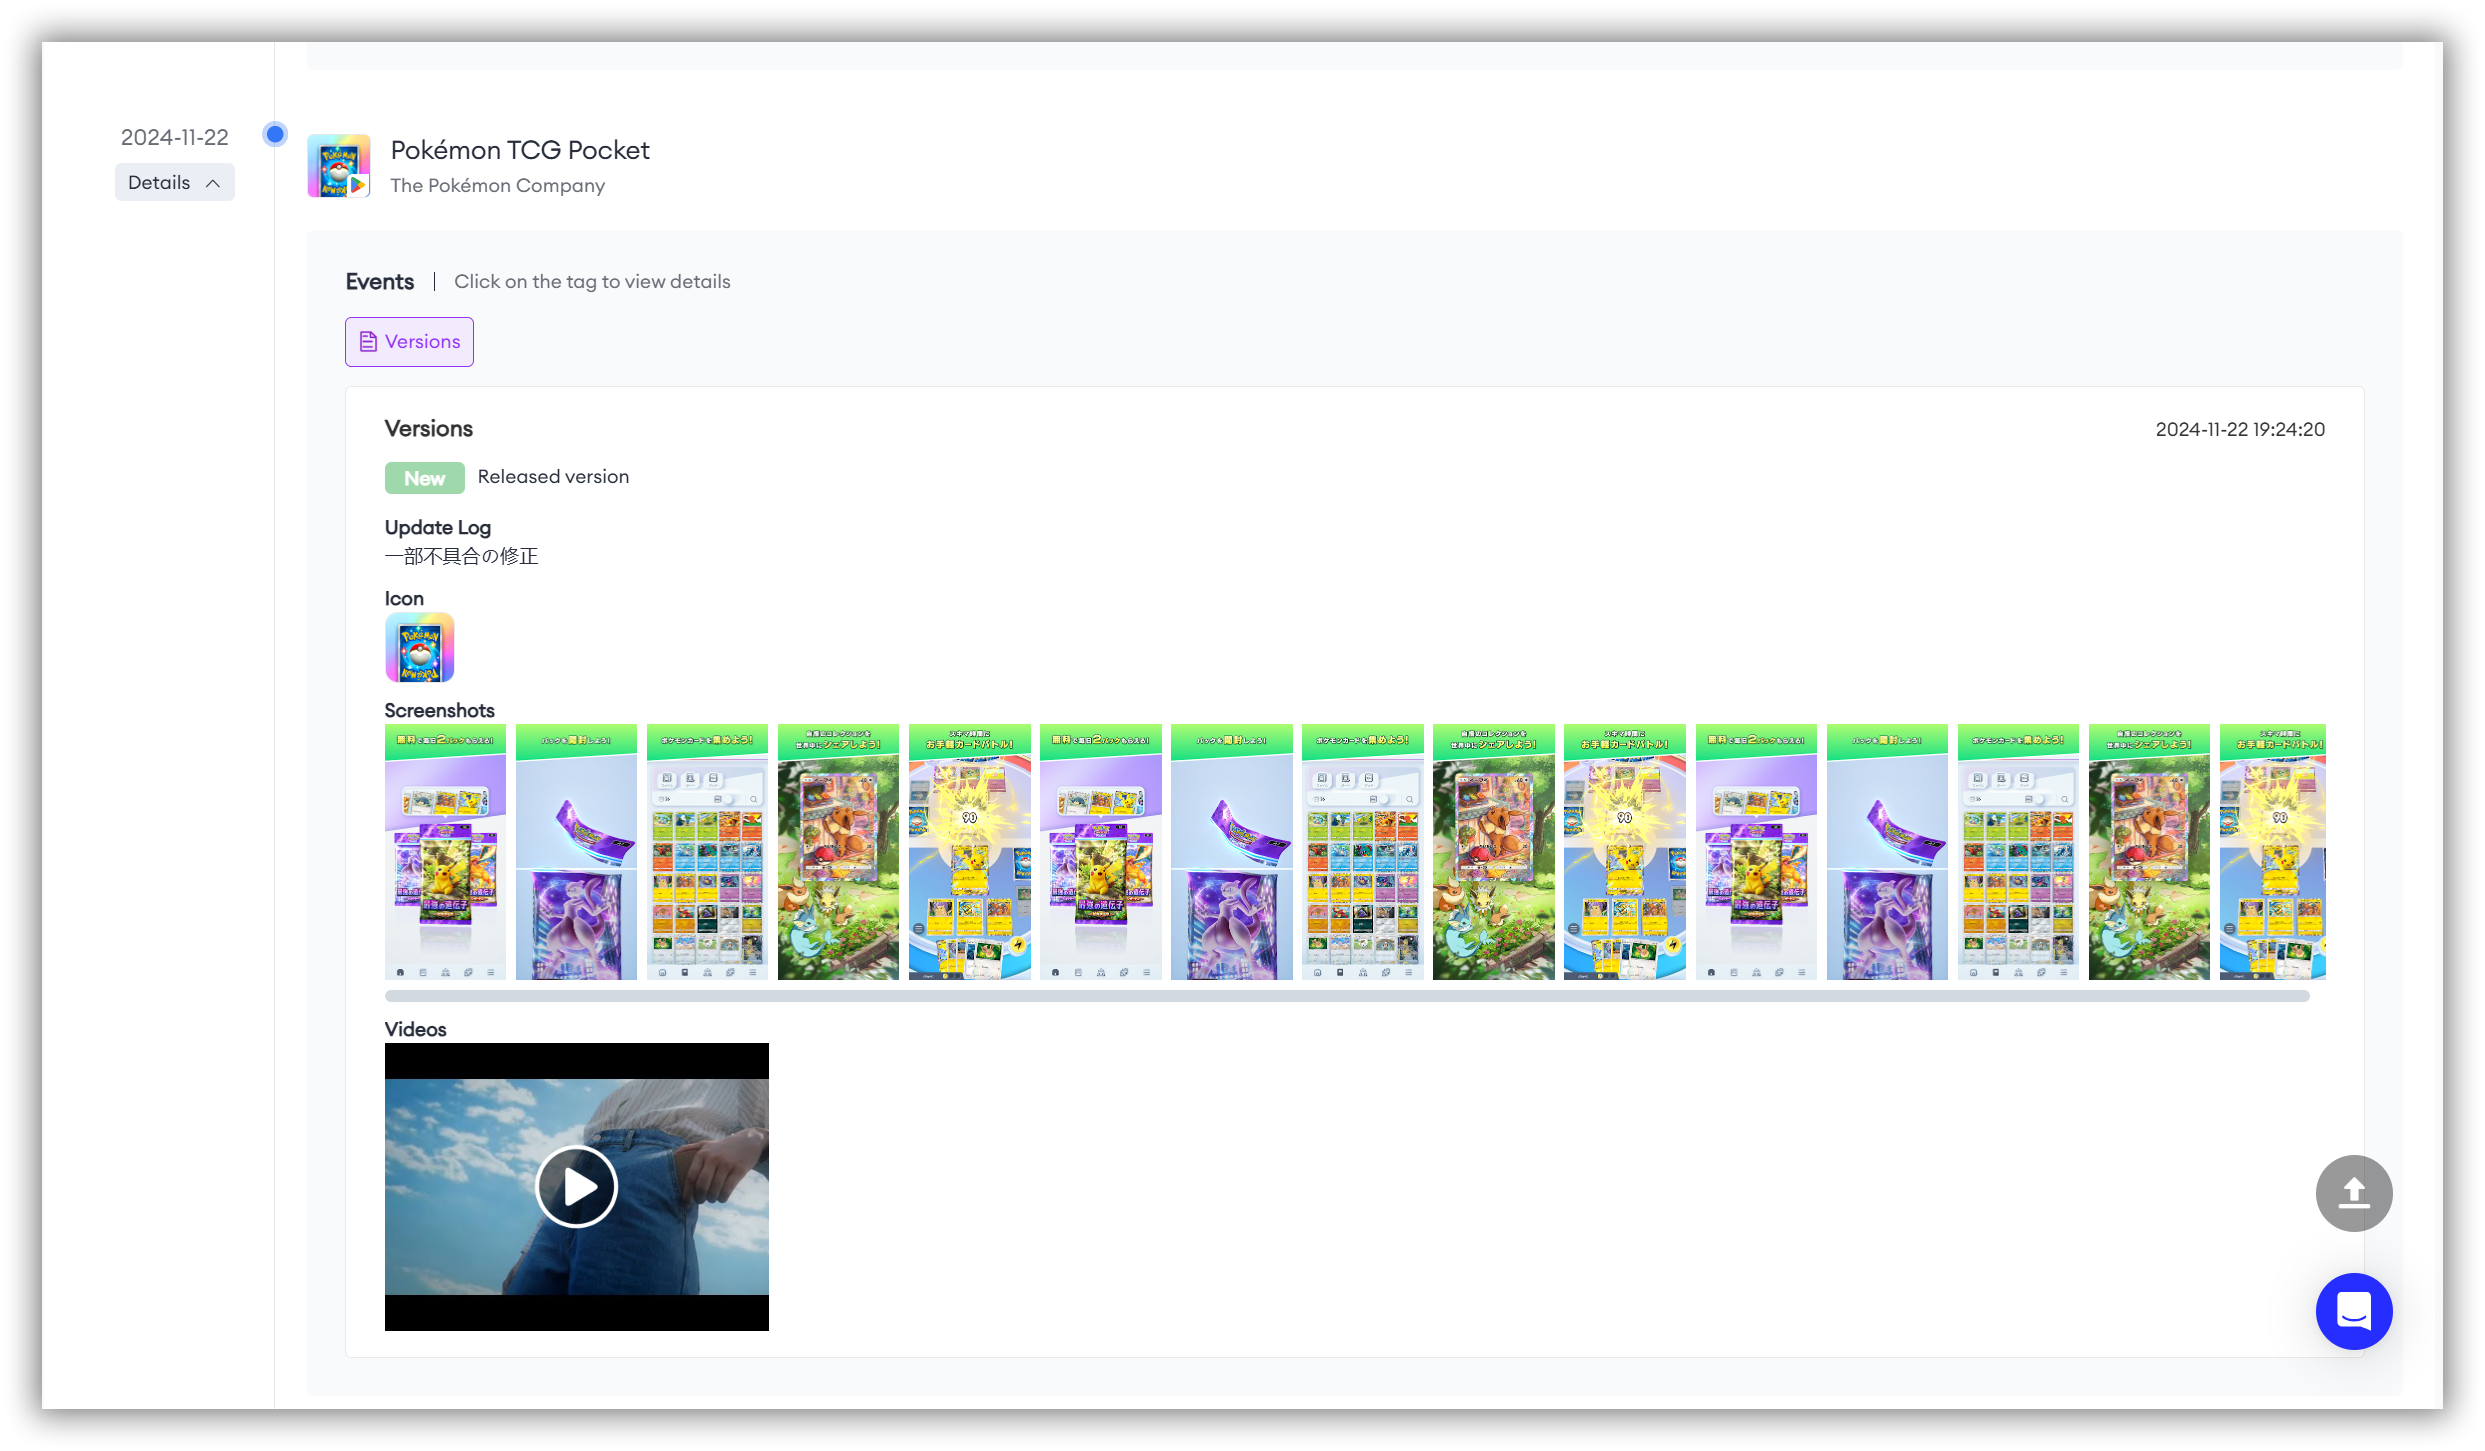
If you want to learn more about the efforts made by the app at that specific time point, simply click the arrow on the page that pops up at that time point.
This will take you to the "Event Timeline" for that time point, where you can view details for further research and learning.
User Feedback
Popular apps often receive a large volume of user reviews and feedback, which developers can use to gather valuable insights for optimizing their products.
After identifying your research sample in the "Top Charts," you can also monitor user reviews of competitor apps to understand what users like and dislike. This information can help you improve your own product.
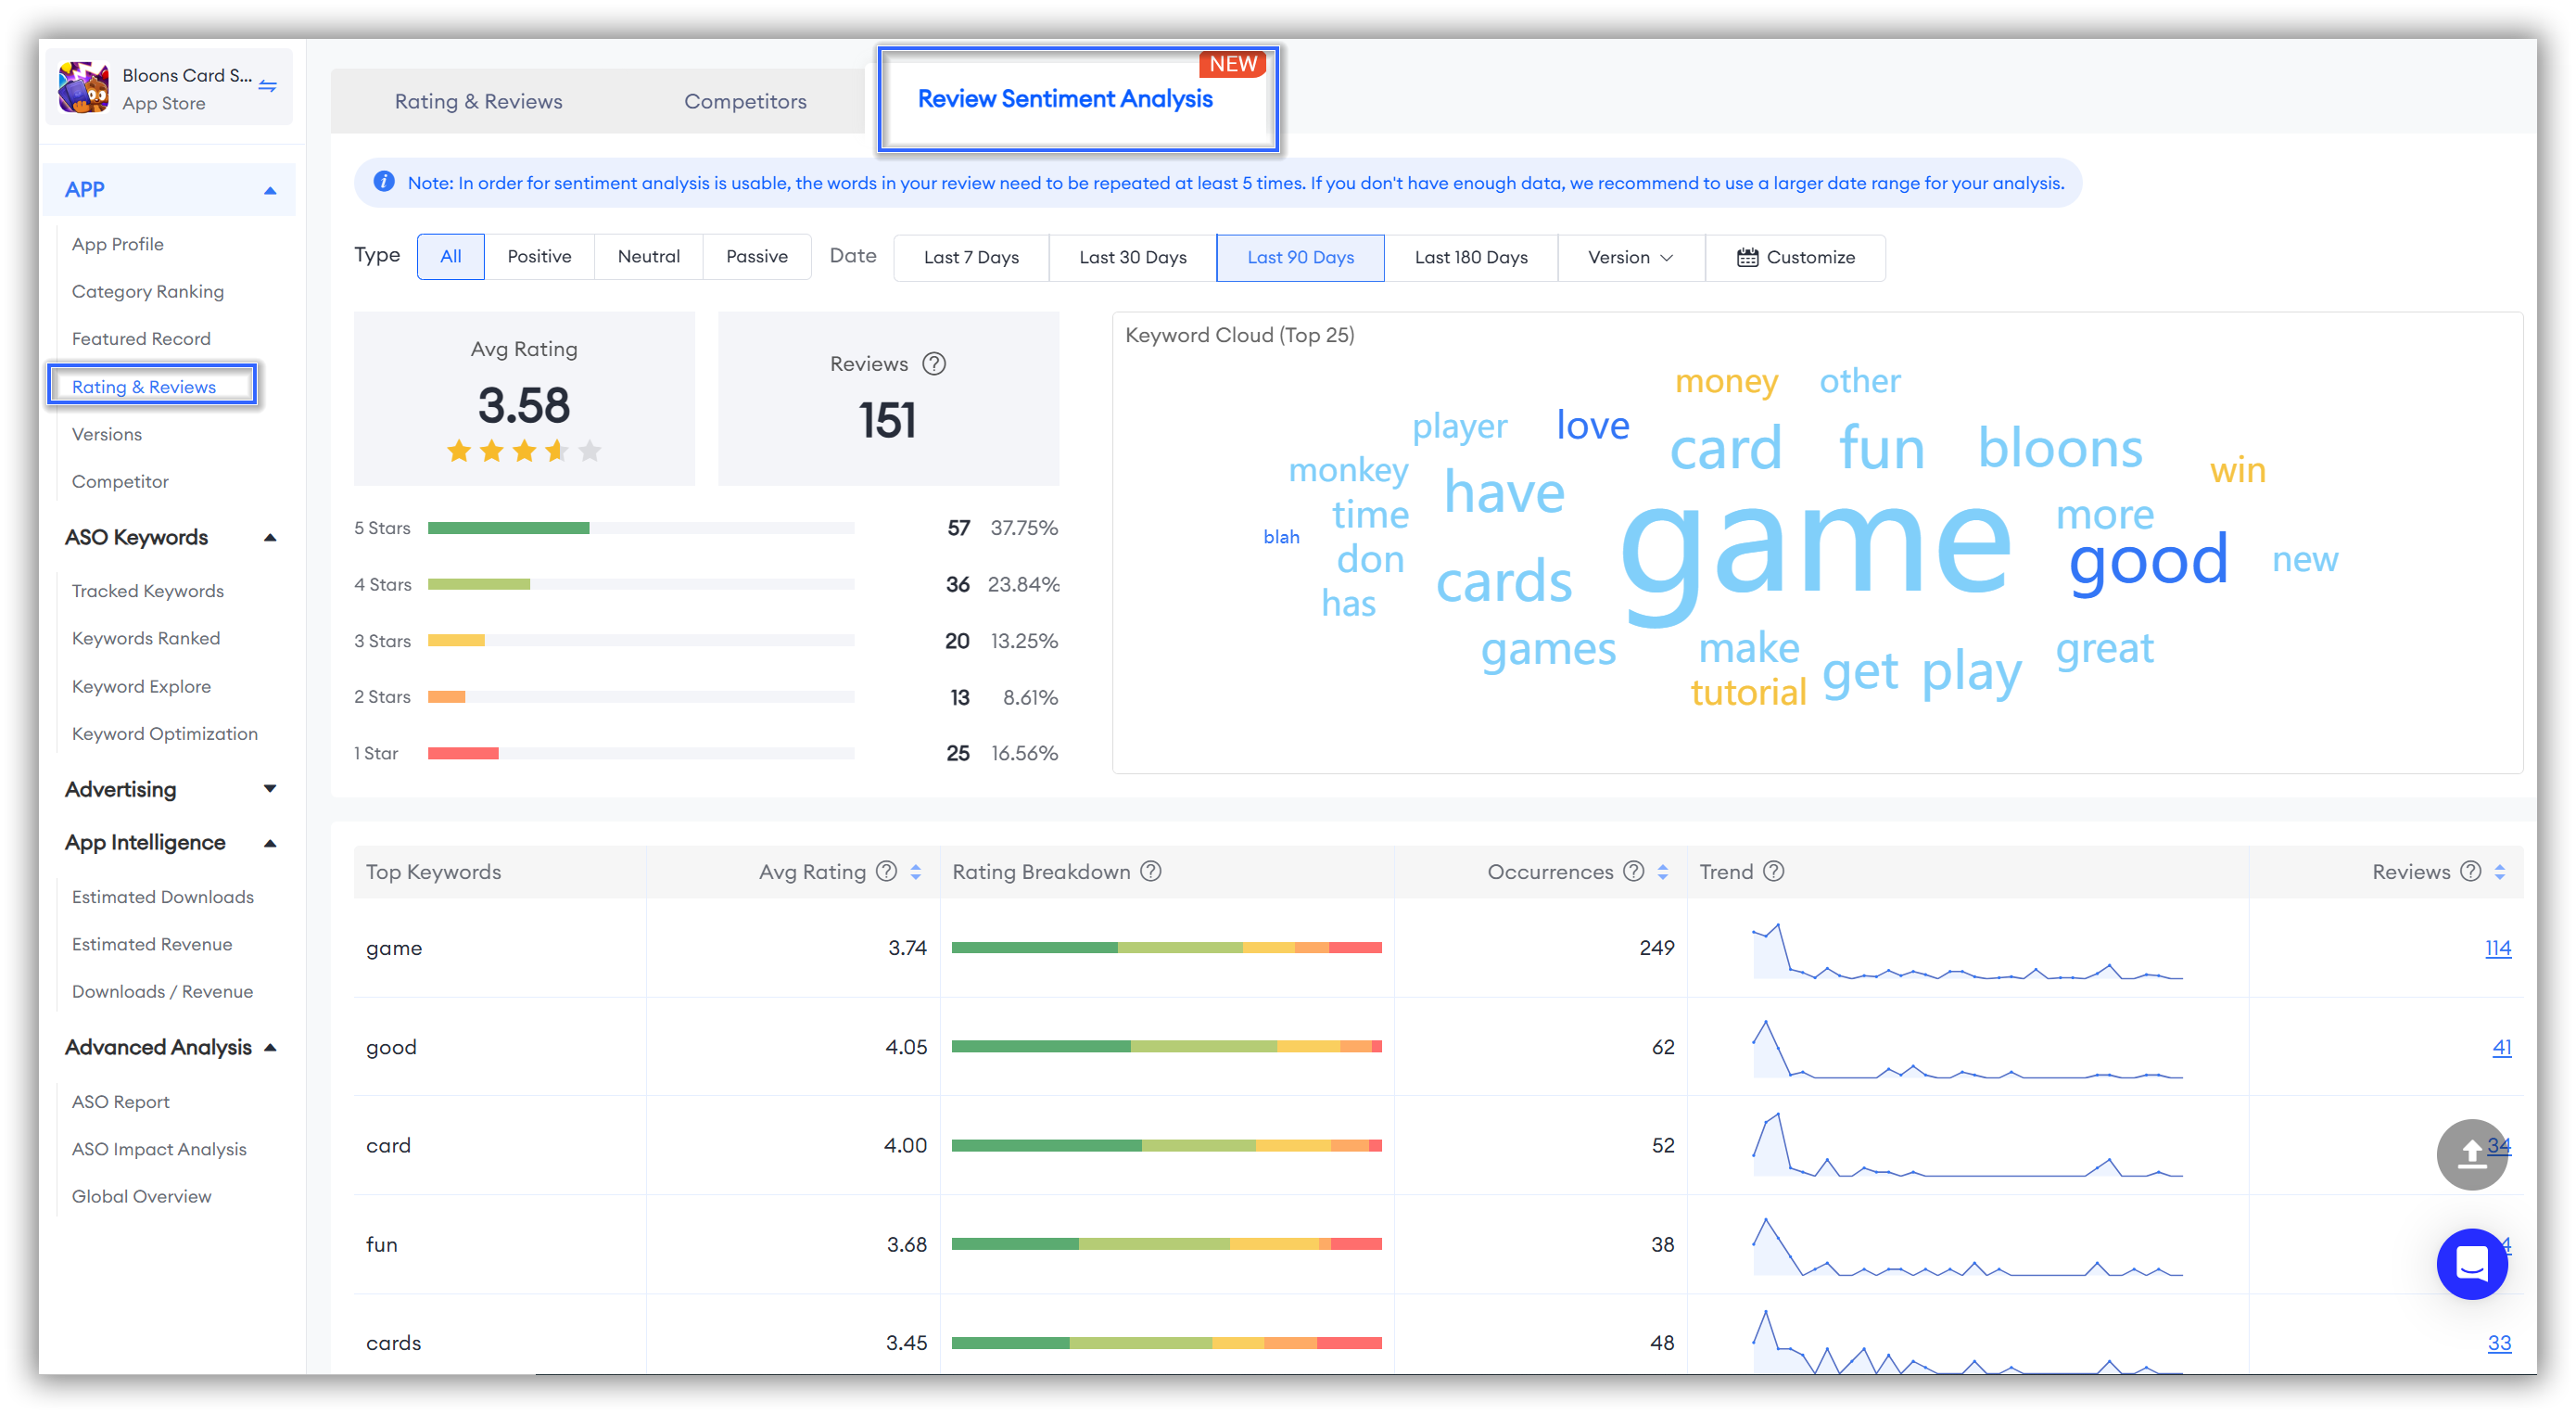
👏 Expert Tips: Our experts recommend using FoxData-Ratings&Reviews to quickly understand user satisfaction and pain points.
The "Review Sentiment Analysis" feature in this module can help you quickly identify the positive and negative sentiments of competitor users, allowing you to pinpoint valuable review information efficiently.
💡 Read More: What's Going on Inside Your Users' Minds? Review Sentiment Analysis Helps You Find Out.👉How to utilize it: How to Craft a Targeted Marketing Strategy With the "Review & Ratings" Feature
Pricing Adjustment
If your app is a paid app, observing the relationship between competitors' pricing strategies and their rankings can help you adjust your own pricing strategy to enhance market competitiveness.
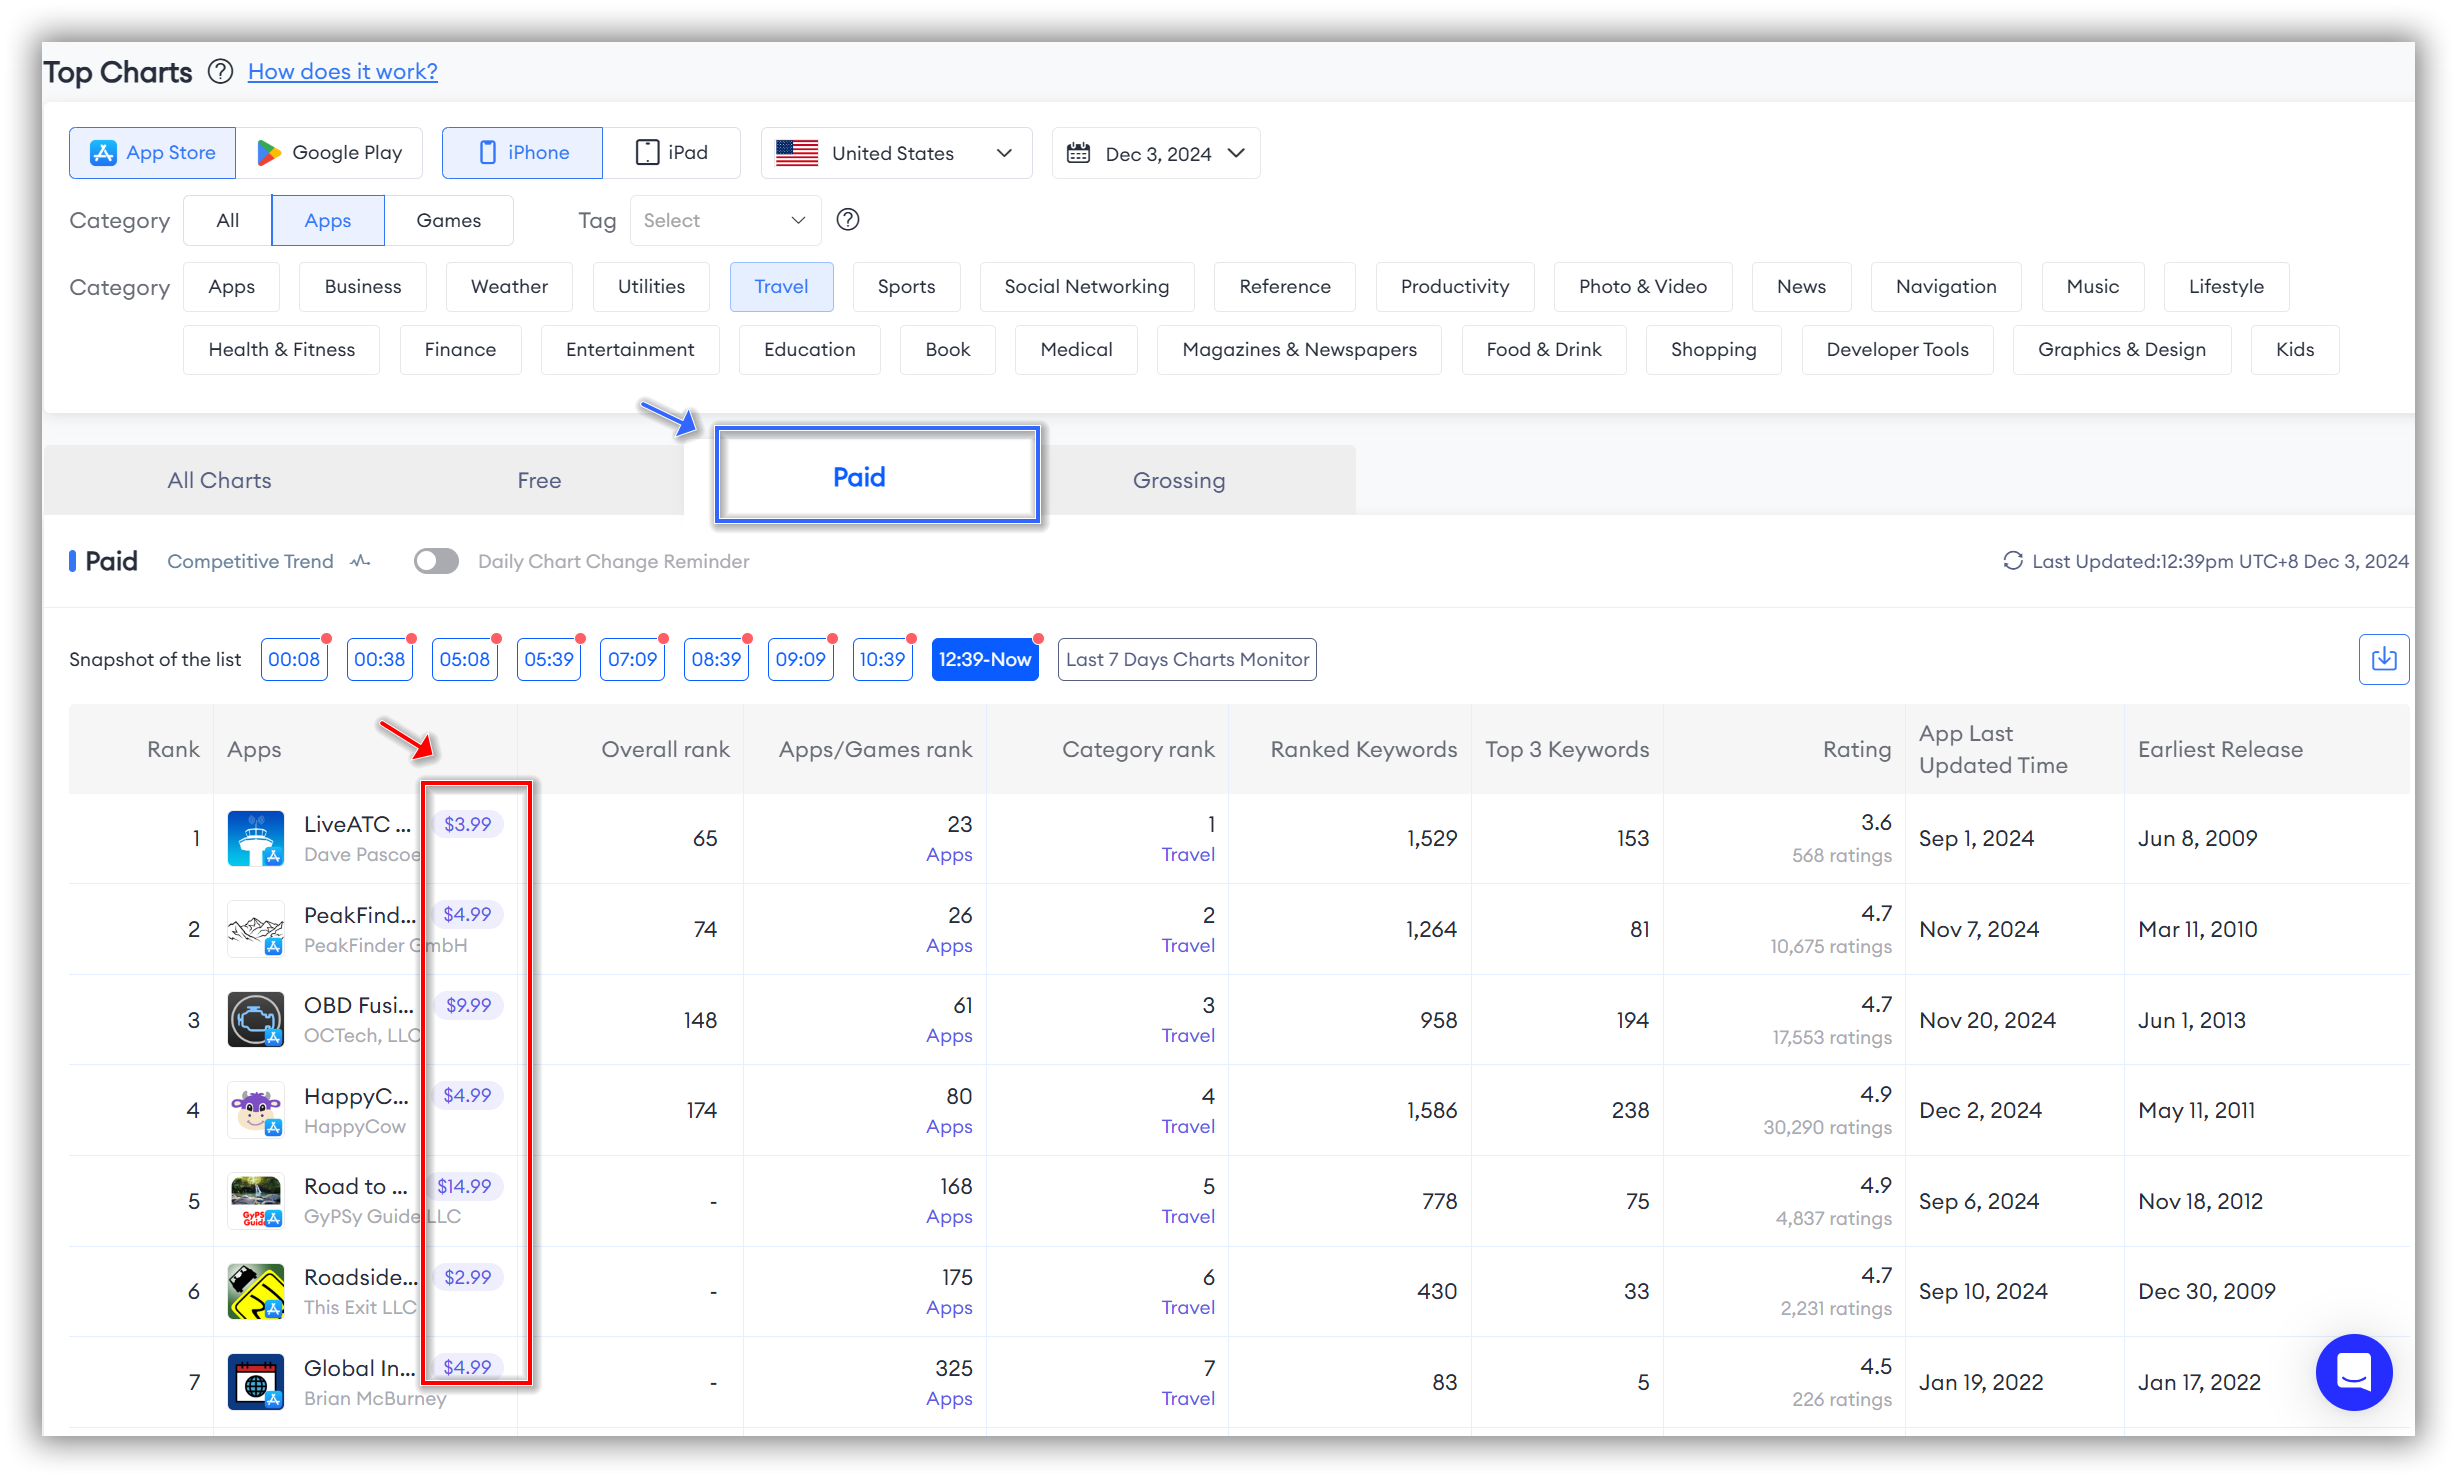
You can study the price ranges of top paid apps in the charts to understand the price range users are willing to pay in different categories.
Ensure that your app's pricing is within a reasonable range to attract your target users.
Additionally, observe the performance of high-priced and low-priced apps, analyze their market positioning and user demographics, and consider whether you need to adjust your pricing to better position your app.
Top Charts' potential and practical value extend far beyond our discussion.
We invite you to explore and use this feature for free, tailored to your specific needs!
Trust me,
FoxData will exceed your expectations!
All content, layout and frame code of all FoxData blog sections belong to the original content and technical team, all reproduction and references need to indicate the source and link in the obvious position, otherwise legal responsibility will be pursued.