

Explore More Possibilities for Your Business
Full-cycle scenario construction to meet your needs from App research, development, and release to operation.
Ready for your soaring growth
Every SaaS platform has a dashboard. But the real difference lies not in having one, but in how quickly and clearly it helps you answer the questions that drive your decisions.
The FoxData Dashboard is designed not just as a “reporting screen,” but as a real-time decision companion—turning raw data streams into immediate, actionable insights.
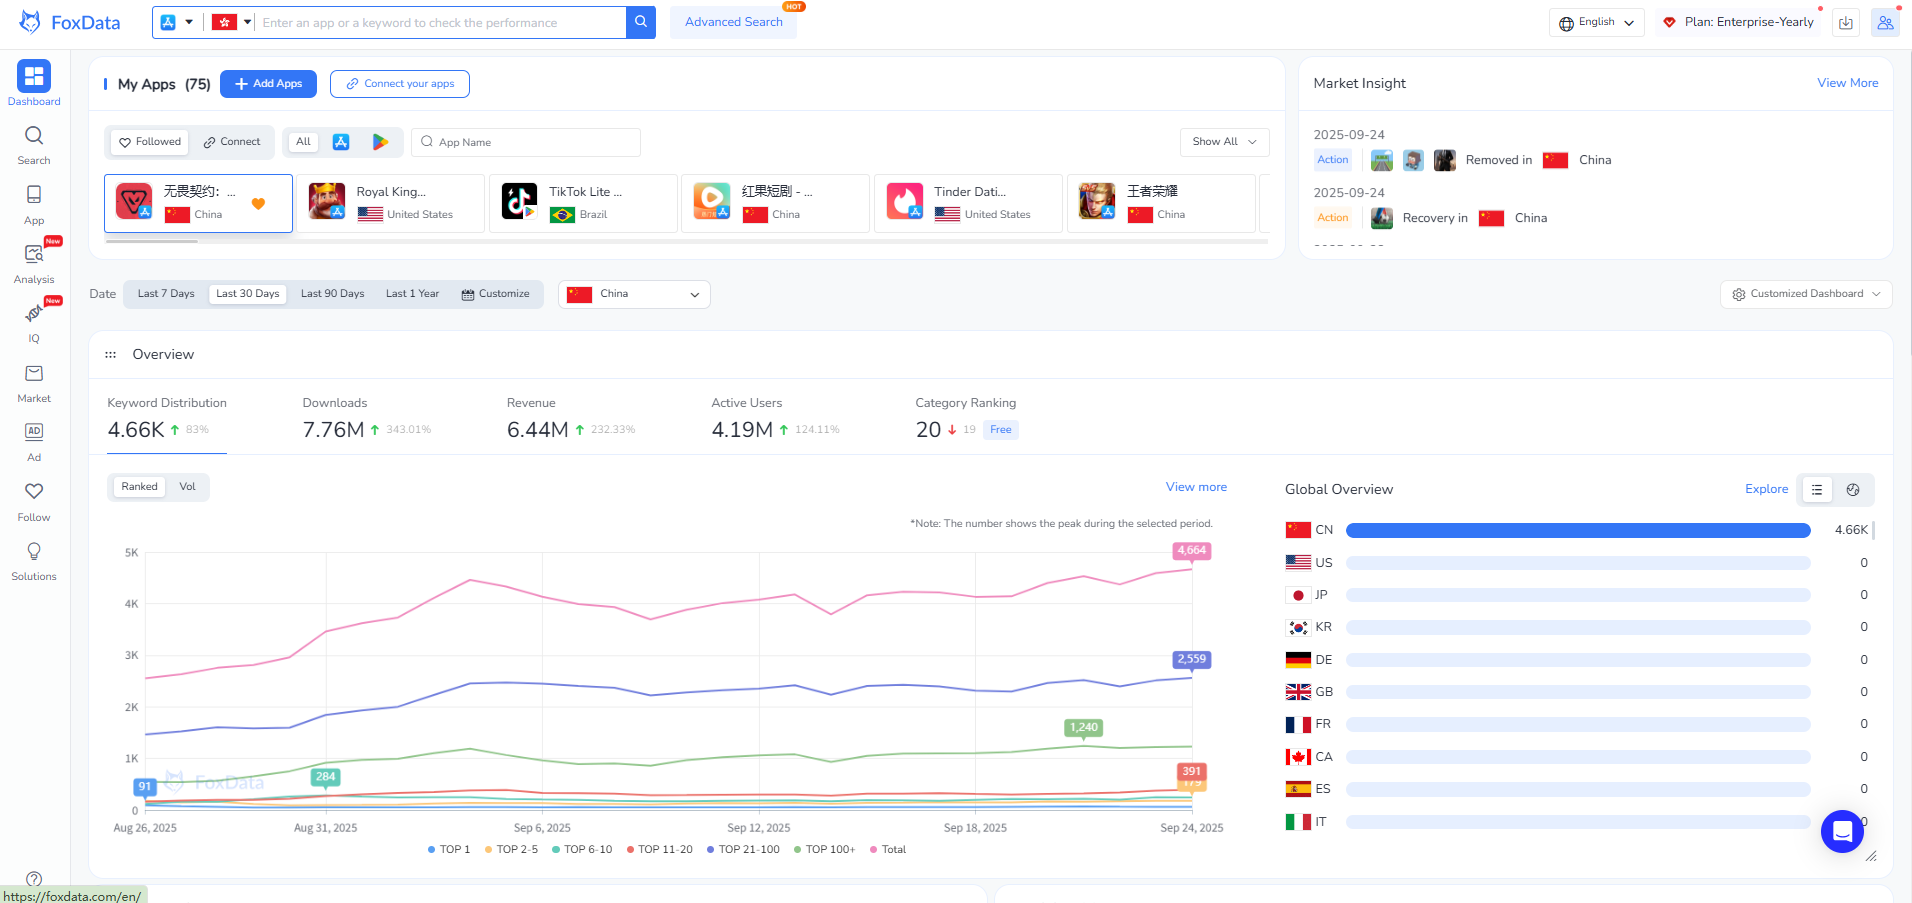
✅ Global Overview — No need to switch across multiple tools. See downloads, active user shifts, and keyword distribution across major countries/regions in one glance.
✅ Core Metrics Tracking — Downloads, revenue, active user counts, keyword rankings, and category positions displayed together, with trend charts that spotlight changes over time.
✅ Competitor Benchmarking in Seconds — Add apps to your watchlist, and FoxData instantly generates side-by-side comparisons, so you know where you stand in the market—instantly.
✅ Market Insight Alerts — Get notified the moment something critical happens: a competitor app is removed from a store, a new keyword spikes in demand, or a category suddenly surges.
Not just a dashboard. It’s a window into “what matters now.”
Step 1: Homepage → Dashboard
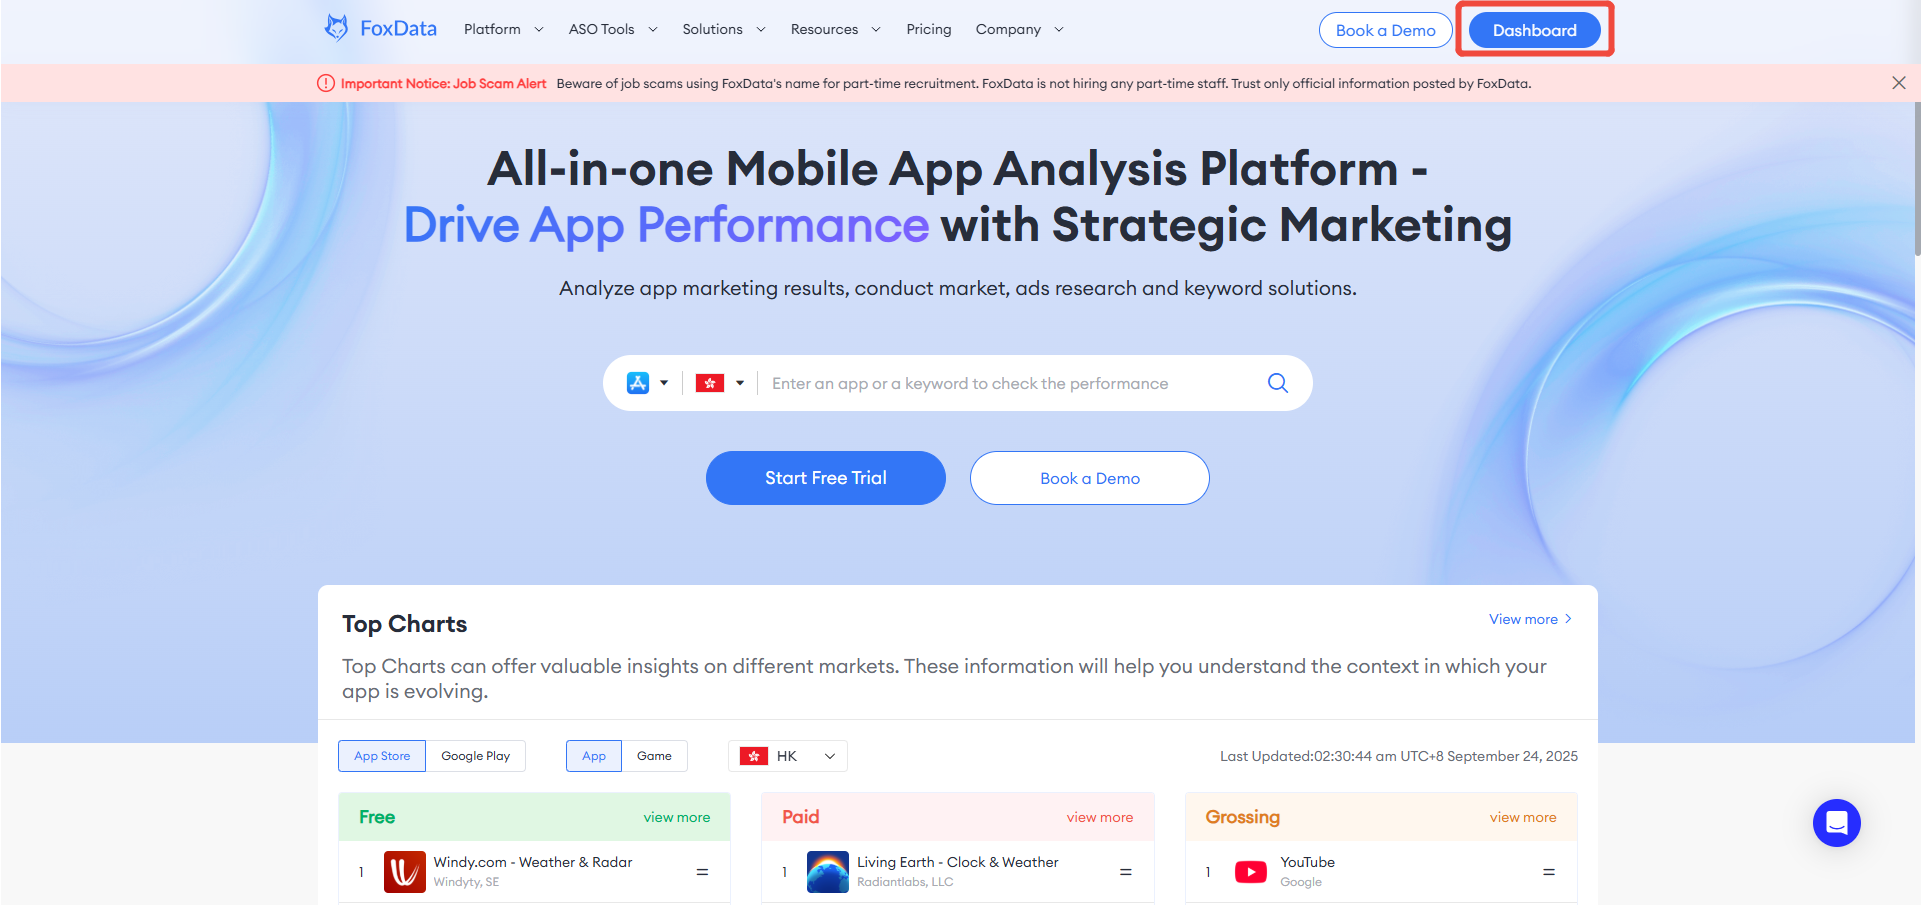
👉 One click from the homepage, and the Dashboard lays out your industry view—like lifting a curtain on the market landscape.
Step 2: Add My Apps & Competitors
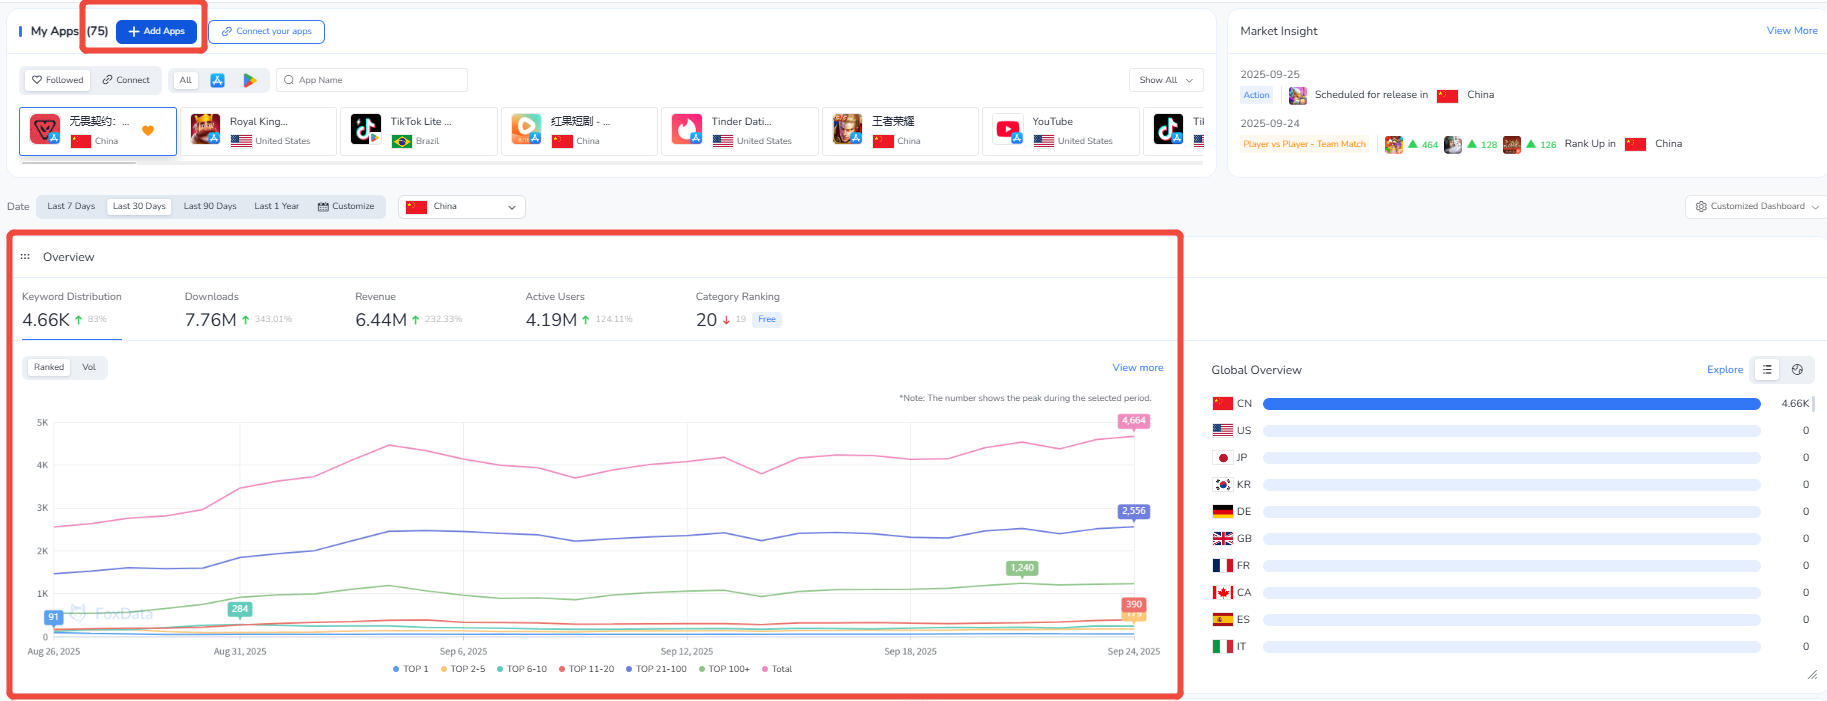
👉 Add your own flagship app alongside competitors. Within seconds, you see how your downloads, revenue, and user activity stack up against theirs.
Step 3: Scan the Overview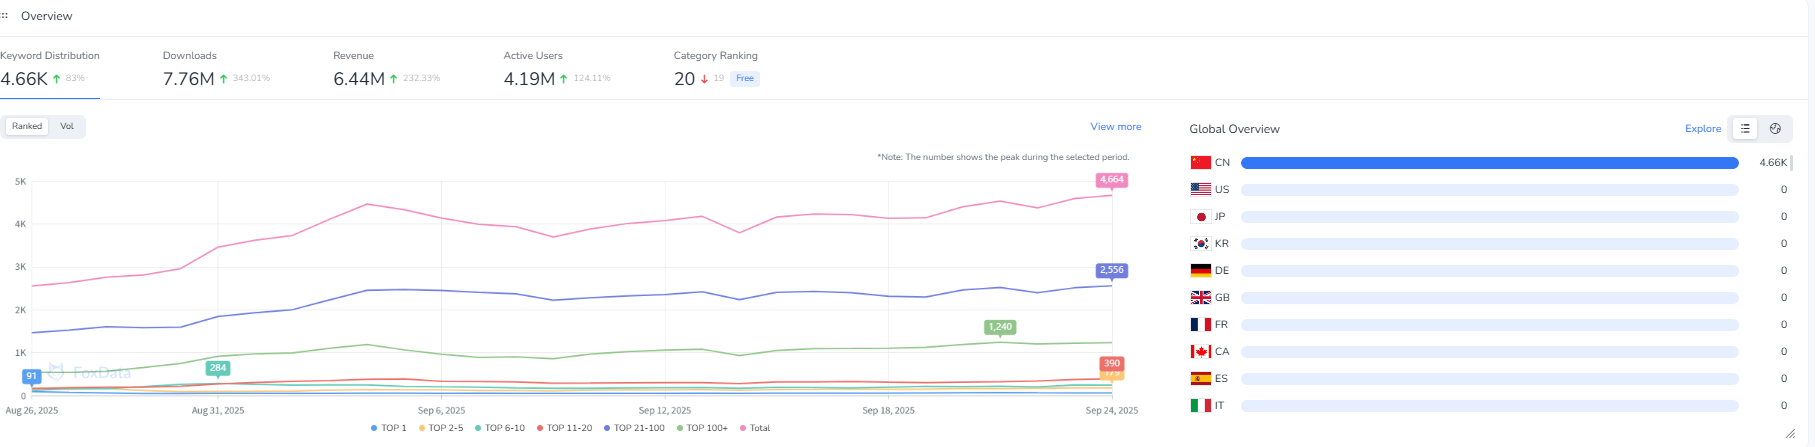
👉 See at a glance: your app’s downloads up 343% in the past 30 days with revenue rising in parallel. The trend isn’t theory—it’s proof of traction.
Step 4: Slice by Time & Region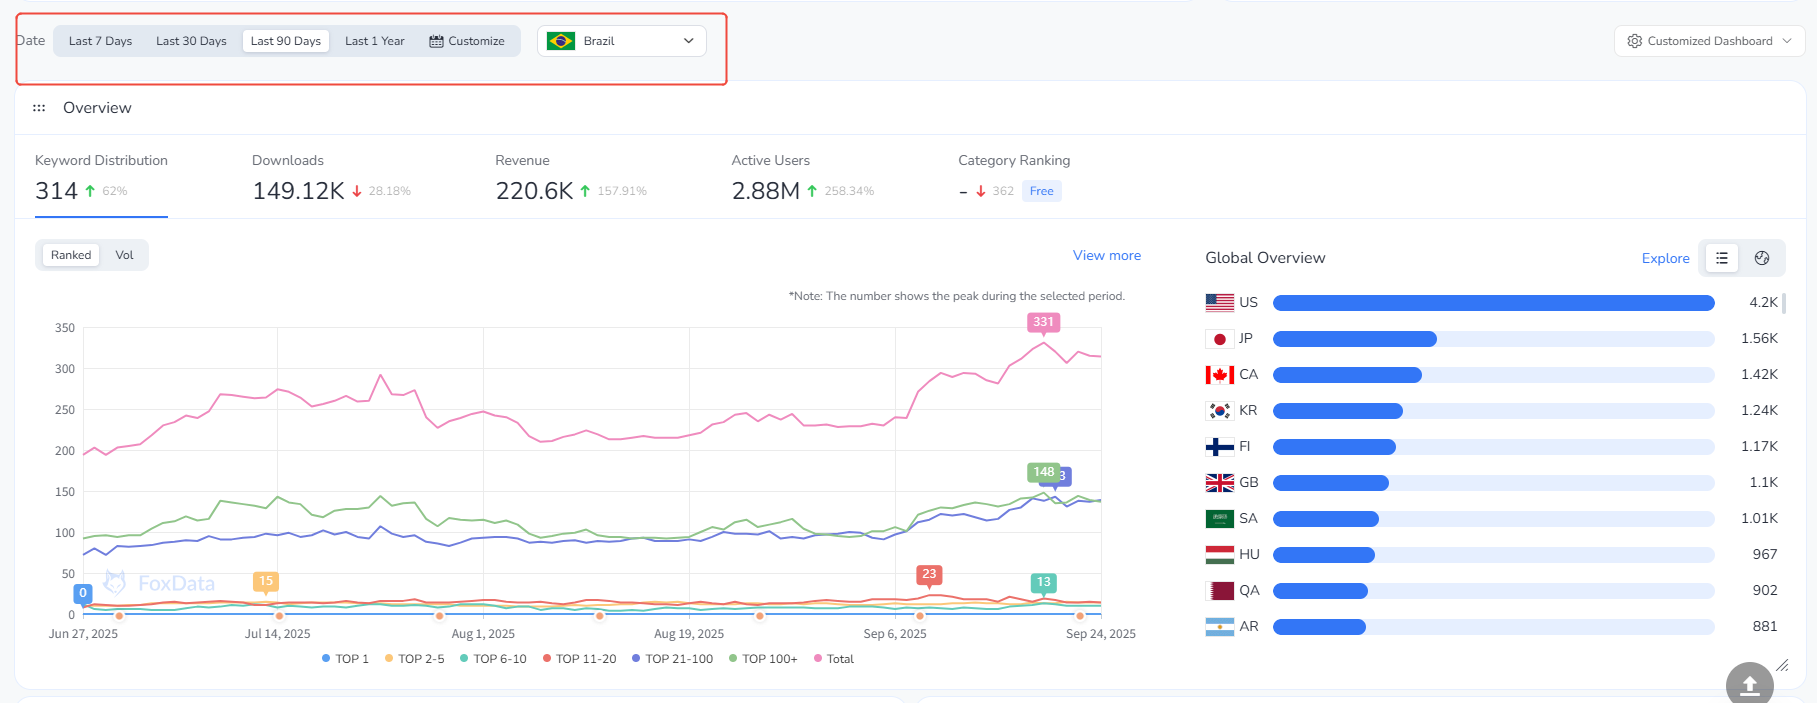
👉 Switch the lens to “90 days” and focus on “Brazil.” You immediately notice: keyword search volume and active users are rising in sync—evidence of an untapped growth opportunity.
Step 5: Market Insights in Action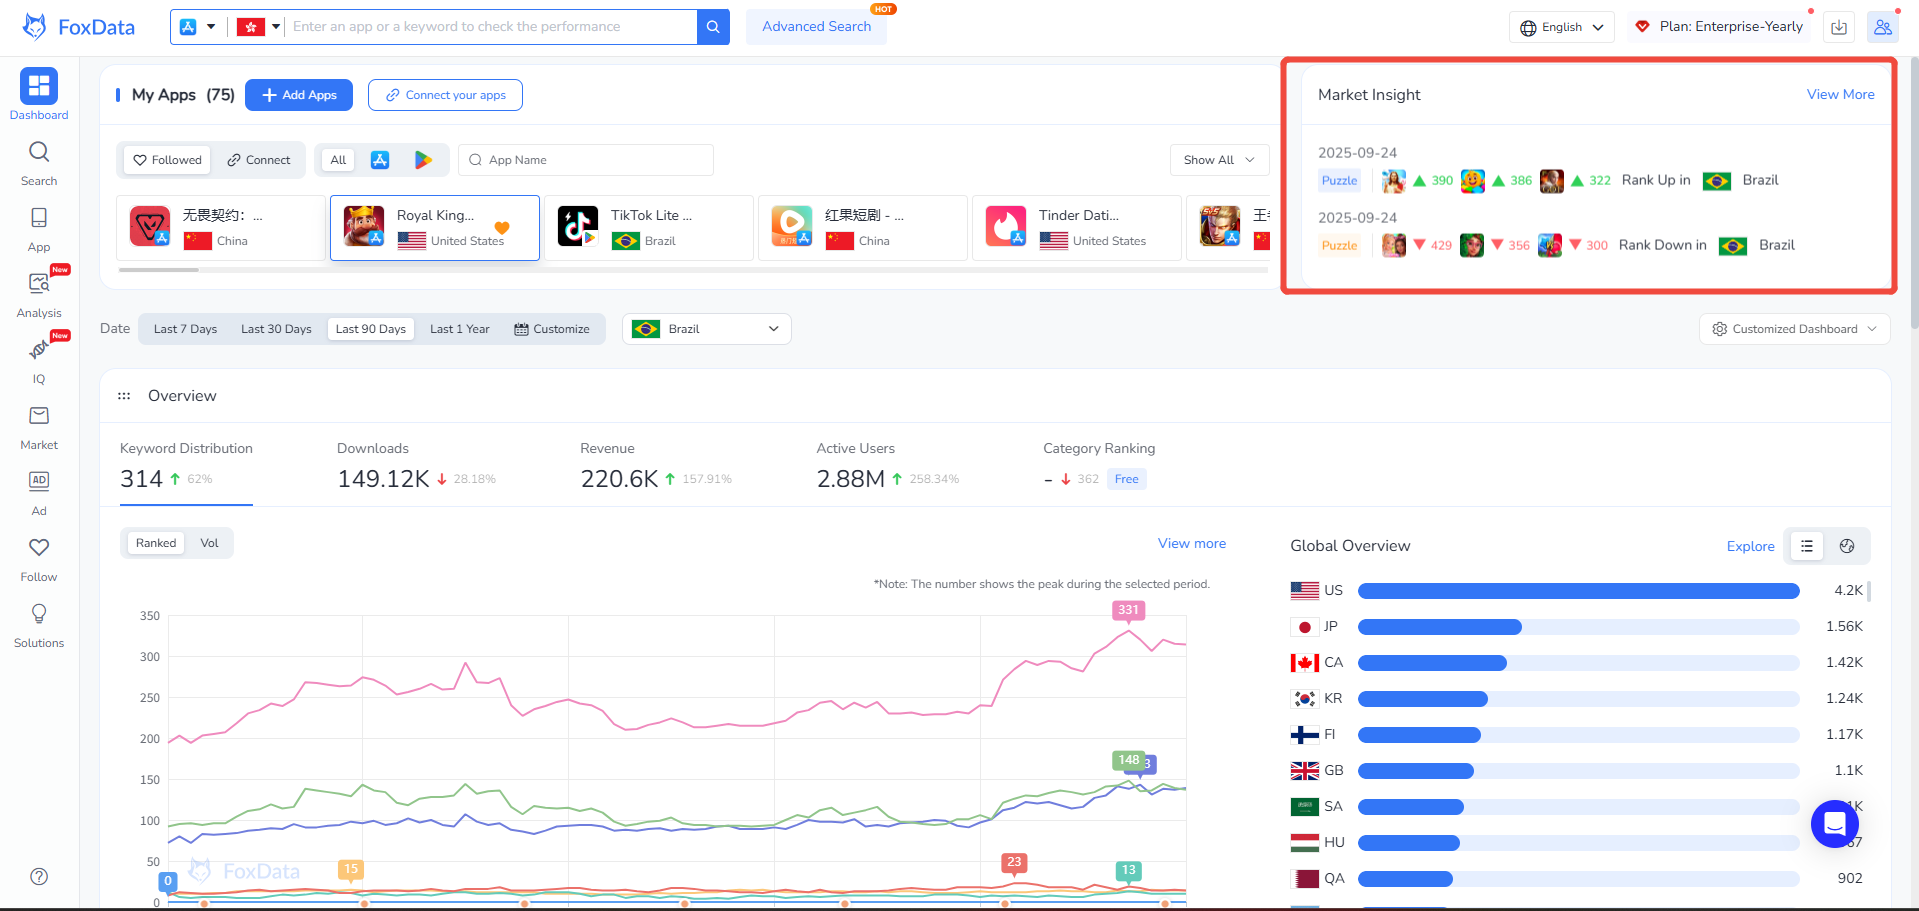
👉 The panel highlights an alert: a competitor app has just been removed from the China store. This isn’t just information—it’s a signal to move faster and capture share.
⚡ In minutes, what normally takes hours (or a team compiling reports) is already on your screen, ready to act on.
Most dashboards show you data. FoxData shows you answers.
🔹 Real-Time, Not Yesterday’s Data — Metrics update dynamically, so strategies are built in hours, not days.
🔹 Multi-Dimensional Slicing — Move fluidly between country, category, keyword, or competitor views.
🔹 Proactive Alerts — You don’t chase the data; the Dashboard flags changes before you even know to ask.
🔹 From “What” to “Why” — Beyond numbers, FoxData interprets patterns—helping you connect metrics with market reality.
Step 1: Anchor Key Apps
Add your own apps and competitors. Benchmark instantly across downloads, revenue, users, and keyword rankings.
Step 2: Slice & Drill Down
Segment by timeframe (7-day vs. 90-day), country, or sub-category. Identify true growth drivers behind the topline.
Step 3: Deepen Insight (Keywords + Ads)
Step 4: Stay Alert with Real-Time Signals
👉 Together, these steps make the Dashboard not just a data panel, but a growth cockpit.
FoxData Dashboard isn’t about having “another analytics page.” It’s about:
⚡ Getting to the insights you need faster than competitors
⚡ Acting on real market shifts before they become crowded trends
⚡ Turning complex market signals into clear, simple choicesStop managing spreadsheets. Start leading with real-time market clarity.
👉 Explore the FoxData now and make data your sharpest competitive edge.
Q1: How is FoxData’s Dashboard different from other SaaS dashboards?
A: Most dashboards only display KPIs. FoxData goes further by providing competitor benchmarking, keyword & ad monitoring, and proactive Market Insight alerts—so you don’t just see data, you see opportunity.
Q2: How often is the data updated?
A: All core metrics (downloads, revenue, active users, keyword ranks) are updated in real time or near real time, ensuring decisions are based on current dynamics, not stale numbers.
Q3: Can I customize the Dashboard view?
A: Yes. You can filter by timeframe, region, category, sub-category, or competitor. This flexibility means you always see the slice of data most relevant to your strategy.
Q4: Does it support multi-market analysis?
A: Absolutely. Global overview shows you top countries side-by-side, while regional deep dives let you zoom into emerging opportunities in specific markets like Brazil, India, or Southeast Asia.
Q5: How does the Dashboard help with UA/ASO?
A: By surfacing keyword performance, discovering new “high-opportunity” terms, and tracking competitors’ ad creatives, it helps teams optimize both organic ASO strategies and paid campaigns seamlessly.
© 2020-2026 FoxData. All Rights Reserved.
