





Explore More Possibilities for Your Business
Full-cycle scenario construction to meet your needs from App research, development, and release to operation.
Ready for your soaring growth

Downloads alone stopped meaning success a while ago. Without a clear view of what each user is actually worth, even a large budget can go to the wrong place. If any of those three lines sound like your last team meeting, that's exactly the gap FoxData's ARPU (Average Revenue Per User) metric inside Revenue Analytics is built to close.
|
Role |
Sound familiar? |
Start With |
|
Growth marketer |
Ad spend is up, ROI is flat, and you can't tell which market is actually responsible |
ARPU + Event Correlation Dashboard |
|
Product manager (subscription apps) |
Downloads look healthy but subscription conversion lags |
ARPU trendline by market |
|
Studio / publisher |
You run the same app in 5+ markets and need to know where to double down |
Market-level ARPU comparison |
|
UA manager |
A campaign drove downloads — you need to know if it drove value |
Campaign-triggered ARPU spikes |
Many teams fixate on total revenue while overlooking the value of each individual user.
ARPU doesn’t just measure how much money you’ve made—it tells a deeper story:
✅ Does your revenue come from a few high-value users, or is it broadly distributed?
✅ Between Market A and Market B, which users deliver greater returns?
✅ Is your growth real monetization growth, or just a surge in downloads?Inside FoxData, ARPU is not just a calculation. It’s contextualized by time periods, markets, categories, and even event triggers (such as holidays or ad campaigns), giving you a clear picture of how and when revenue is generated.
A gaming studio noticed that downloads in France and Brazil were similar, but returns from French ad spend lagged.
Using FoxData Revenue Analytics – ARPU Dashboard,
they discovered:
⚡ Decision: Double down on long-term retention in France, while treating Brazil as a market for time-limited holiday promotions.
👉 Result: ROI increased by 35%, with ad spend allocated more effectively.
A subscription-based productivity app entered the Japanese market, where downloads looked strong but subscription conversions lagged.
The ARPU trendline showed a clear lift after the team introduced a monthly discount plan.
They realized that Japanese users prefer to “start small, then commit long-term.”
⚡ Decision: Add a low-cost trial plan and improve visibility of subscription entry points.
👉 Result: Market-wide revenue grew by 50% within two months.
💡 FoxData's productivity app analytics, ASO intelligence, market trend data, and user behavior insights work together so every optimization decision is backed by a number, not a hunch. Learn more about FoxData here | Book a demo with FoxData team today!
The two cases above show what ARPU catches that total revenue misses. The comparisons below show why the number means something different depending on what kind of app you run — read your own app's category before you read the numbers.
There is no universal benchmark for ARPU (Average Revenue Per User). Its value needs to be interpreted in the context of app category and market dynamics. Different app types (e.g., short video vs. romance game) and different platforms (iOS vs. Android) often exhibit very different patterns of monetization.
From the Table:
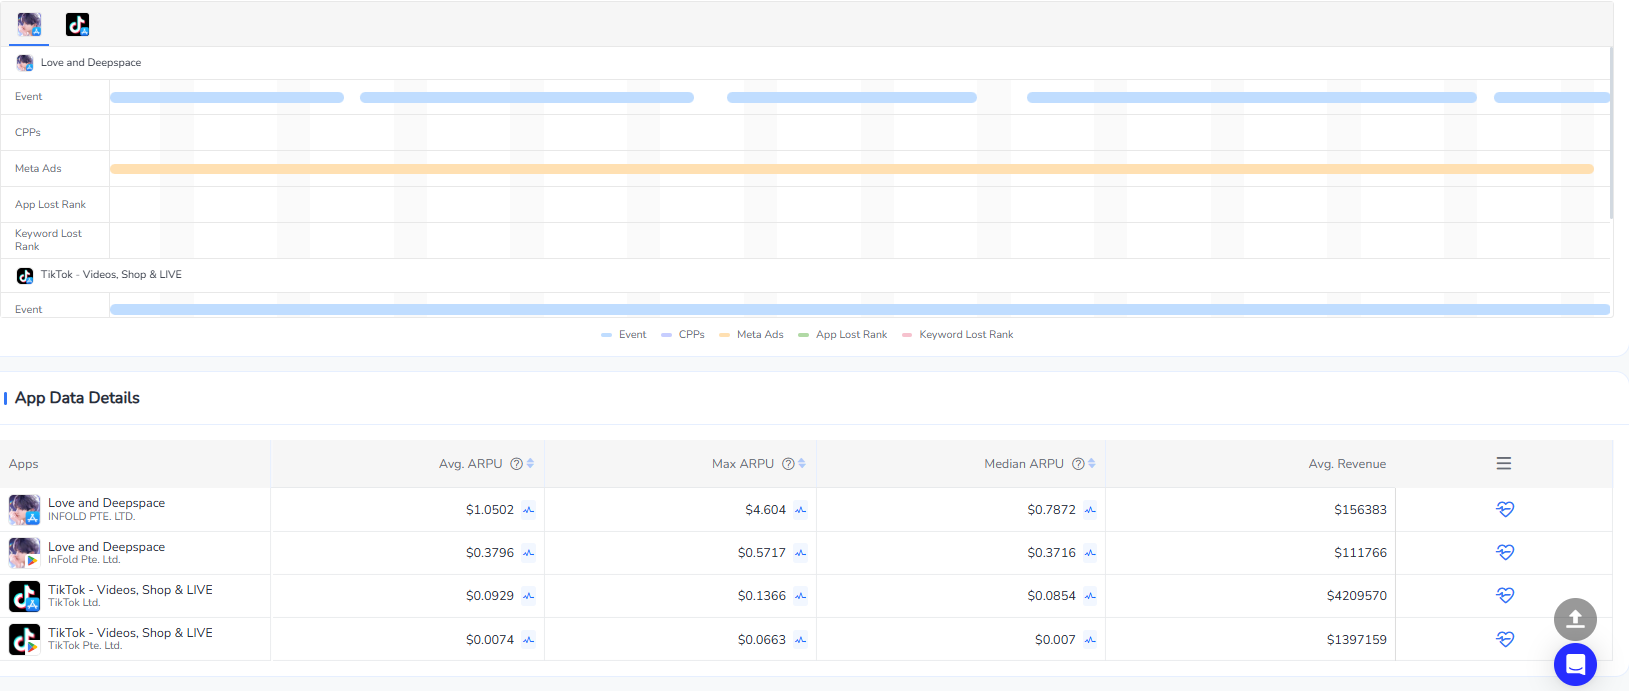
⚡ Takeaway:
The ARPU trend chart clearly illustrates how the two apps generate revenue over time: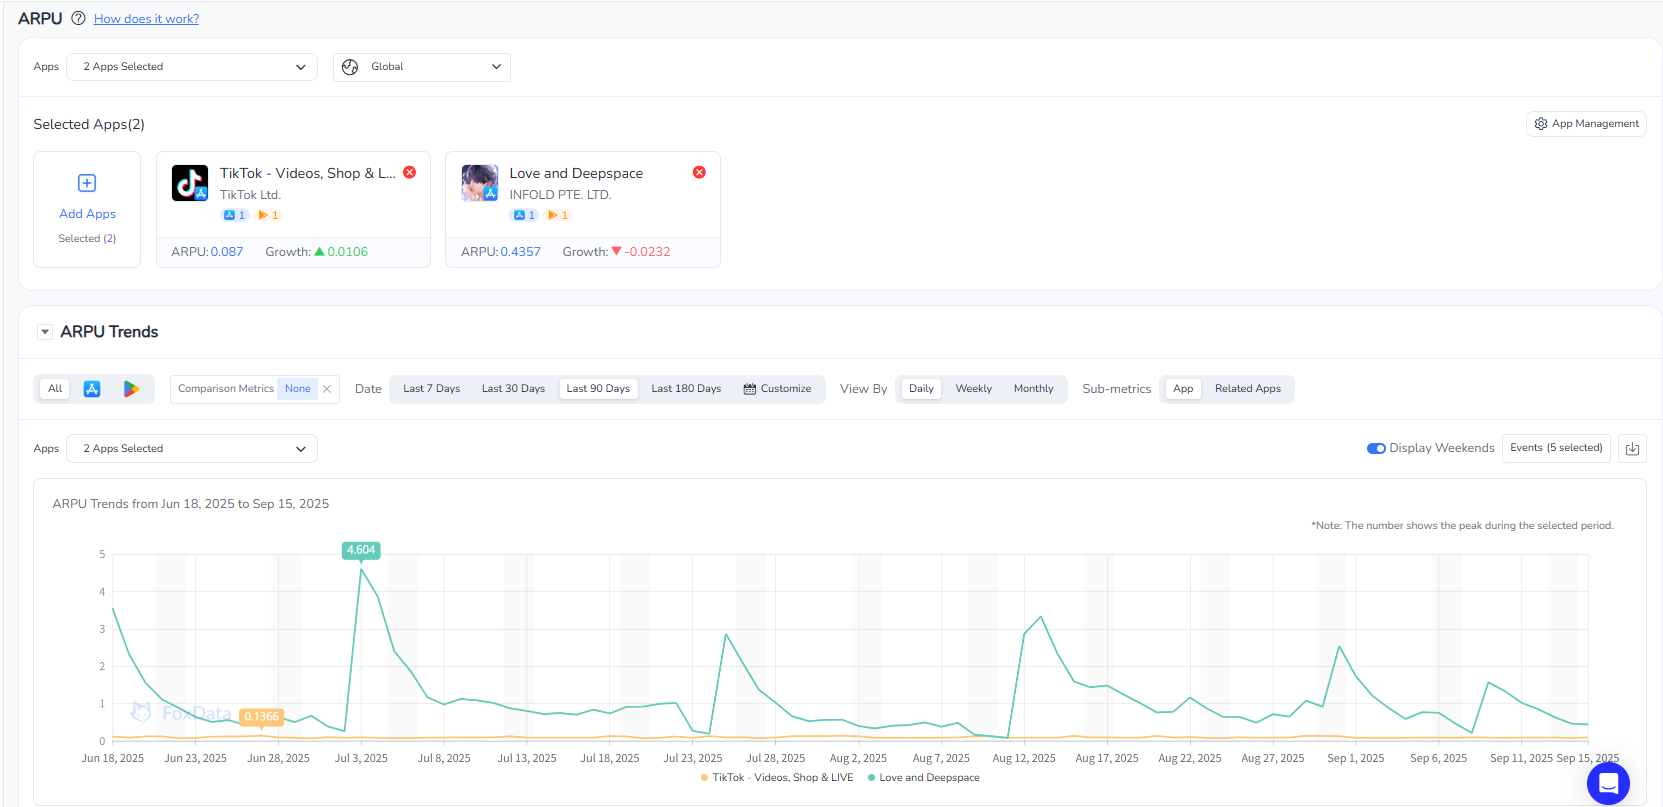
⚡ Takeaway:
FoxData’s ARPU + Event Correlation Dashboard makes it easy to align monetization outcomes with campaign activity:
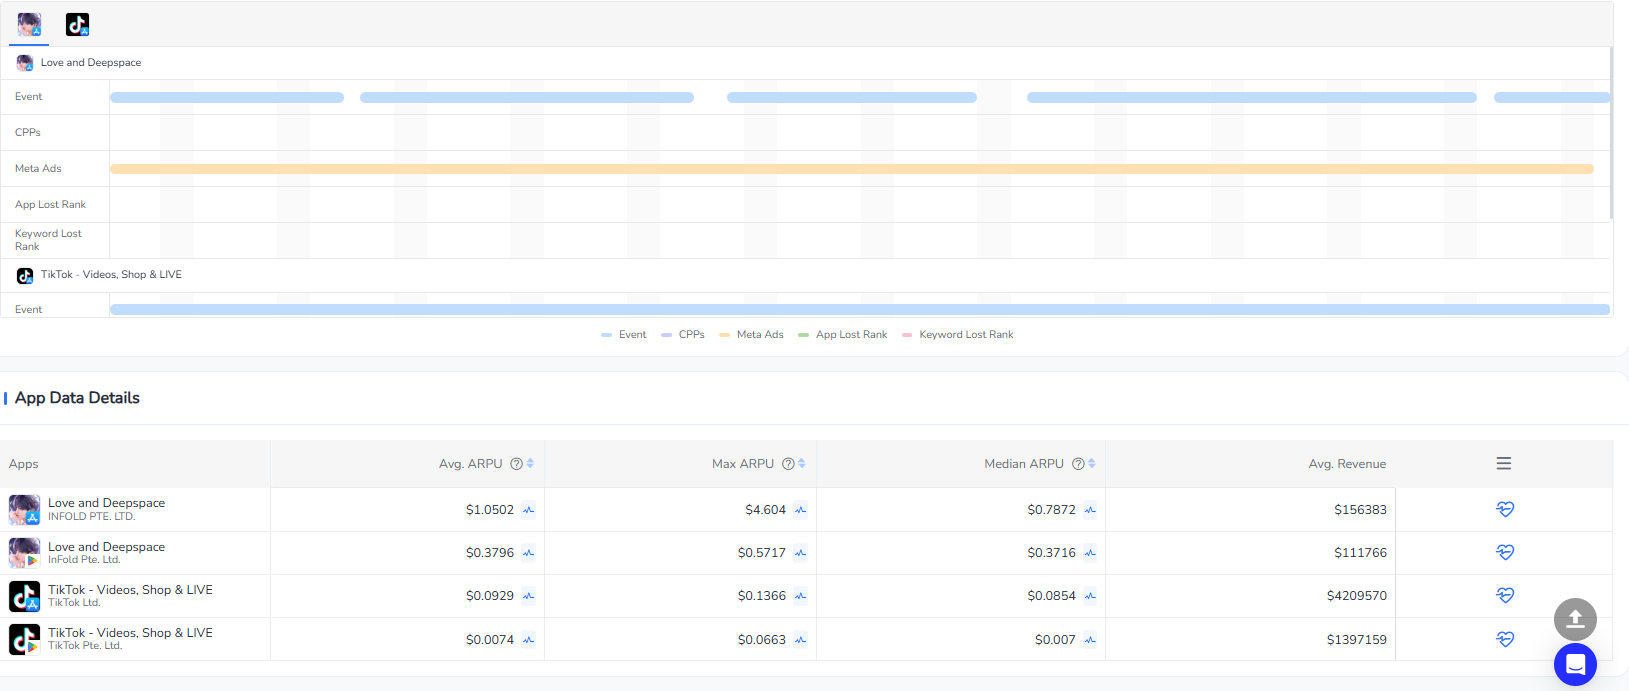
⚡ Takeaway:
Average ≈ Median → Indicates a broadly monetizing user base (e.g., Love and Deepspace iOS).
Regular fluctuations with peaks that stabilize at a higher baseline instead of collapsing back to low levels.
Average ≫ Median → Indicates reliance on a few “big spenders” (high risk if they churn).
Flat or consistently low curves → Even with a large user base, weak conversion to ad or subscription revenue leads to limited long-term ROI (e.g., TikTok’s lower ARPU structure).
The case studies above run on FoxData's Revenue Analytics – ARPU Dashboard, part of the Enterprise plan (custom pricing), which adds download & revenue intelligence and global performance tracking on top of the Growth tier's core ASO toolset. If you're currently on Standard or Growth, see what Enterprise adds before your next market-expansion decision.
Q: Is there a "good" ARPU number I should be aiming for?
A: No universal target — ARPU only means something relative to your category and market. Compare your ARPU against your own history and category peers, not an abstract benchmark.
Q: How is ARPU different from just tracking total revenue?
A: Total revenue can rise purely from more downloads while per-user value stays flat or falls. ARPU isolates whether growth is coming from genuinely higher-value users or just a bigger crowd.
Q: Can I see ARPU broken down by market and time period at once?
A: Yes — FoxData's ARPU Dashboard segments by market, category, time period, and event triggers like campaigns or holidays in the same view.
Q: What plan includes ARPU / Revenue Analytics?
A:The Enterprise plan (custom pricing). Compare plans here.
The winners in today's app economy aren't the ones with the most downloads — they're the ones who know what each user is actually worth, and act on it before a competitor reallocates budget to the market you haven't looked at yet.
With FoxData Revenue Analytics (ARPU and more), you can:
⚡ Uncover the revenue potential behind every user
⚡ Compare market- and campaign-level ROI with confidence
⚡ Back investment and monetization decisions with reliable data
👉 Start using FoxData now—turn numbers into strategy, and ARPU into profit.
© 2020-2026 FoxData. All Rights Reserved.