


Explore More Possibilities for Your Business
Full-cycle scenario construction to meet your needs from App research, development, and release to operation.
Ready for your soaring growth
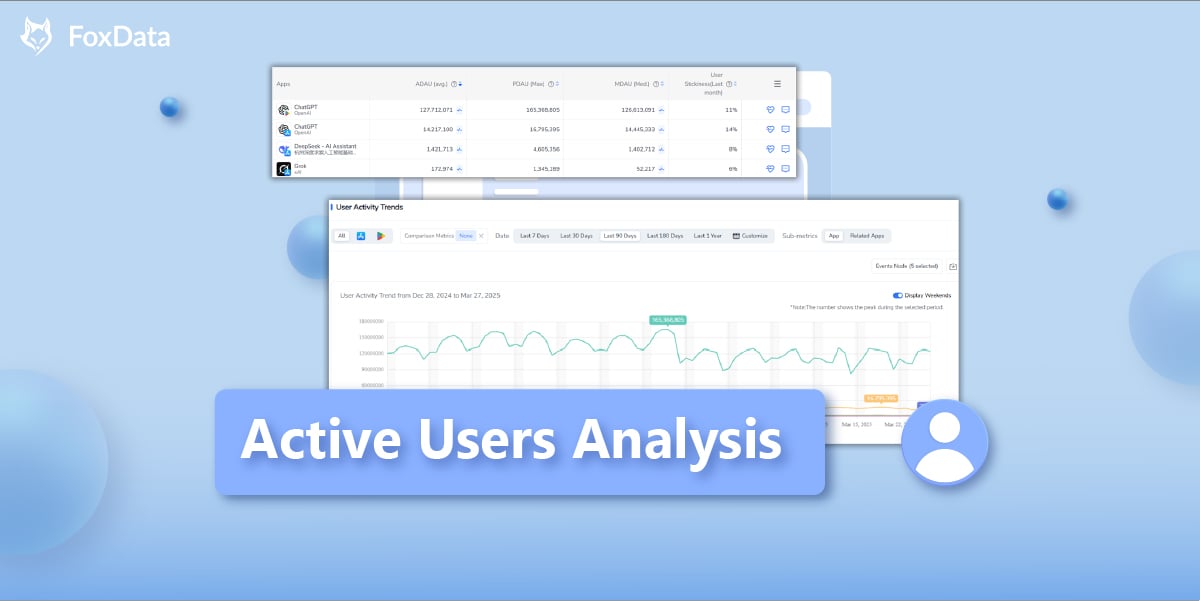
FoxData's latest feature, Active Users Analysis, empowers app developers and marketers with crucial insights into user engagement. By understanding active user trends, businesses can refine their strategies, improve retention, and maximize their app’s performance.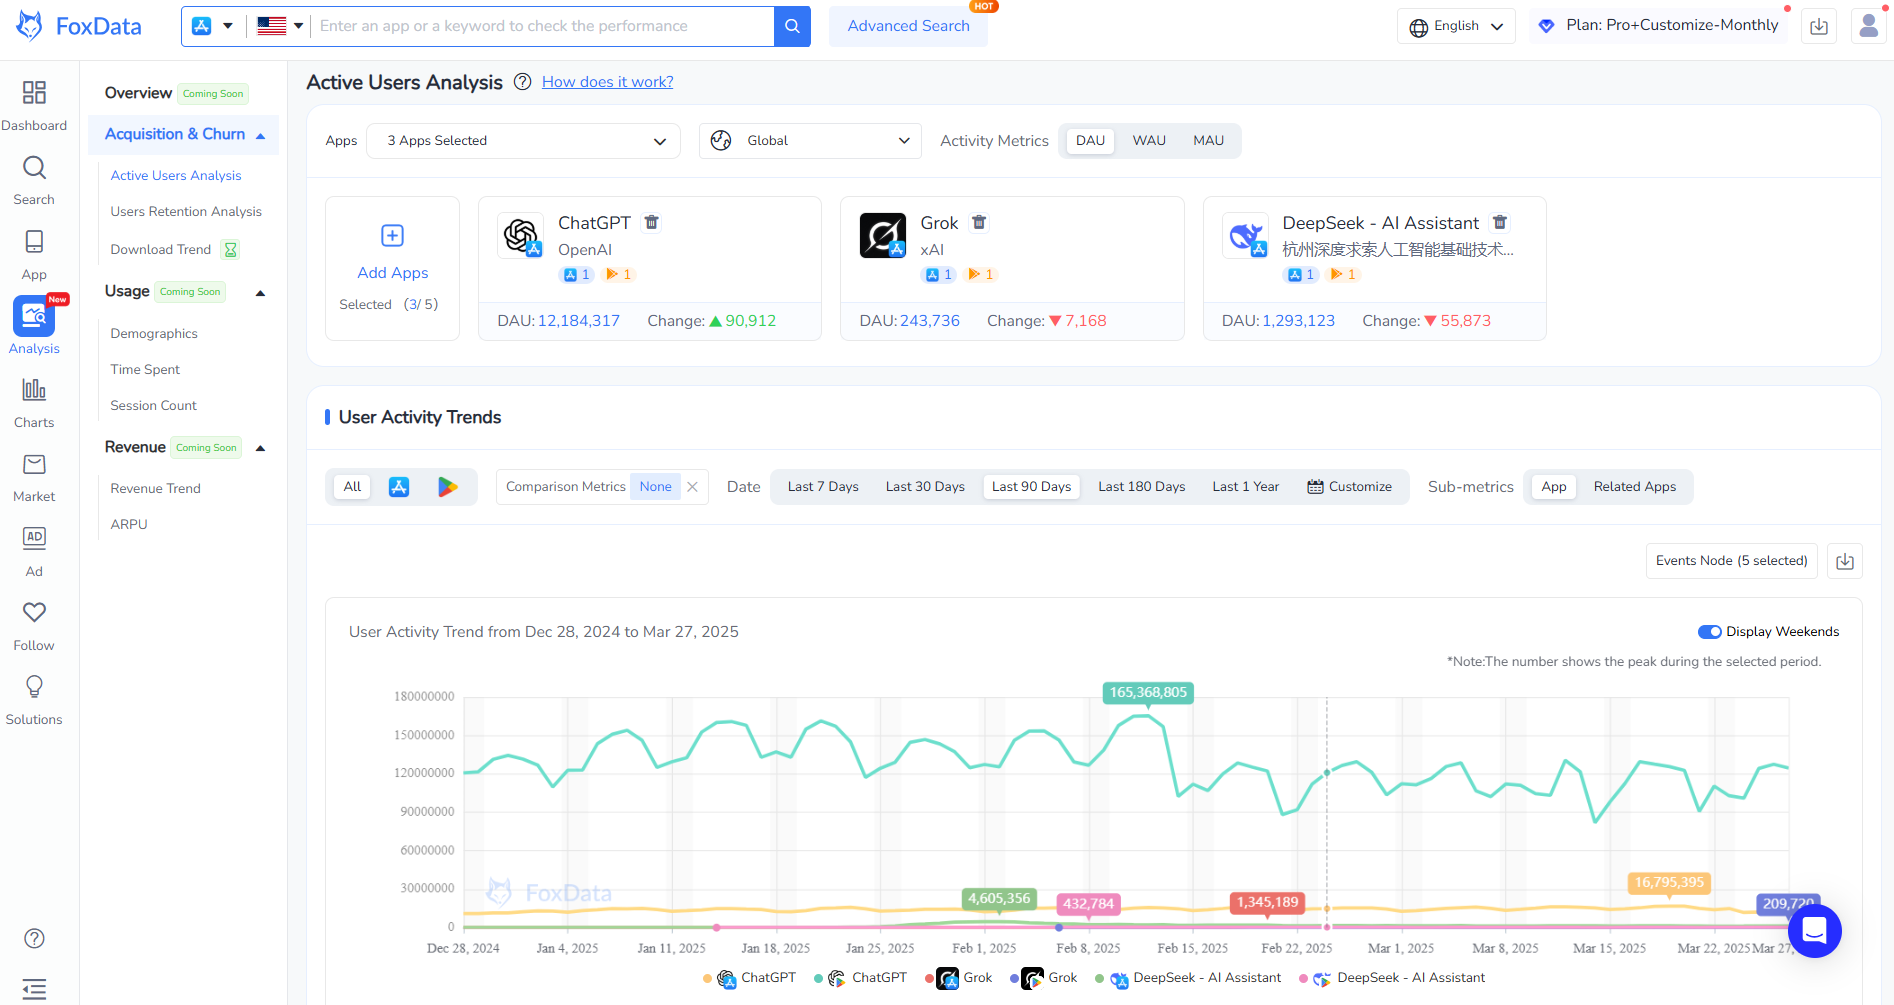
Active Users Analysis tracks user engagement over different periods—Daily Active Users (DAU), Weekly Active Users (WAU), and Monthly Active Users (MAU)—helping app owners measure retention and growth.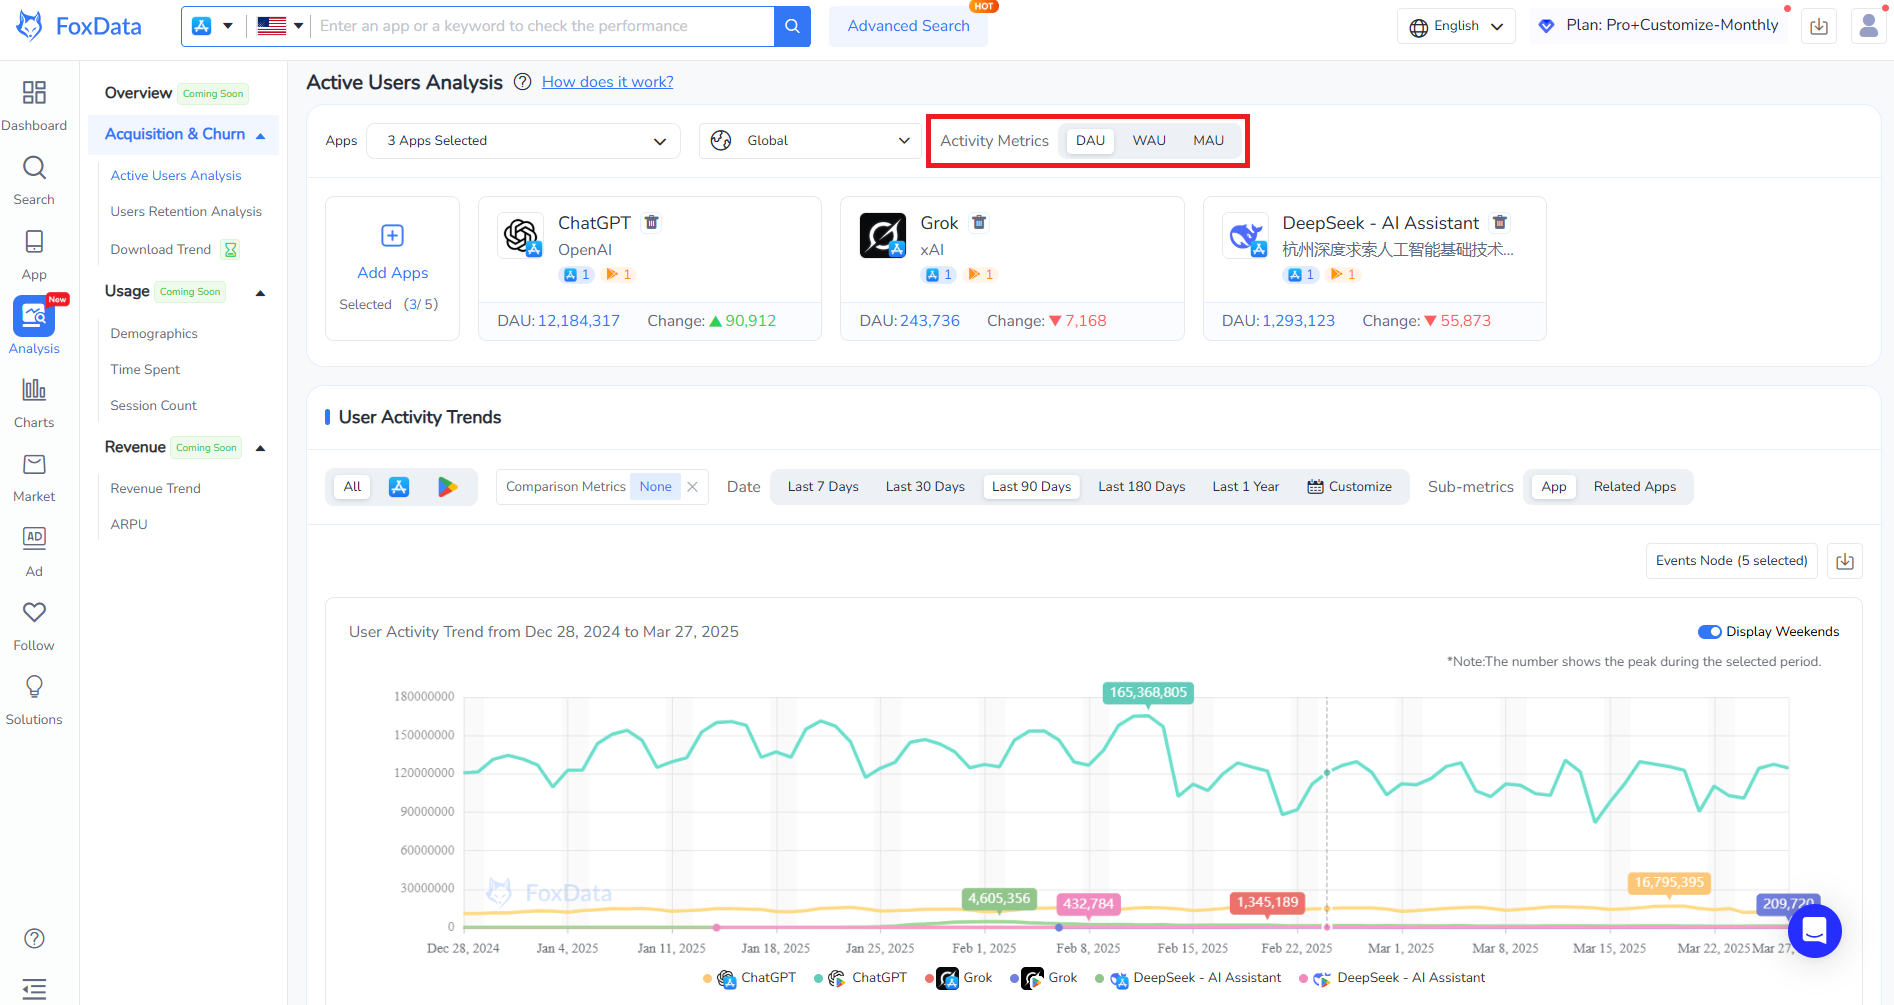
By analyzing these metrics, businesses can:
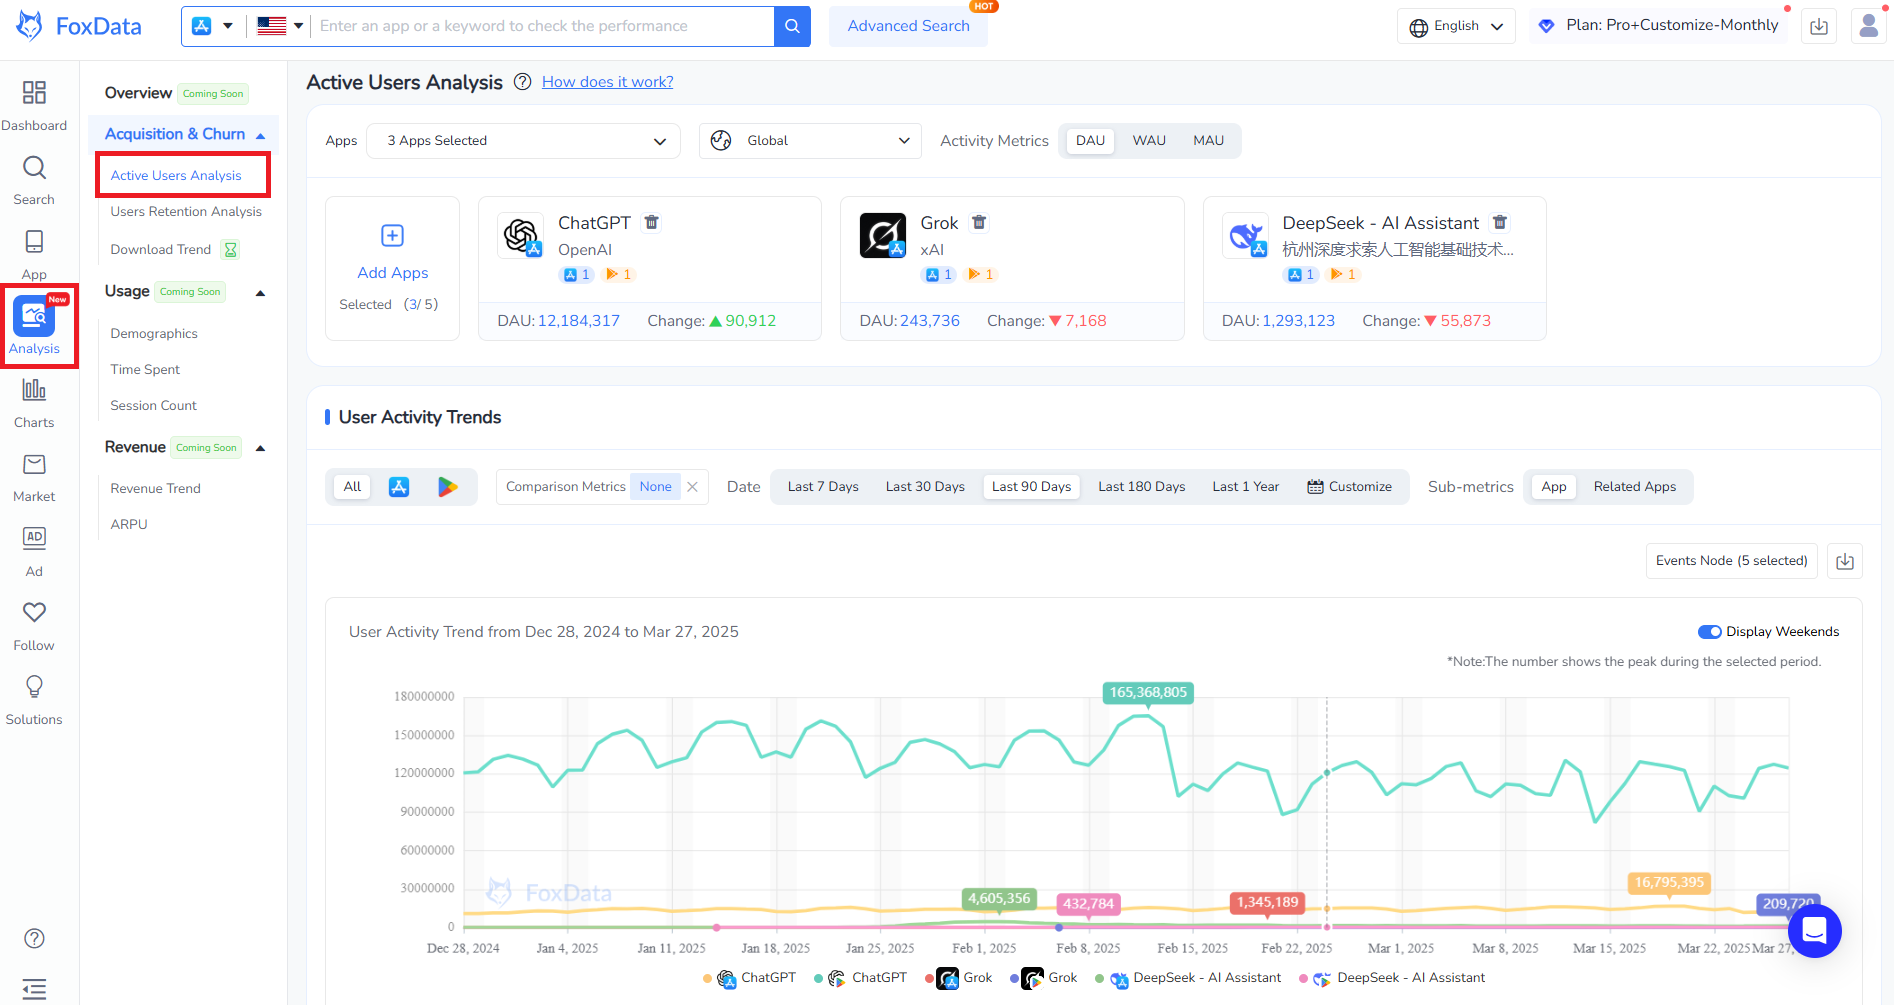
To view key "Active Users Analysis" metrics and insights:
Users can filter and add competitor apps, along with specific countries, for comparative analysis. The top section presents selected applications in a scrollable card format. Each application includes some details such as its logo, name, publisher, and the number of associated apps available on the App Store and Google Play and Daily Active Users (DAU) for the selected country. Additionally, it shows the percentage change in DAU compared to the previous day.
Line Chart in User Activity Trend
The chart visualizes user activity trends over a selected timeframe. Users can customize the display by selecting different data types, including platforms, timeframe and comparison metrics. If associated apps are selected, the chart reflects the total activity of the app and its related apps.
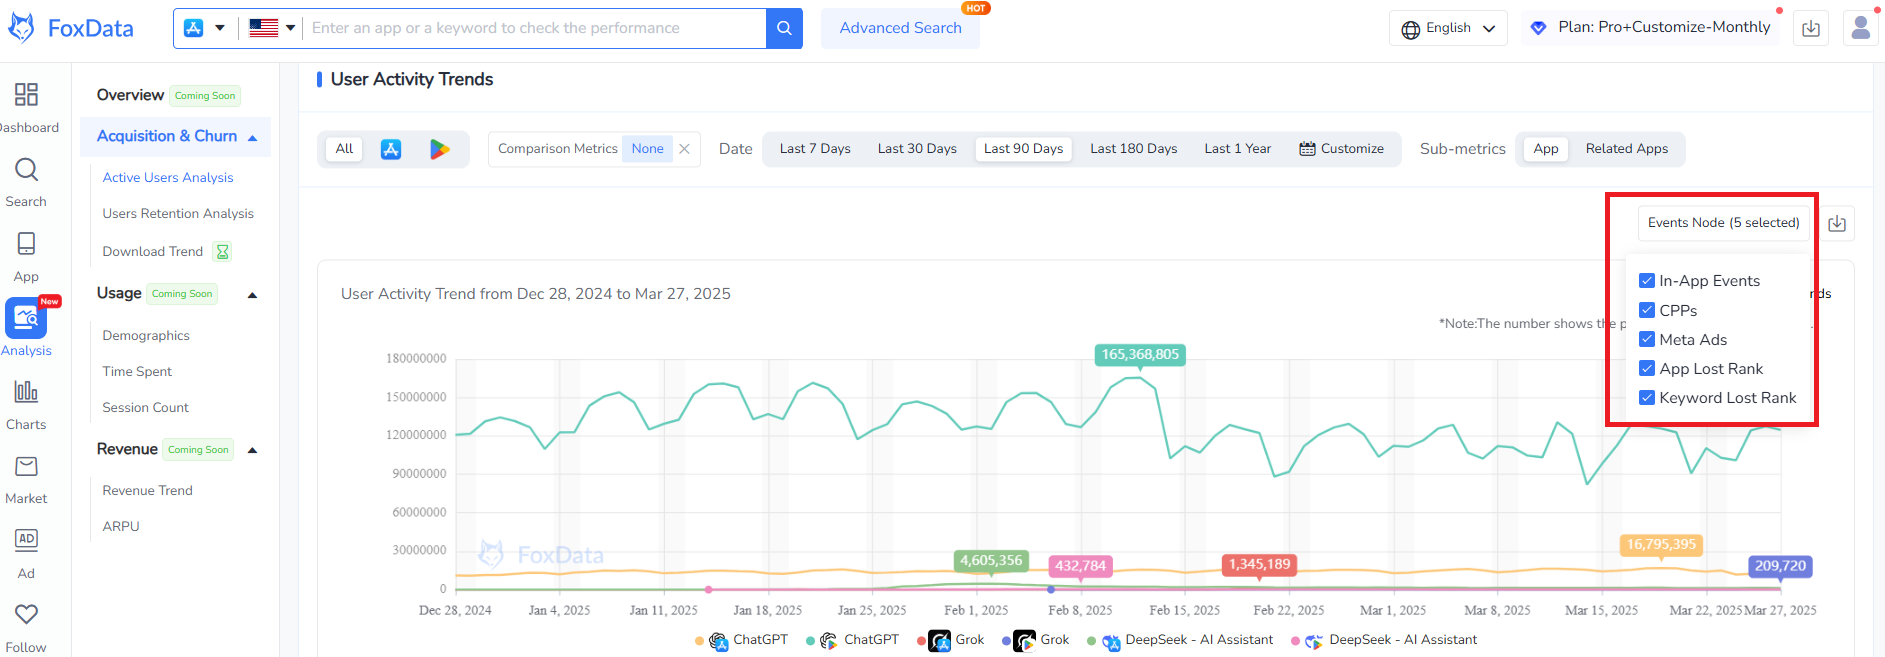
📒 Note: Events Node- to select (In-App Events/ CPPs/ Meta Ads/ Ranking Removal/ Keyword Removal) to see the user activity trend.
Comparison Metrics in User Activity Trend Line Chart
Users can add a secondary trend line to compare additional performance metrics, such as ranking, downloads, or revenue. This feature provides insights into how these factors fluctuate under the given conditions.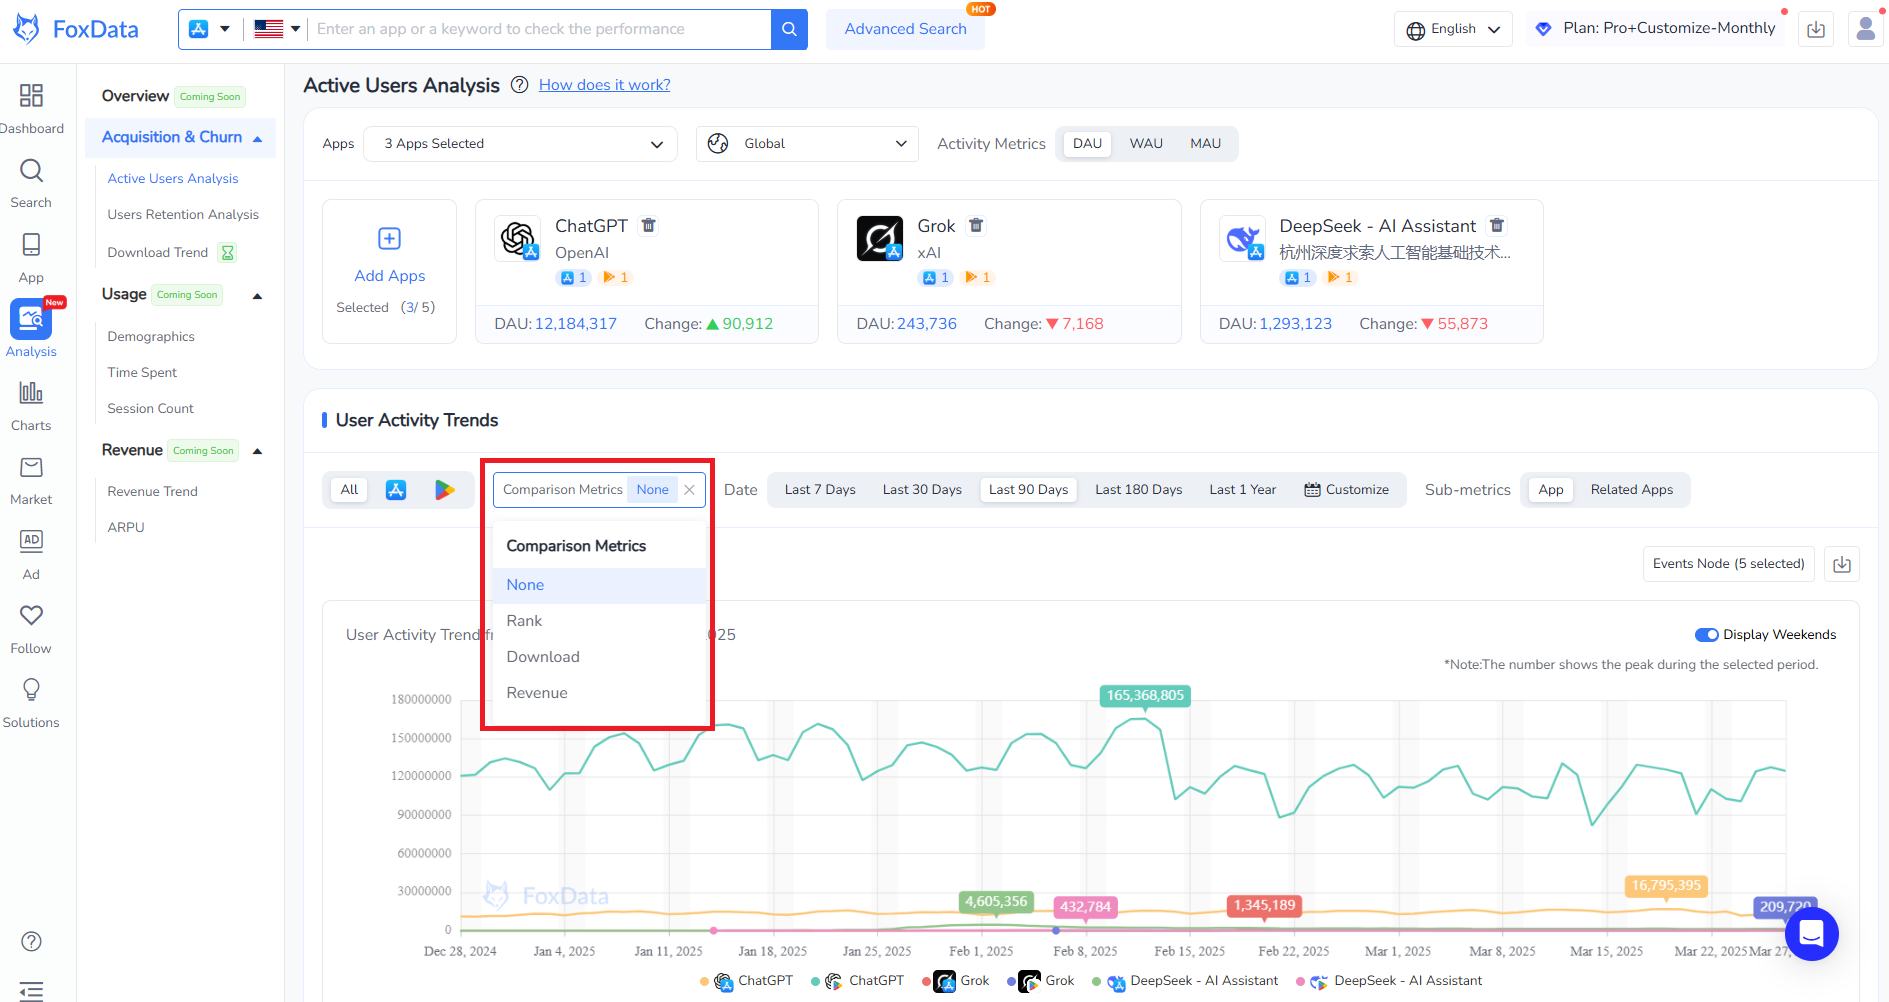
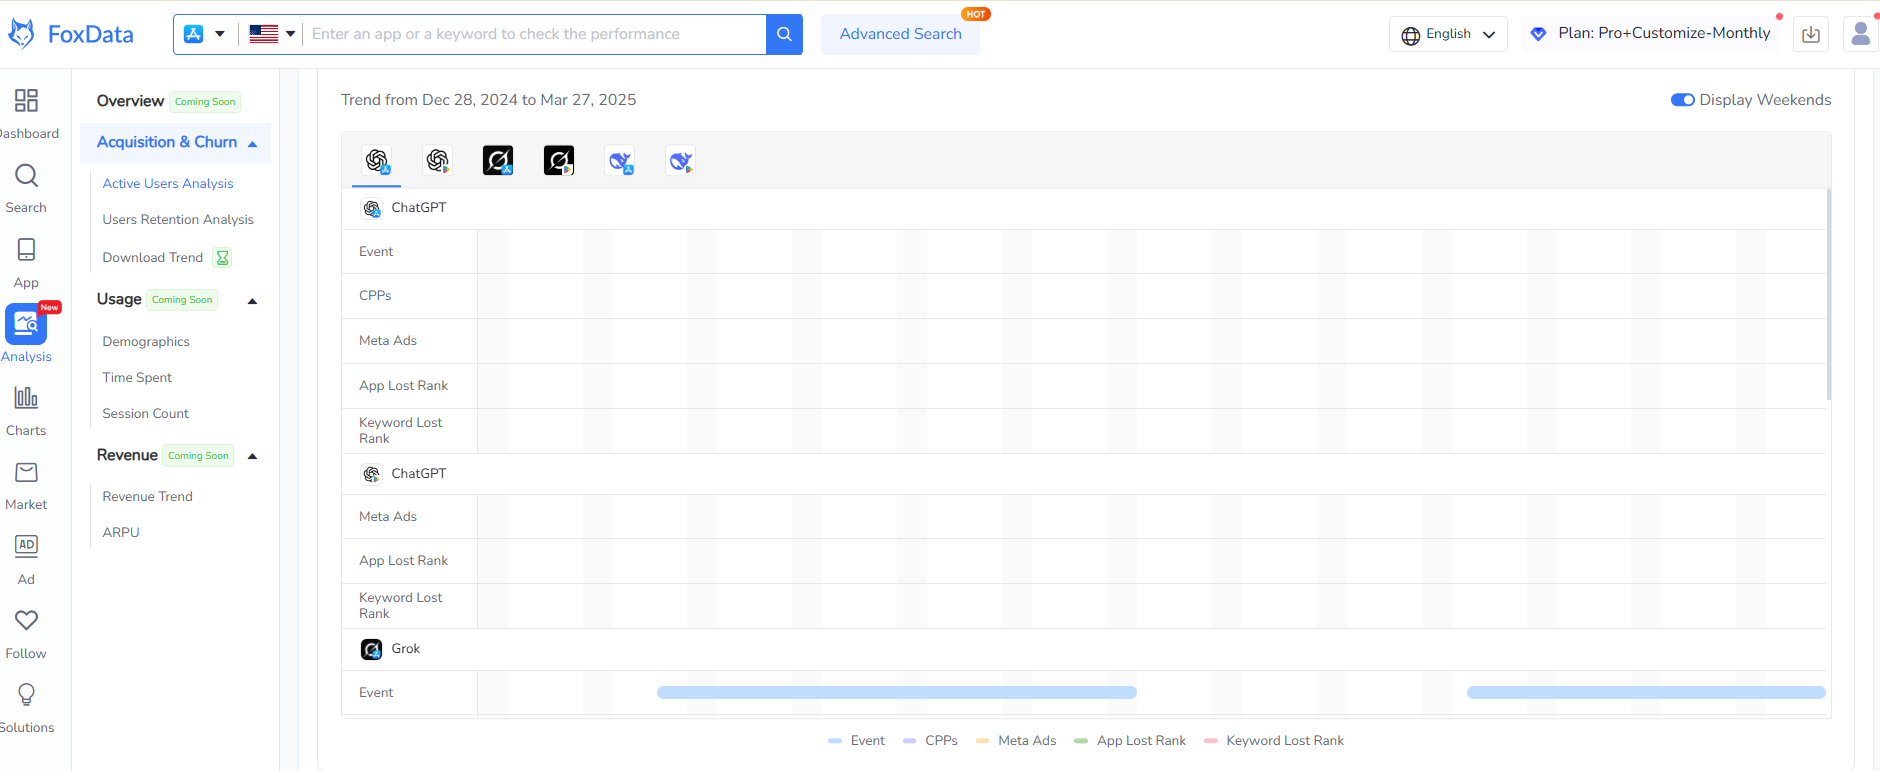
Event Gantt Chart in User Activity Trends
The trend chart also supports event tracking by integrating various activities, including in-app events, Custom Product Pages (CPPs), Meta Ads, App Chart Monitor and App Keyword Monitor. These events are displayed below the trend chart in a Gantt chart format, allowing users to visualize when specific activities took place.
The Active Users Leaderboard is part of the Active Users Ranking module. It displays the top 10 apps based on DAU, according to the selected filter conditions, providing a clear comparison of the highest-performing applications.
Active Users Analysis is the most comprehensive approach for tracking engagement, but here are additional ways to refine your research:
In today’s competitive app landscape, understanding user behavior is essential for sustainable growth. FoxData’s Active Users Analysis provides valuable, data-driven insights that help businesses improve user retention, engagement, and overall app success.
A: By providing insights into user engagement trends, Active Users Analysis helps you refine retention strategies, optimize marketing efforts, and enhance overall user experience.
A: Yes, you can filter and compare competitor apps within the analysis dashboard, gaining insights into their active user trends.
A: DAU (Daily Active Users): The number of unique users who engage with your app daily; WAU (Weekly Active Users): The number of unique users who engage with your app within a week; MAU (Monthly Active Users): The number of unique users who engage with your app within a month.
A: Yes, FoxData allows you to segment active user data by country, platform (iOS/Android), and time period for deeper insights.
A: Yes, FoxData provides detailed tutorials and guides in the FoxData blogs or Help Center to help you make the most of this feature.
Start using Active Users Analysis today to unlock the full potential of your app!
© 2020-2026 FoxData. All Rights Reserved.
