


Explore More Possibilities for Your Business
Full-cycle scenario construction to meet your needs from App research, development, and release to operation.
Ready for your soaring growth
→ Start Free Competitor Analysis with FoxData
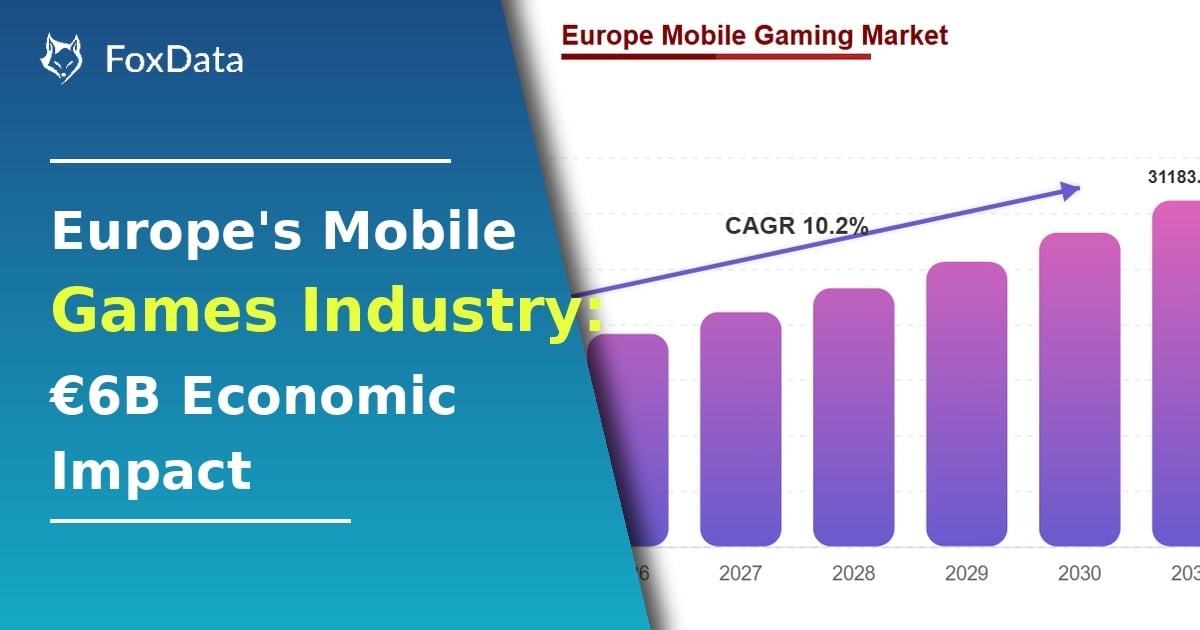
The mobile app market is a dynamic and fiercely competitive arena. With over 4 million apps on the App Store and Google Play, and downloads experiencing a slight year-over-year (YoY) decline, market saturation is a clear reality.
Despite this, the market crossed $330 billion in revenue in 2025 and is projected to reach $391 billion in 2026, indicating a shift from user-acquisition growth to a retention and value-driven competition model. In this environment, understanding how rival apps monetize is not merely beneficial; it is a strategic imperative.
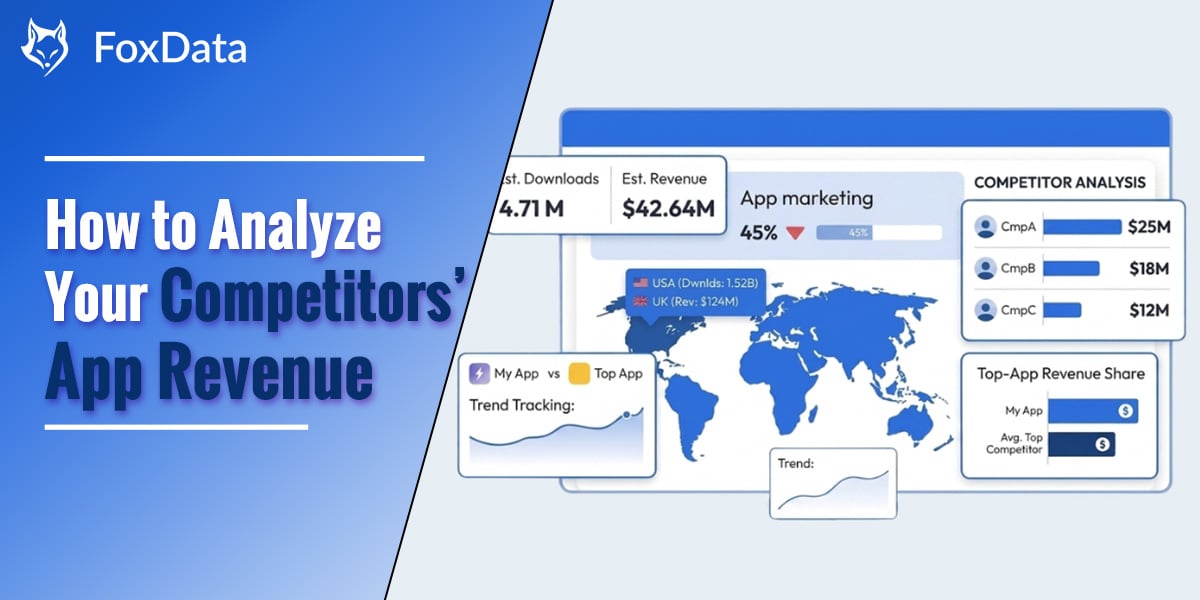
This guide provides a complete framework for analyzing competitor app revenue in 2026, equipping you with the knowledge and tools to gain a decisive competitive advantage. By dissecting competitor strategies, you can identify untapped opportunities, optimize your own monetization models, and ensure your app's long-term success.
Competitor app revenue analysis is the systematic process of estimating, tracking, and interpreting the monetization performance of rival applications. This involves utilizing a combination of third-party data intelligence tools, ASO signals, paid acquisition patterns, and market benchmarks to inform and refine your own growth strategy. It moves beyond simply observing download numbers to understanding the intricate mechanisms through which competitors generate income.
The mobile app market crossed $330 billion in revenue in 2025 and is projected to reach $391 billion in 2026. The market has shifted from user-acquisition growth to a retention and value-driven competition model. Top publishers are investing more in data intelligence, not less.
This means:
|
Signal |
What It Tells You |
|
Revenue trend (rising/ flat/ declining) |
Competitor's monetization health |
|
Revenue by country |
Which markets to priotize or avoid |
|
Revenue vs. download ratio |
Monetization efficiency (ARPU proxy) |
|
ASA keyword investment |
Highest-value conversion keywords |
|
Subscription vs. IAP split |
Competitor's monetization model |
|
Retention curves |
Whether revenue is sustainable |
|
Ad creative longevity |
Which messaging converts paying users |
Before analyzing competitors, understand these fundamental metrics:
Primary Revenue Metrics:
Key Insight: iOS users typically generate higher ARPU (~$1.00) compared to Android users (~$0.47)
Download & Growth Metrics:
Engagement Metrics:
Stop switching tools. Track everything that matters in one dashboard. Try FoxData Free →
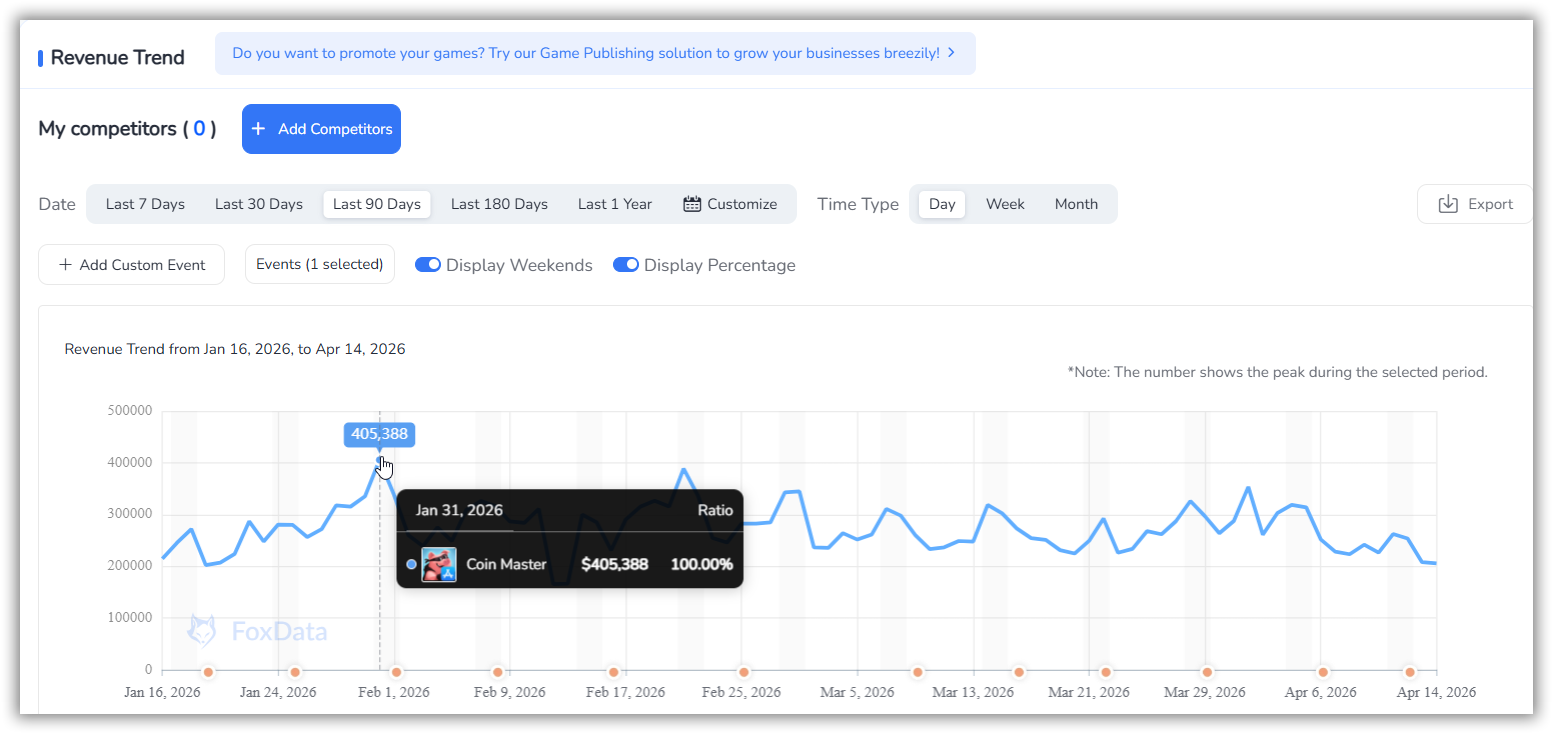
No app publicly discloses its exact revenue. However, platforms like FoxData use AI-powered modeling to generate download and revenue estimates for any app, benchmarked against top-app intelligence.
FoxData's Estimated Revenue enables side-by-side comparison of estimated revenue between your app and multiple competitors, broken down by country and platform.
👉 Benchmark Your App Against Competitors
Understanding how efficiently a competitor converts downloads into revenue is as important as the raw revenue figure. A competitor with 500K downloads generating $5M revenue is monetizing far more effectively than one with 2M downloads generating $3M revenue.
Track:
Markets behave differently. The App Store generates higher ARPU in markets like the US, UK, and Japan. Google Play dominates volume in emerging markets. A competitor generating strong revenue in Germany but weak revenue in Southeast Asia signals a deliberate geographic focus — or an untapped opportunity for your app.
FoxData's Global Overview visualizes app revenue and download performance across all countries via an interactive world map, letting you instantly identify where competitors are winning and where they are not.
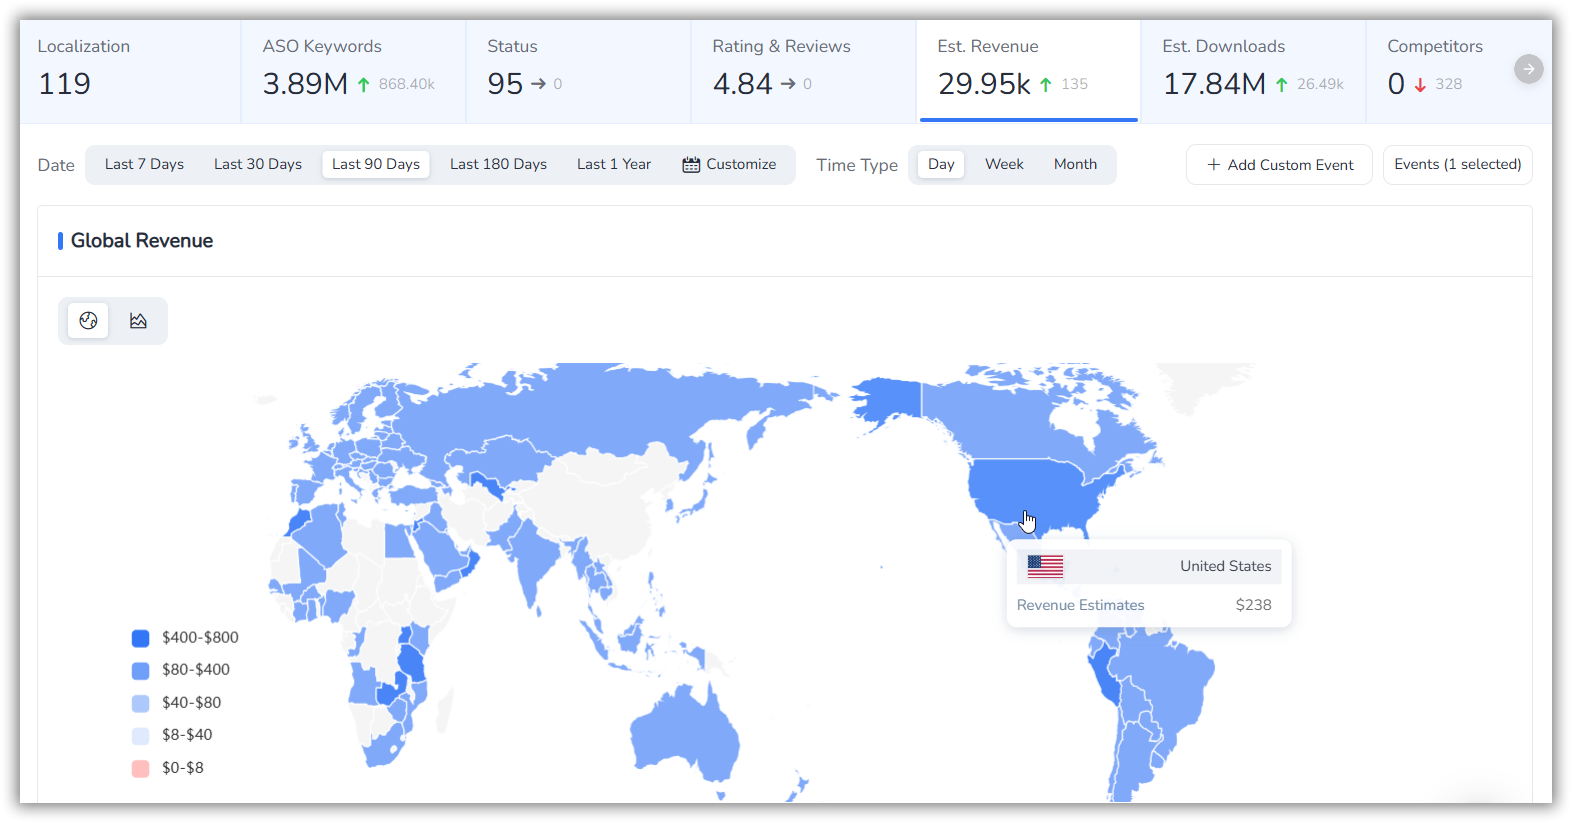
👉 See What Drives Competitor Revenue
Competitors' ASA keyword investments are one of the most reliable proxies for revenue-driving keywords. If a competitor bids heavily on a term and sustains that investment over weeks, they have conversion data proving it works. This makes paid keyword intelligence a critical input for revenue analysis.
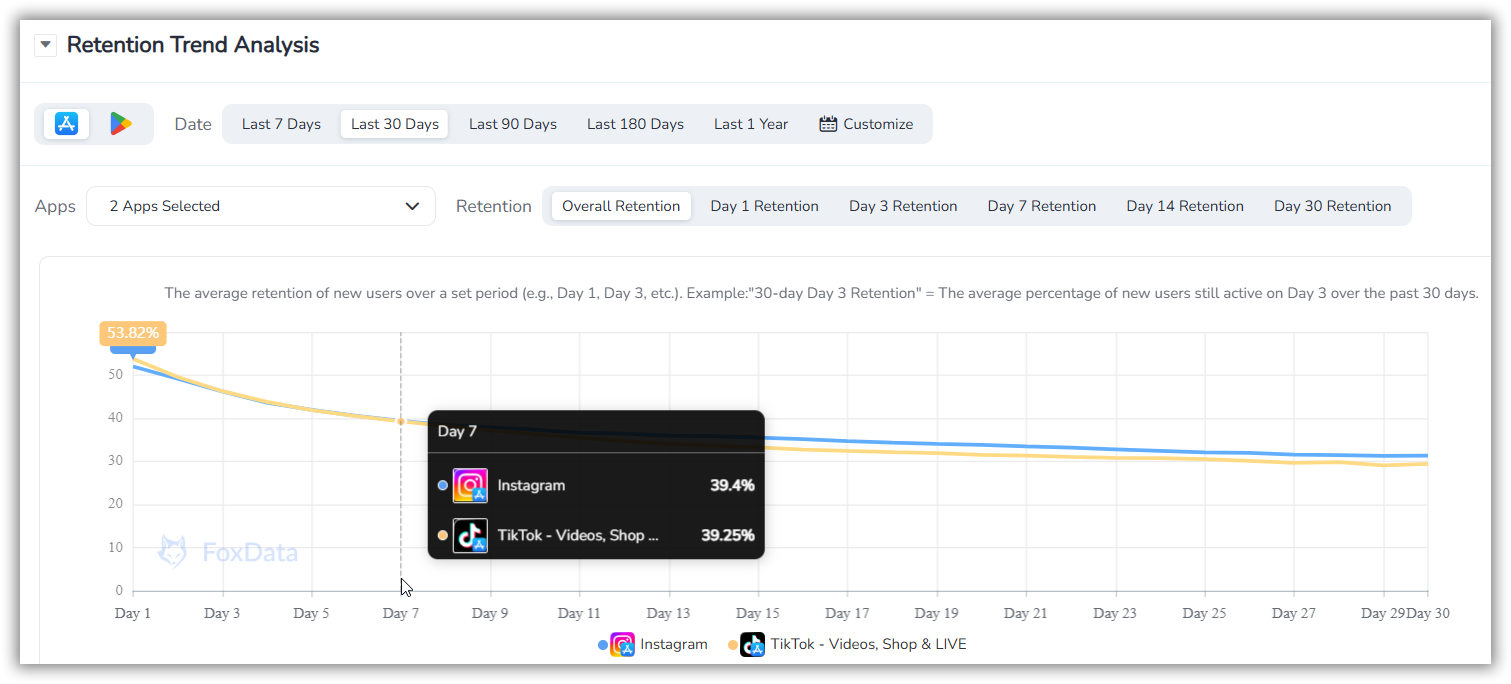
High revenue without strong retention signals a declining business. FoxData enables you to compare active users, retention rates, and engagement trends against competitors across key markets and platforms.
See which apps are growing sustainably — and which are losing users. Track retention trends, identify what drives engagement, and understand how retention impacts revenue over time.
Curious about your competitors' revenue drivers?
👉 Register for a Free FoxData Account and Benchmark Your App
Your revenue competitors are not necessarily the most downloaded apps in your category. They are apps competing for the same high-intent, high-LTV users.
How to identify them:
Using FoxData: The Competitor Analysis Tool lets you search by category, keyword, or app name to instantly surface competitor profiles including estimated revenue trends, download trajectories, and rating histories — all in one dashboard
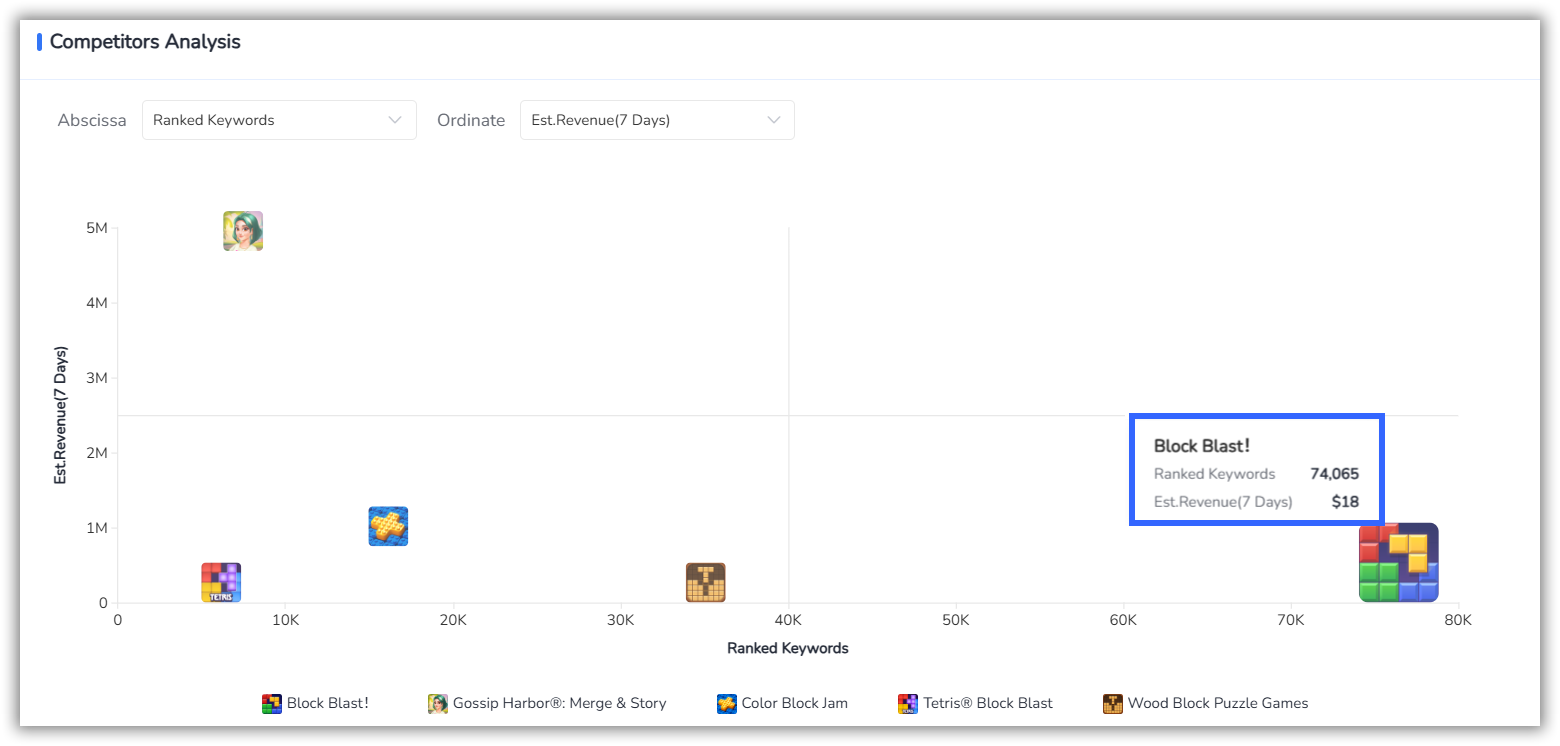
💡 Ready to map your competitive landscape?
Start Analyzing Competitors — Free →
Once you have your competitor list, gather baseline data for each app:
Data points to collect:
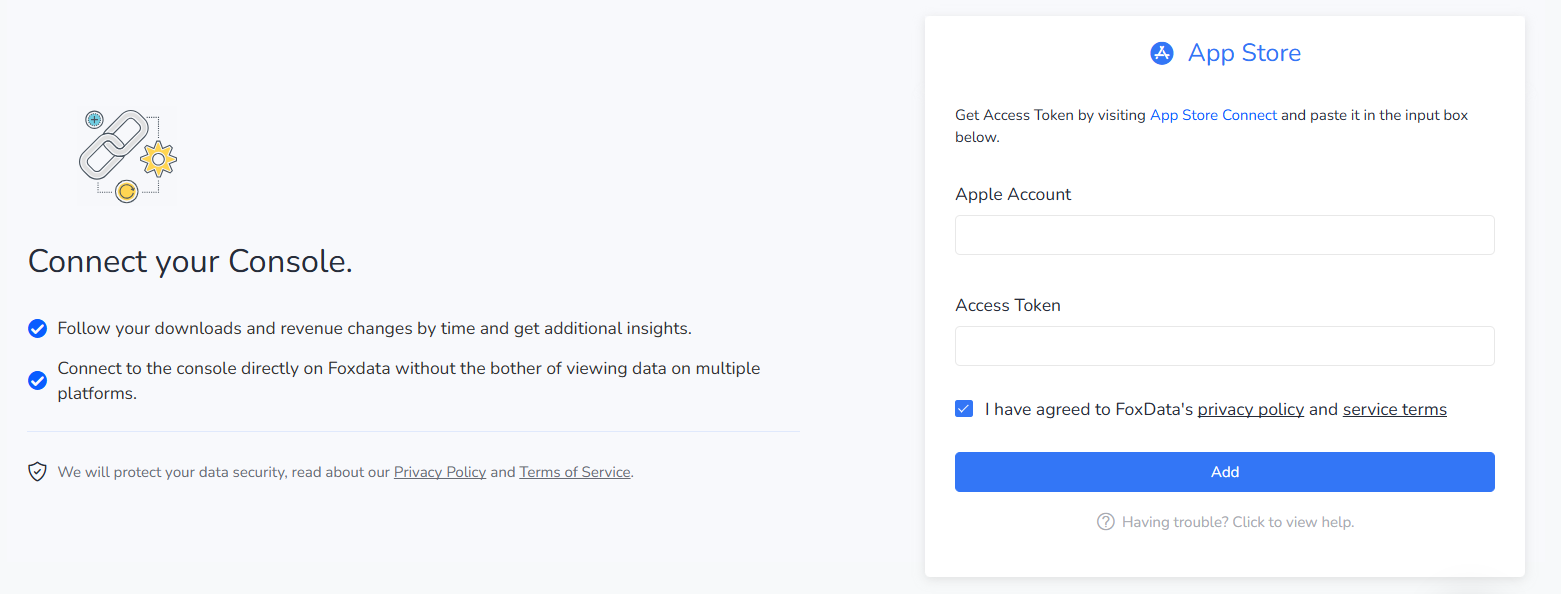
Using FoxData: The Est. Revenue Analysis and Est. Downloads Analysis features provide estimates updated in real time, with seamless integration into App Store Connect and Google Play Console for your own app's verified data alongside competitor benchmarks.
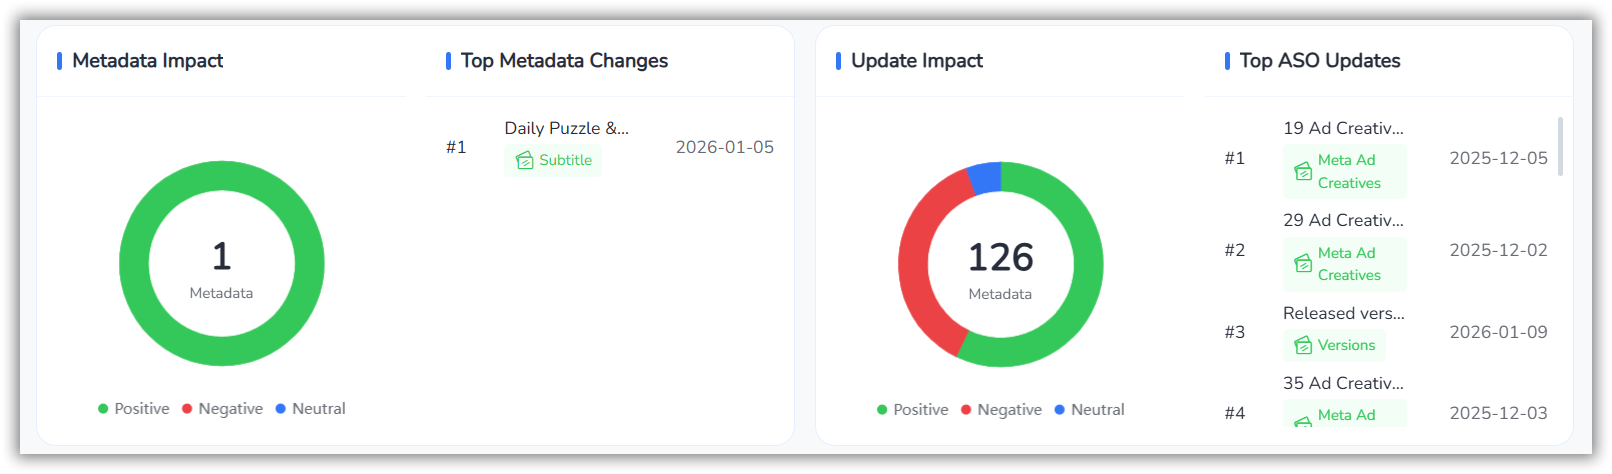
✅ Pro tip: Look for revenue spikes that correlate with version updates or seasonal events. FoxData's ASO Impact Analysis Tools overlays version history with revenue and download trends to pinpoint exactly what drove each spike.
Organic search still drives approximately 70% of app installs. Competitors ranking for high-intent keywords are generating free, high-converting traffic that directly feeds revenue.
What to analyze:
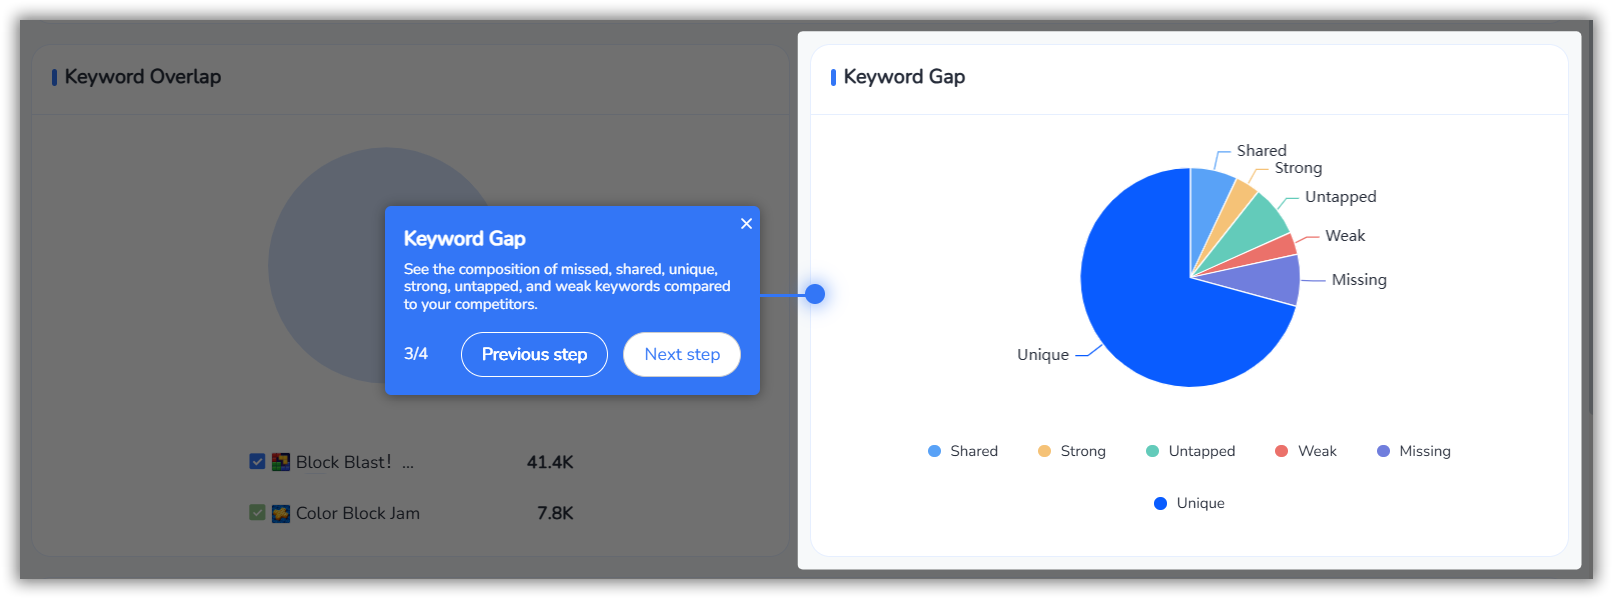
Using FoxData: The ASO Keywords module tracks 90M+ keywords in real time, with competitor benchmark analysis showing shared versus unique keywords, difficulty scores, and estimated traffic potential across 10+ evaluation metrics.
Where competitors spend on Apple Ads (formerly Apple Search Ads - ASA) reveals which keywords they trust to generate revenue — not just installs.
Key questions to answer:
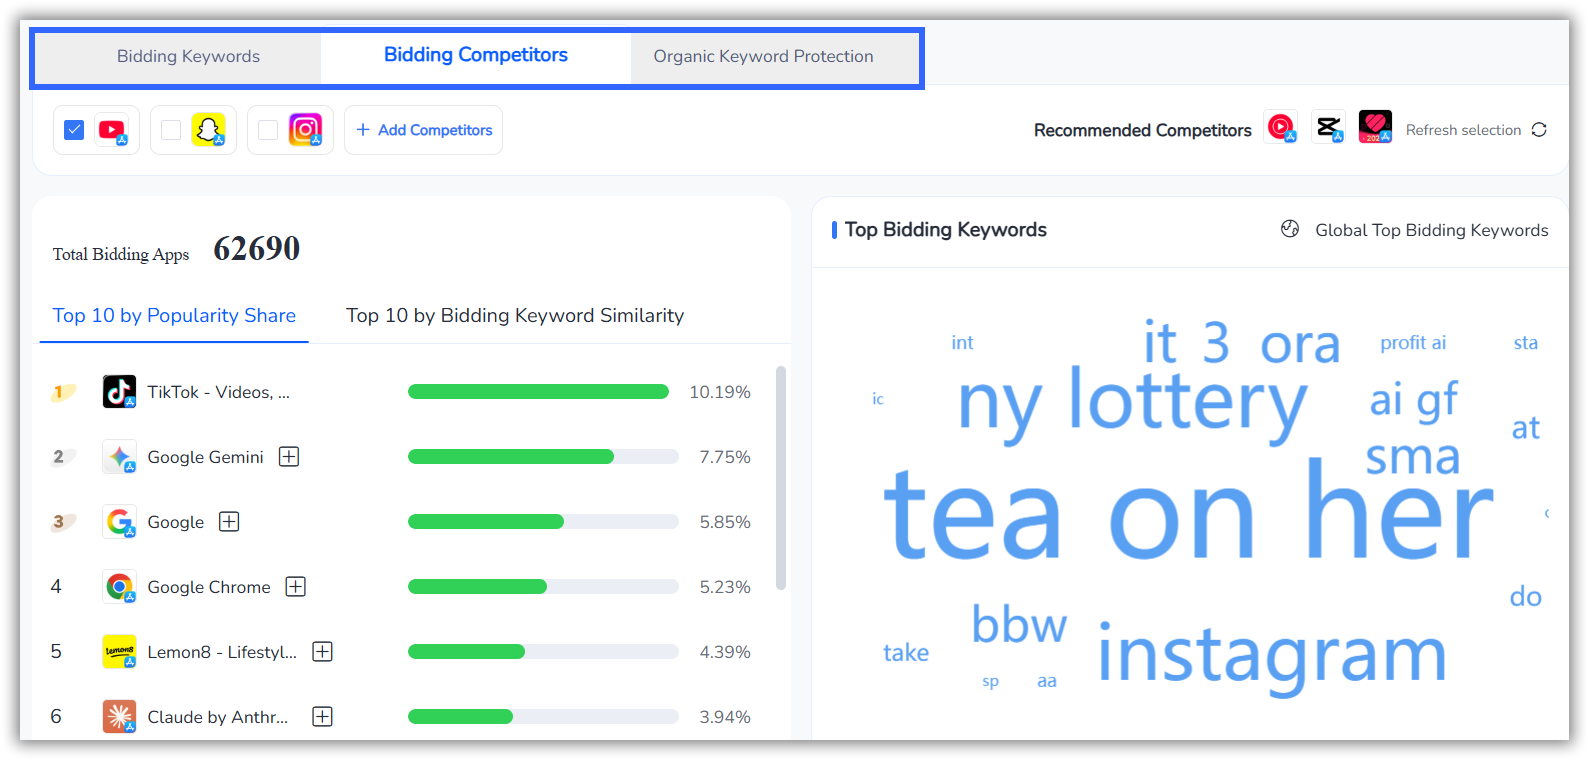
Using FoxData: ASA Intelligence helps you track competitor bids, find high-performing keywords, and align CPP with search intent — all in one place.
👉 Discover Winning Apple Ads Strategies
💡 Insight: Apple Ads keyword bidding data is one of the most reliable indicators of revenue-driving keywords, because competitors only sustain bids on terms that convert profitably. A keyword with sustained competitor bidding over 4+ weeks is a high-confidence signal that it drives paying users, not just installs.
Revenue figures without retention context can be misleading. A competitor generating $2M/month from rapidly churning users is far less strategically threatening than one generating $1M/month from loyal, high-LTV subscribers.
Retention signals to monitor:
Ad creatives reveal how competitors position their monetization offer. The messaging, visuals, and value propositions used in ads tell you what is resonating with paying users.
What to analyze:
Consolidating all competitor revenue signals into a single, comprehensive dashboard is crucial for tracking performance and quickly identifying opportunities.
Track monthly:
Ready to build your own revenue intelligence dashboard?
👉 Subscribe to FoxData for Advanced Analytics!
Choosing the right tool is crucial. Here is a comprehensive comparison of the leading platforms in 2026:
|
Tool |
Key Strength |
Est. Revenue |
Free Tier |
Best For |
|
FoxData |
Affordable All-in-One: Strongest integration of ASO and ASA intelligence for budget-conscious teams |
Yes |
Yes, 7-day free trial & basic free plan |
Versatile and budget-friendly; suitable for all (Indie devs to Enterprises) at a highly competitive price |
|
AppTweak |
AI-Driven ASO & AI Visibility: Industry leader in tracking how apps rank in AI chatbots and AI-powered store recommendations |
Yes |
Yes, 7-day free trial & limited free estimates |
ASO Experts & Agencies focused on the new frontier of AI-driven app discovery |
|
MobileAction |
ASA Automation & Optimization: Unmatched keyword intelligence specifically for ASA via SearchAds.com |
Yes |
Yes, 7-day free trial & basic tools |
UA Managers with significant spend on ASA |
|
Sensor Tower |
Premium Market Accuracy: The "Gold Standard" for enterprise data, covering mobile, web, and ads with massive global panels |
Yes |
Yes, limited free account availbale |
Enterprises requiring high-precision market-wide data |
|
AppMagic |
Niche & Sub-genre Research: Best-in-class for identifying trending app categories and sub-genres |
Yes |
Yes, limited free access to top charts |
Game Publishers looking for the next big market opportunity |
|
Appfigures |
Developer Data Integration: Seamlessly combines your own sales/download data with competitor market intelligence |
Yes |
Yes, free with Starter plan |
Indie Devs & Product Teams who want to see their own data and competitors |
|
Adjust |
Measurement & Attribution: The leading MMP for tracking the entire user journey and fraud prevention |
Yes, but tracks your own revenue only |
No, enterprise-only pricing. |
Performance Marketers focused on cross-channel attribution and scaling paid UA |
FoxData offers a comprehensive suite of tools designed for modern app growth, combining everything you need in one platform:
FoxData serves a broad range of mobile app professionals across all growth stages:
|
User Type |
Primary Use Case |
|
ASO Specialists |
Keyword gap analysis, competitor metadata tracking, rank monitoring |
|
UA Managers |
ASA keyword intelligence, competitor bidding analysis, CPP tracking |
|
Mobile Game Publishers |
Revenue benchmarking, market segmentation, ad creative analysis |
|
Indie Developers |
Free ASO tools, keyword discovery, basic competitor research |
|
ASO/ASA Agencies |
Multi-client competitive intelligence, white-label reporting |
|
Investors & Analysts |
Revenue trend tracking, market sizing, portfolio benchmarking |
|
Enterprise App Teams |
Full-platform intelligence, API access, BI tool integration |
🚀 Ready to see the difference?
Join 10,000+ app developers, marketers, and publishers using FoxData to turn competitor intelligence into revenue growth.
→ Start Your Free Trial or Book a Demo to see FoxData's full platform in action.
Effective competitor analysis is not a one-time event but an ongoing process. Consistent monitoring ensures you stay ahead of market shifts and competitor moves.
|
Frequency |
Activity |
|
Weekly |
Check for competitor metadata updates, major ranking shifts, new ASA keyword appearances |
|
Monthly |
Full revenue estimate refresh, keyword gap analysis, creative performance review |
|
Quarterly |
Strategic repositioning assessment, new market opportunity identification, localization audit |
If competitors are generating revenue in markets where you have not localized, that is a directly quantifiable growth opportunity. Analyze competitor localized keyword strategies — not just their English listings — to identify markets where you can enter with lower competition and higher conversion potential.
Monitor whether estimated revenue changes in the 2–4 weeks following a major competitor update. This reveals which product investments genuinely drive monetization and which do not.
Beyond individual competitor tracking, continuously monitor your entire category for structural shifts. This includes comparing App Store vs. Google Play revenue globally, tracking market size and growth trends, decoding strategies of top publishers, and identifying market volatility through dynamic dashboards.
Even with the right tools, certain pitfalls can undermine your competitor analysis efforts.
Revenue estimates are directional, not precise. Use them to identify trends, relative performance, and order-of-magnitude comparisons — not to make financial forecasts. A 20% directional movement is meaningful; a 2% difference is not.
Category leaders often borrow monetization strategies from adjacent verticals. A subscription fitness app can learn as much from a subscription meditation app's revenue model as from another fitness app.
Competitor revenue strategy shifts constantly. Metadata updates, new ASA campaigns, and pricing changes happen every few weeks. A static report becomes stale within a month.
High revenue without retention is a declining business. Always pair revenue estimates with retention signals — DAU/MAU ratios, review sentiment trends, and update frequency.
High rankings do not always mean high revenue. Pair ranking data with conversion signals — ratings, creative quality, review themes — to understand whether visibility is translating into paying users.
If your competitor is generating significant revenue in a market where you have not localized, you are ceding ground. Always analyze localized keyword strategies, not just English listings.
Stitching together data from five different sources introduces inconsistency, lag, and reconciliation overhead. Consolidate mobile market data through a single platform covering downloads, revenue, keywords, ratings, and category rankings.
A: No app publicly discloses its exact revenue. Tools like FoxData provide estimated revenue based on data such as downloads, conversion rates, and market benchmarks. These estimates are crucial for trend and competitor analysis, offering directional insights rather than precise financial statements.
A: A minimum of monthly analysis is recommended. For highly competitive categories (e.g., fintech, casual gaming, health & fitness), a bi-weekly review is more appropriate. Major algorithm updates or sudden drops in your own rankings should trigger an immediate competitive audit.
A: Key metrics for monetization benchmarking include ARPU (Average Revenue Per User), ARPDAU (Average Revenue Per Daily Active User), conversion rate, and the revenue mix (e.g., subscriptions vs. in-app purchases vs. ads).
A: FoxData offers a free plan with basic competitor analysis features, including keyword tracking and app performance insights. For more advanced competitor intelligence, paid plans unlock deeper ASO and market data.
A: Yes, FoxData is designed to support a wide range of users, from indie developers to enterprise teams. It offers scalable solutions for various needs, including app analytics, ASO insights, and competitor tracking.
The mobile app market in 2026 demands a data-driven approach to growth. With downloads plateauing and revenue continuing to climb, success hinges not on acquiring the most users, but on precisely understanding the competitive landscape. Competitor app revenue analysis is no longer optional; it is a fundamental requirement for any app team serious about sustainable growth.
The apps that will thrive in 2026 are those with the clearest view of the battlefield and the right tools to act on what they see. Equip yourself with the insights needed to outmaneuver your rivals and secure your app's place among the market leaders.
Don't get left behind. Start your journey to data-driven app growth today!
➡️ Unlock Your App's Full Potential with FoxData - Get Started Now!
© 2020-2026 FoxData. All Rights Reserved.
