


Explore More Possibilities for Your Business
Full-cycle scenario construction to meet your needs from App research, development, and release to operation.
Ready for your soaring growth

As competition intensifies in the mobile app market, App Store Optimization (ASO) has entered an era of strategy-driven growth. Increasing visibility and downloads is no longer about simple keyword ranking—it now relies on end-to-end data tracking, intelligent analytics, and continuous optimization.
Among leading ASO platforms, FoxData and Mobile Action stand out as two tool platforms that attract more attentionin the industry. FoxData is known for its real-time monitoring and integrated insights, while Mobile Action is praised for its structured datasets and broad market coverage.
This article follows the complete ASO lifecycle to compare both tools—from feature depth and user experience to pricing and value—helping you identify which platform’s workflow best supports your growth strategy.
From a practical user perspective, an end-to-end ASO process typically involves five key stages:
Following this structure, we will systematically evaluate Mobile Action and FoxData at each stage.
The goal of market research is to understand competitive dynamics and capture potential growth opportunities by analyzing trends and visual reports.
Both tools provide robust analytical capabilities, yet they differ significantly in data visualization logic, metric interactivity, and user experience.
|
Feature |
Mobile Action |
FoxData |
Key Differences |
|
Market data reports |
✅ |
✅ |
Mobile Action focuses on structured reports and benchmark comparisons, such as trend curves and visibility scores. FoxData adopts modular dynamic charts that integrate keyword distribution and download trends. |
|
Historical data range |
6–12 months |
12–24+ months |
FoxData allows deeper historical backtesting suitable for mid- to long-term market trend validation. |
|
Download & revenue analytics |
✅ |
✅ |
Mobile Action emphasizes single-metric depth; FoxData enables richer cross-metric interaction (downloads–MAU–revenue). |
|
Market heat monitoring |
✅ |
✅ |
FoxData supports the simultaneous overlay of keyword popularity and competitor |
Mobile Action: Structured Trend Dashboards
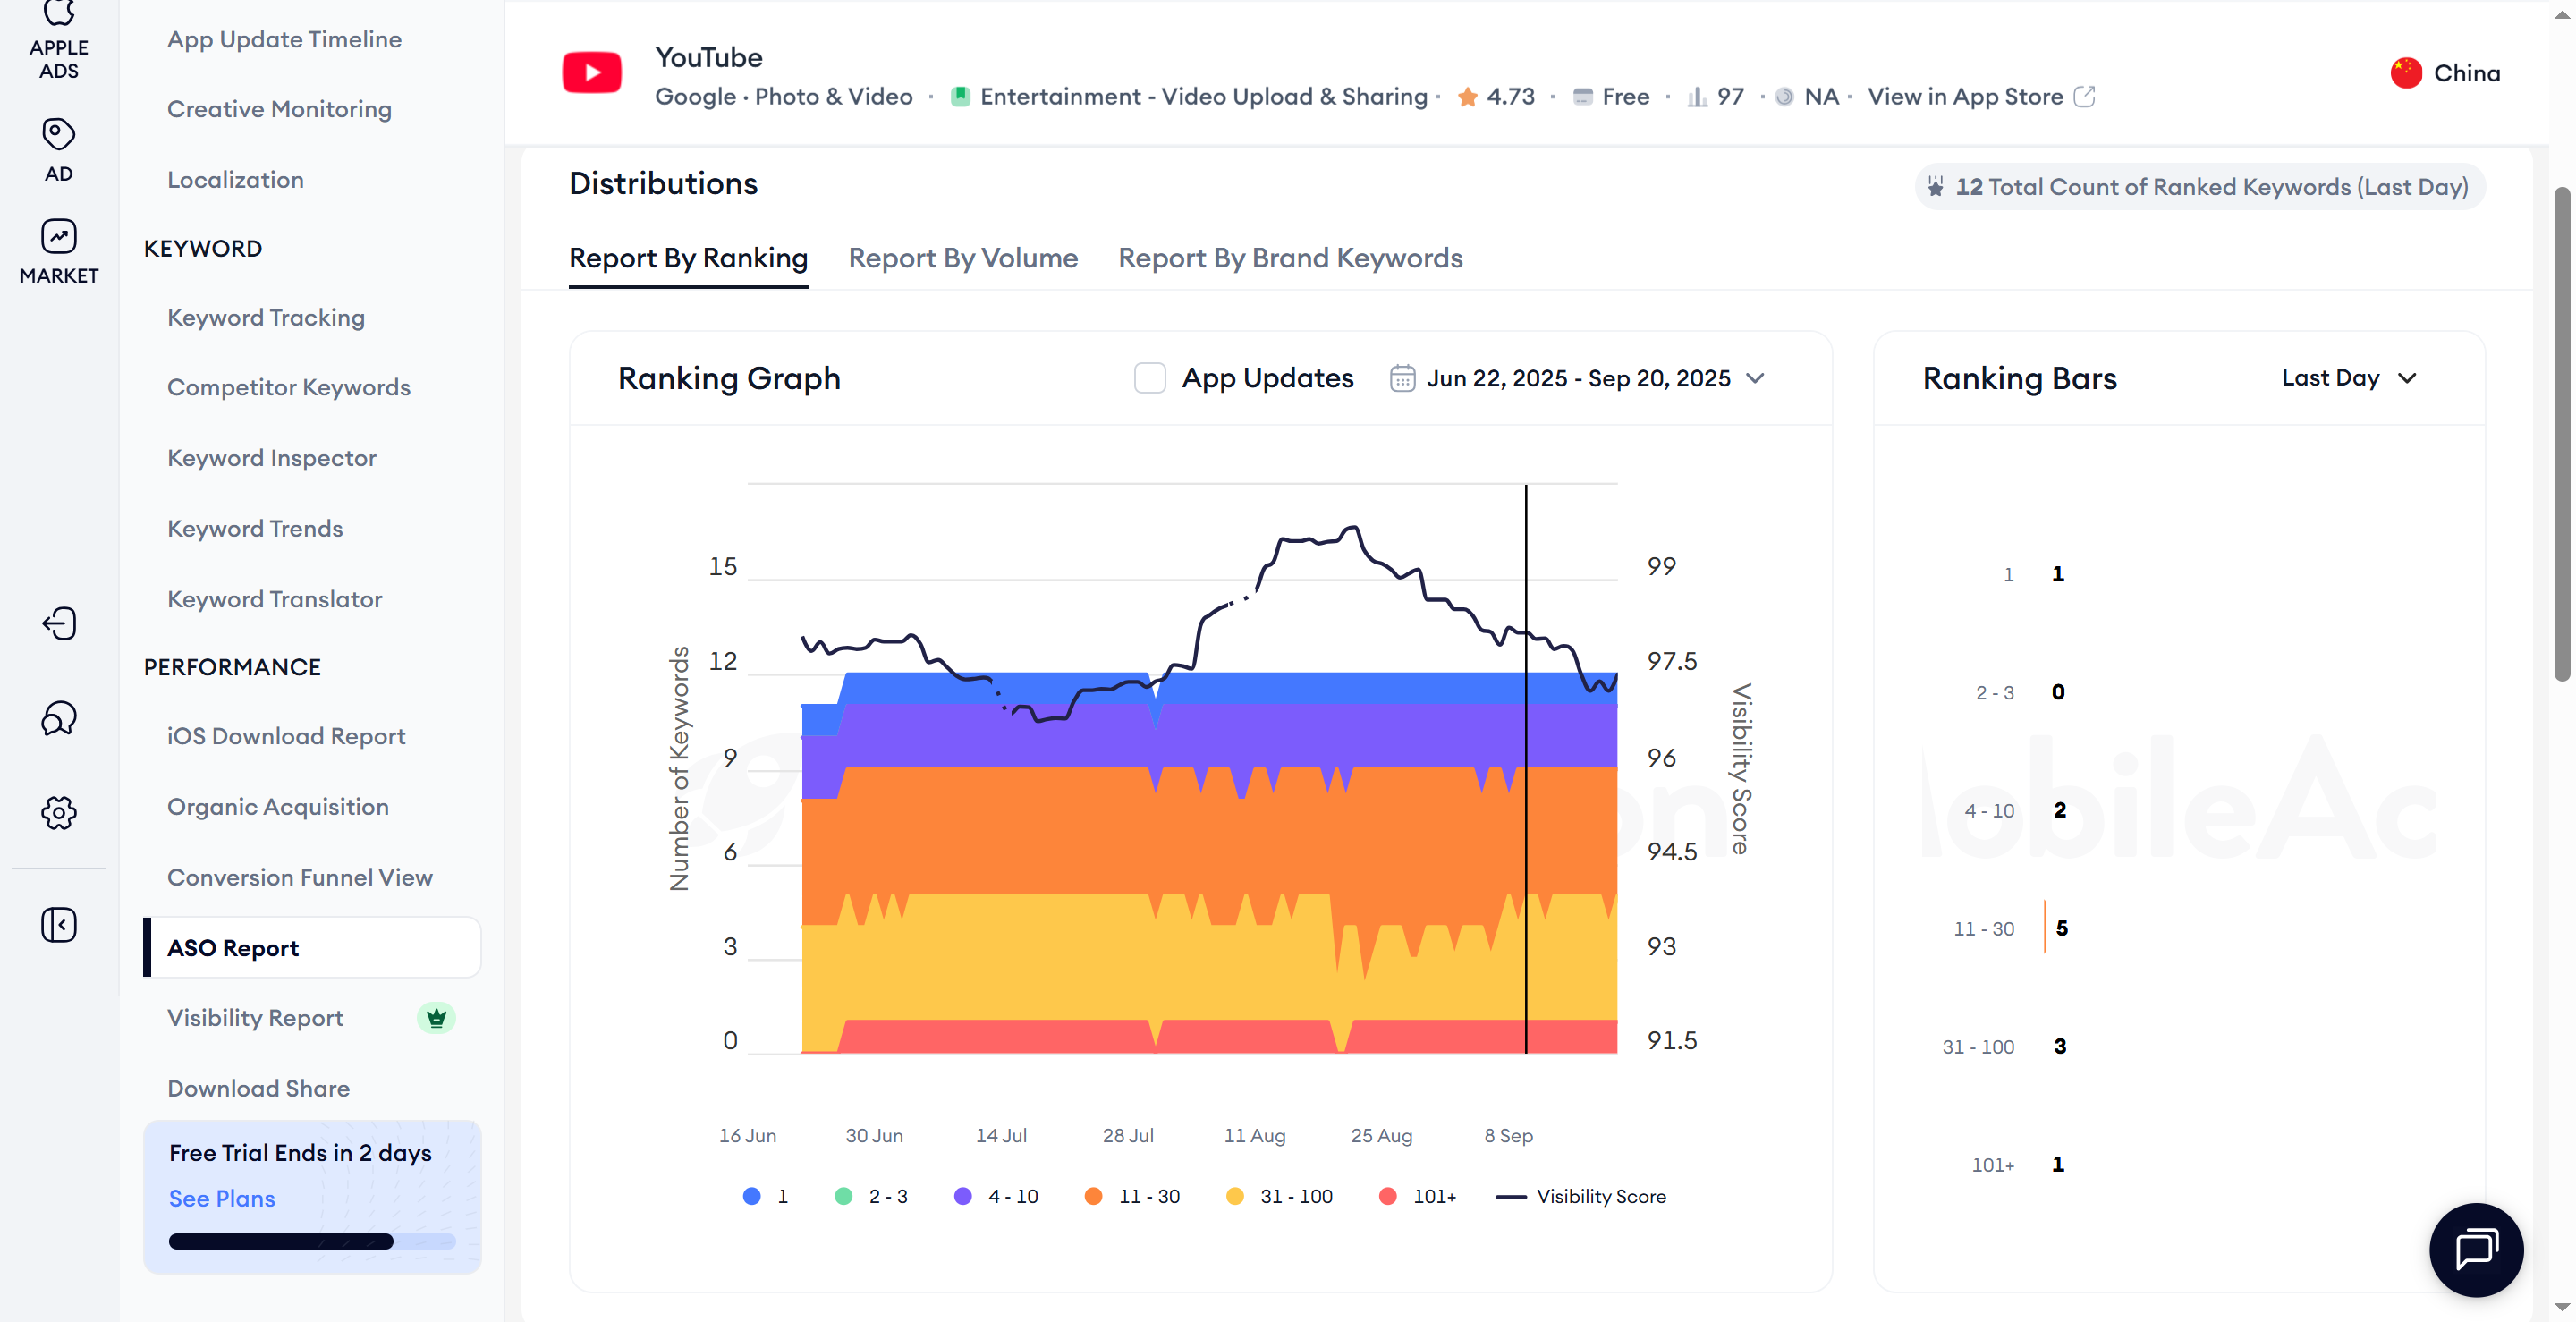
As shown in the report interface, Mobile Action’s ASO panel displays keyword ranking distributions, visibility score curves, and version update markers—ideal for those conducting periodic performance reviews and comparative analyses. Its structured report format provides strong visual clarity for stakeholders.
FoxData: Multi-Layer Dynamic Data Mapping
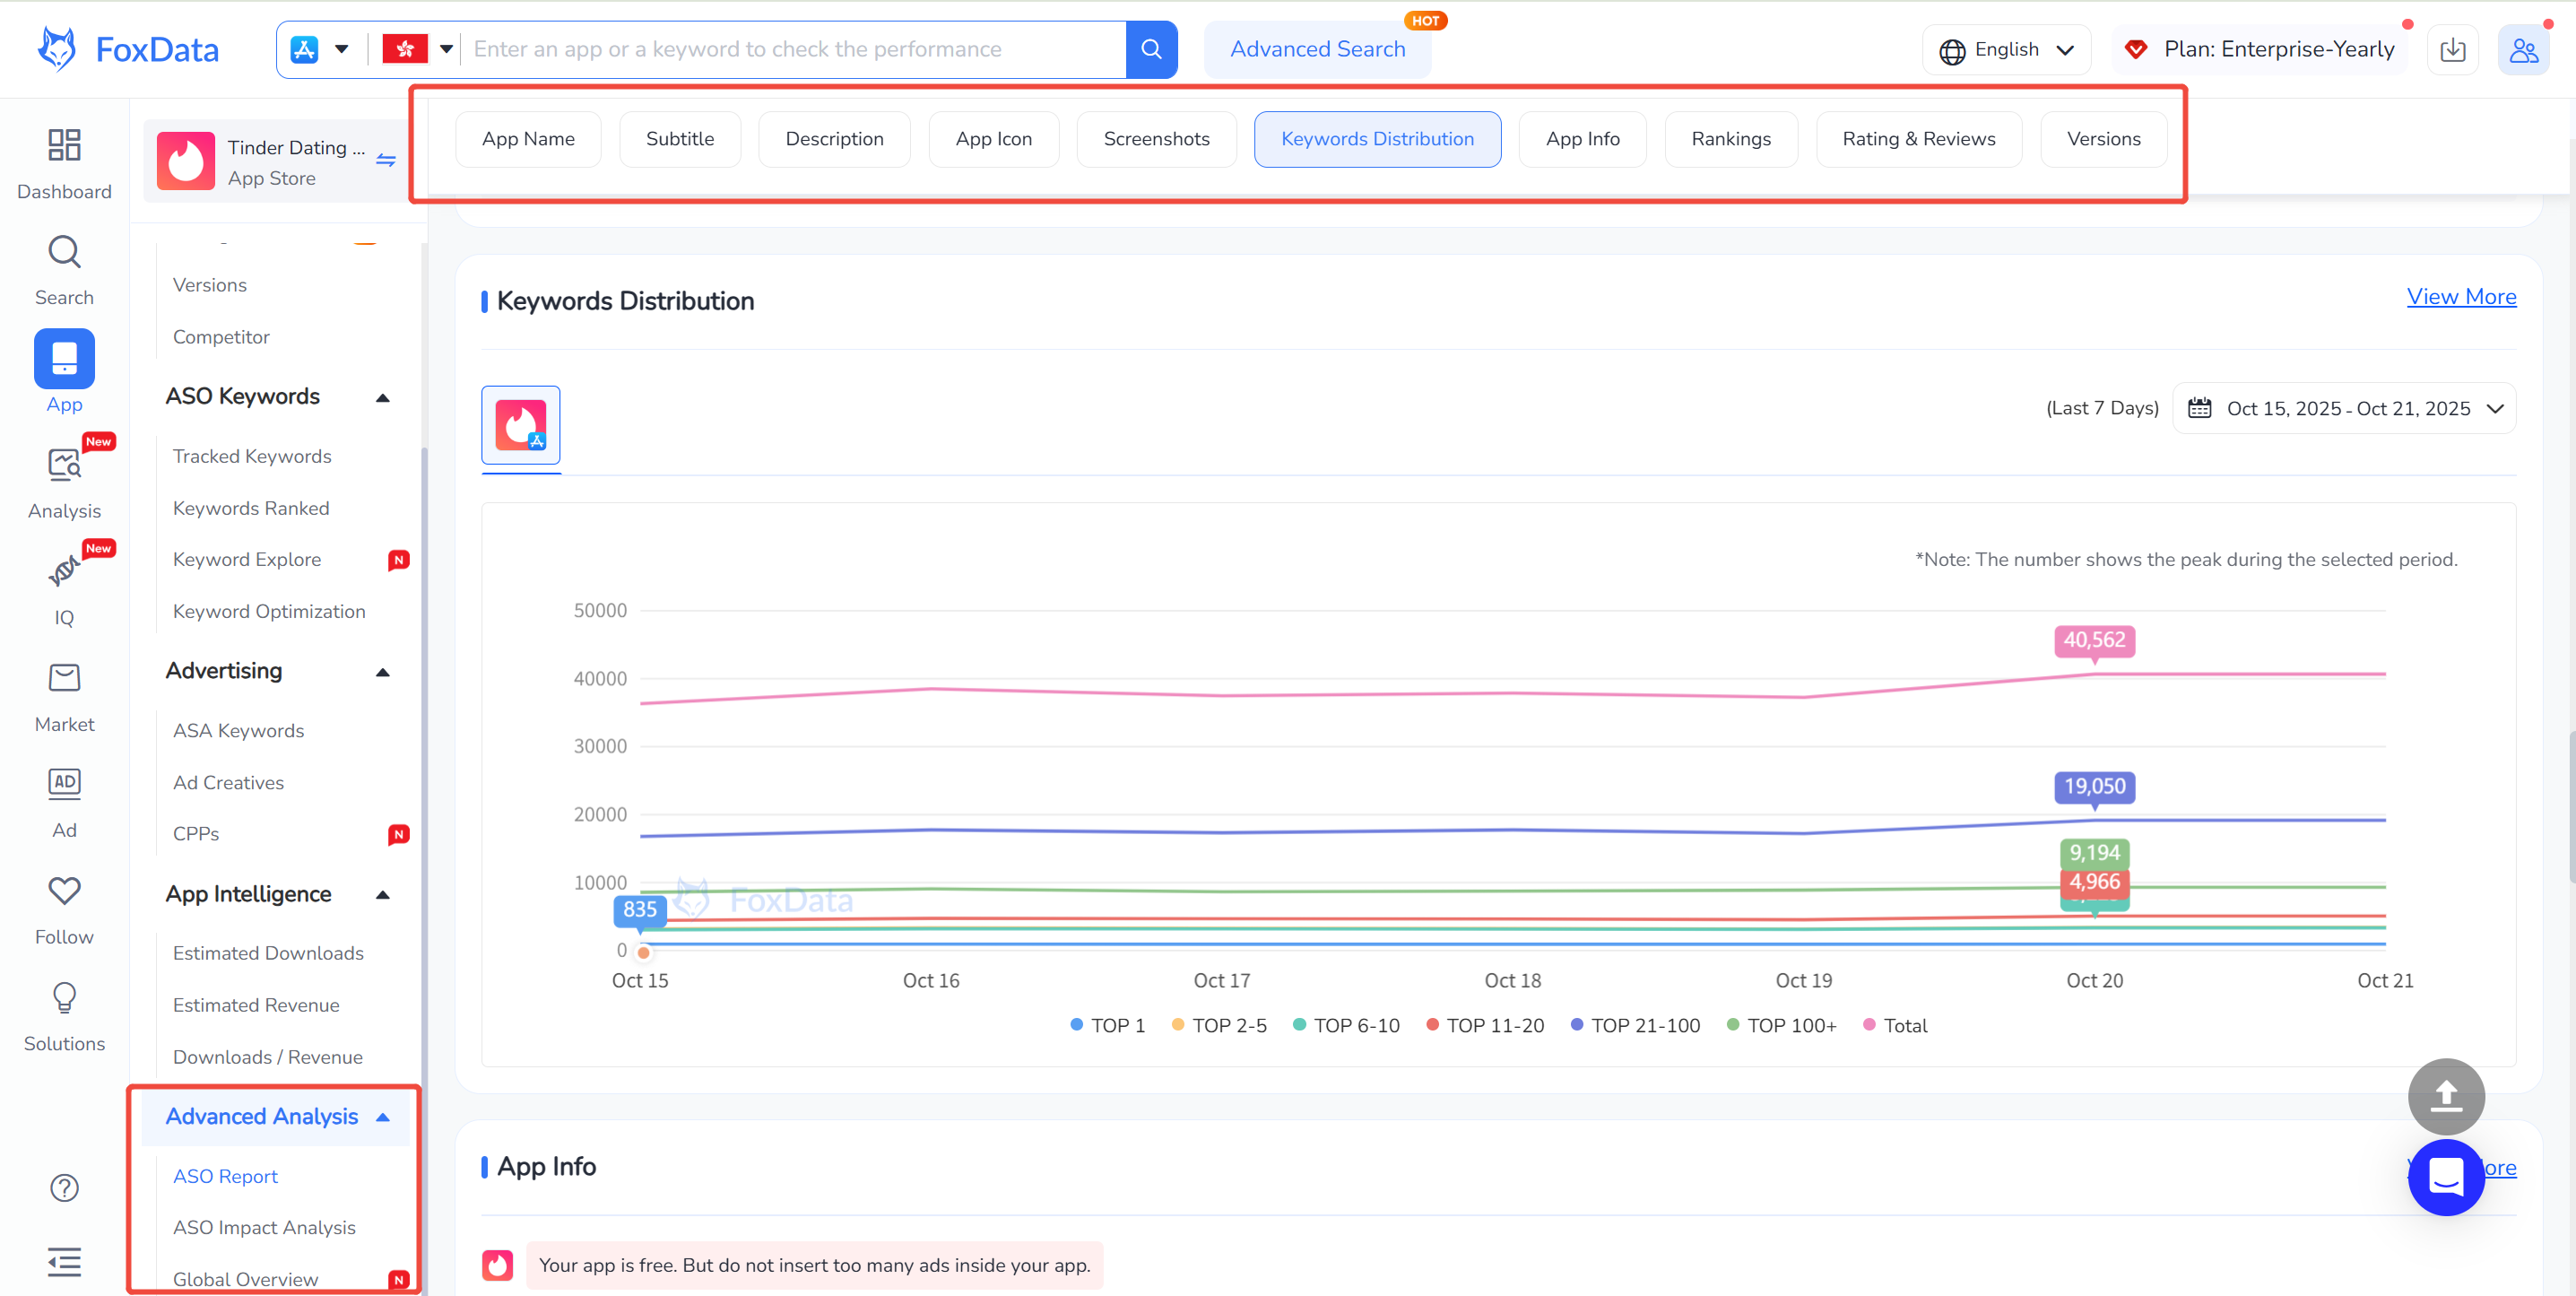
In FoxData’s “Advanced Analysis > ASO Report,” multiple dashboards—Keyword Distribution, Versions, App Info, Rating & Revenue—are seamlessly integrated.
Key highlights include:
Mobile Action stands out for structured readability and consistent reporting, making it excellent for scheduled market summaries.
FoxData, through interactive visualization, offers a continuous feedback loop, turning static reports into dynamic, insight-driven analytics.
Keyword research lies at the heart of App Store Optimization (ASO).
By discovering, tracking, and evaluating keywords, teams can gauge market trends, assess competitiveness, and refine metadata for sustained performance.
While Mobile Action and FoxData share similar logic, they diverge in tracking depth, refresh speed, semantic analysis, and interactivity.
|
Metric |
Mobile Action |
FoxData |
Key Differences |
|
Trackable keywords |
500–1500 |
1000–10000 |
FoxData supports a much larger keyword library, ideal for regional and long-tail strategy testing. |
|
Historical trend range |
3–12 months |
Unlimited |
FoxData preserves full keyword histories for longitudinal and time-series research. |
|
Data refresh frequency |
Daily |
Near real-time |
FoxData updates faster, enabling immediate reaction to keyword market changes. |
|
AI keyword expansion |
✅ |
✅ (Semantic-clustering algorithm) |
FoxData’s semantic algorithm identifies related phrases and sub-themes, expanding keyword coverage. |
|
Keyword difficulty and potential scoring |
✅ |
✅ |
Both platforms evaluate visibility using search volume, competitiveness, and strength factors. |
|
Multi-dimensional comparison |
✅ (Competitor view) |
✅ (Competitor + market heat overlay) |
FoxData’s keyword heat maps combine competitive tracking with market momentum to visualize growth trends. |
Mobile Action: Structured Keyword Matrix for Depth Analysis
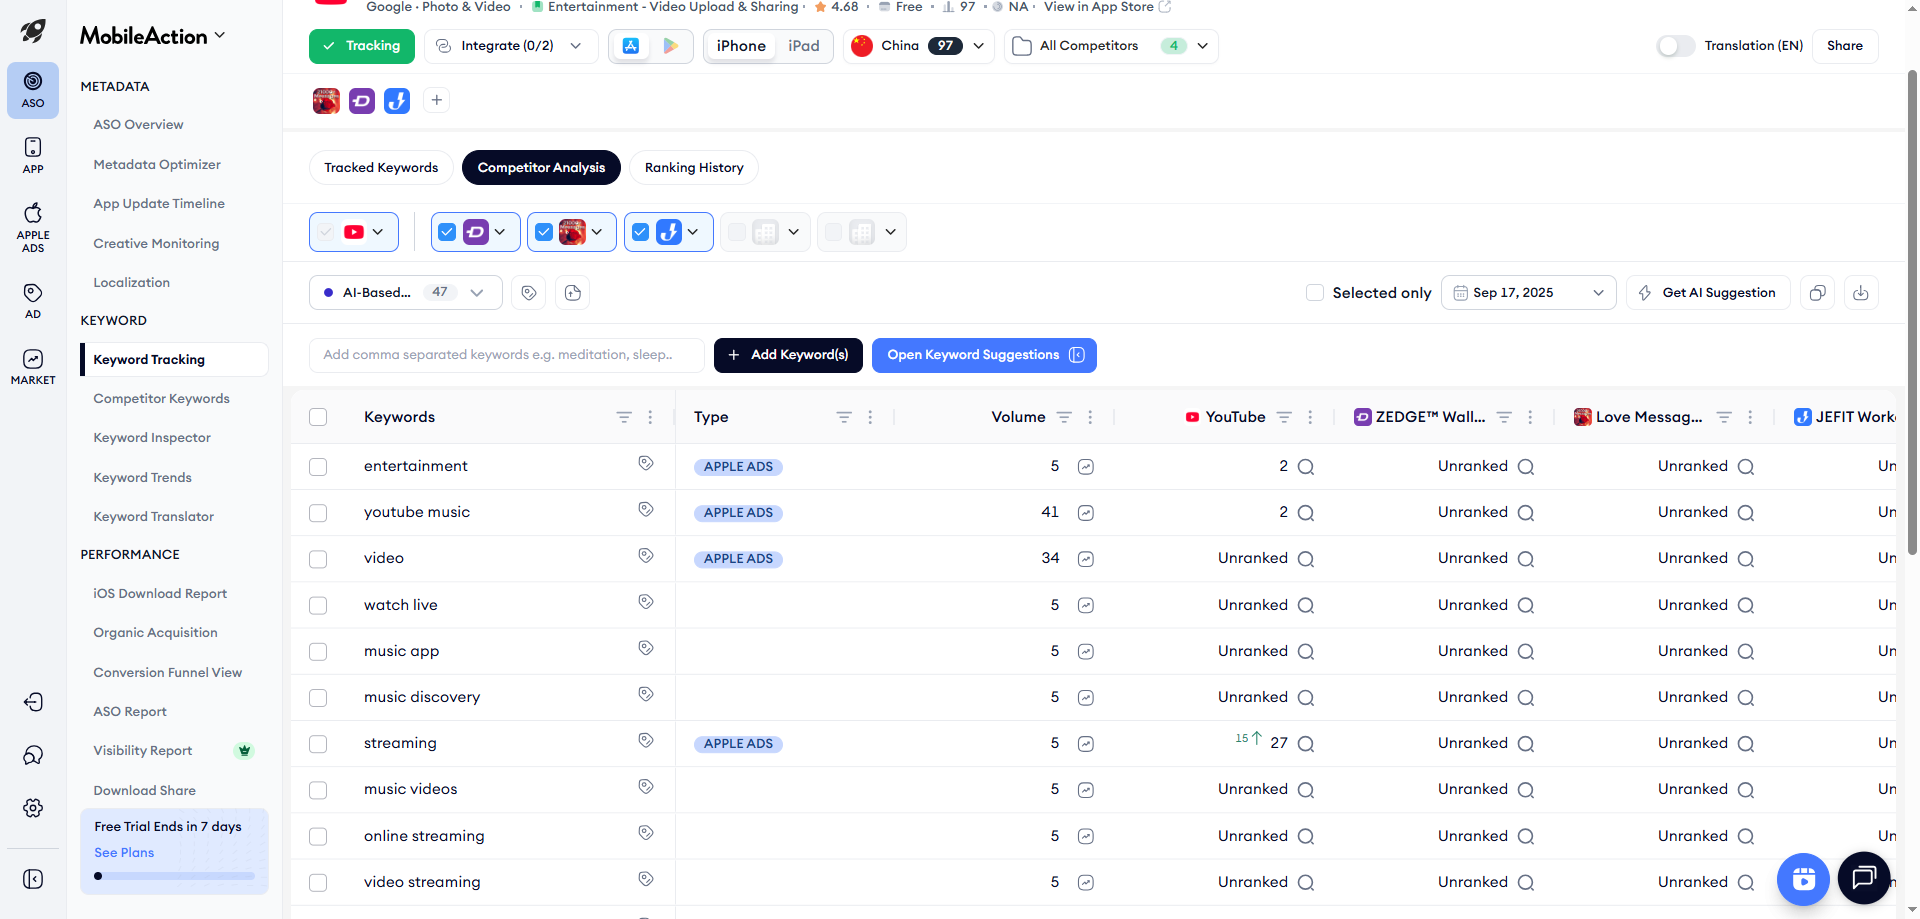
From the “Keyword Tracking” panel, Mobile Action displays keyword rankings, search volume, and side-by-side competitor performance (e.g., “entertainment,” “video streaming”).Advantages include:
FoxData: Semantics-Driven Dynamic Keyword Engine
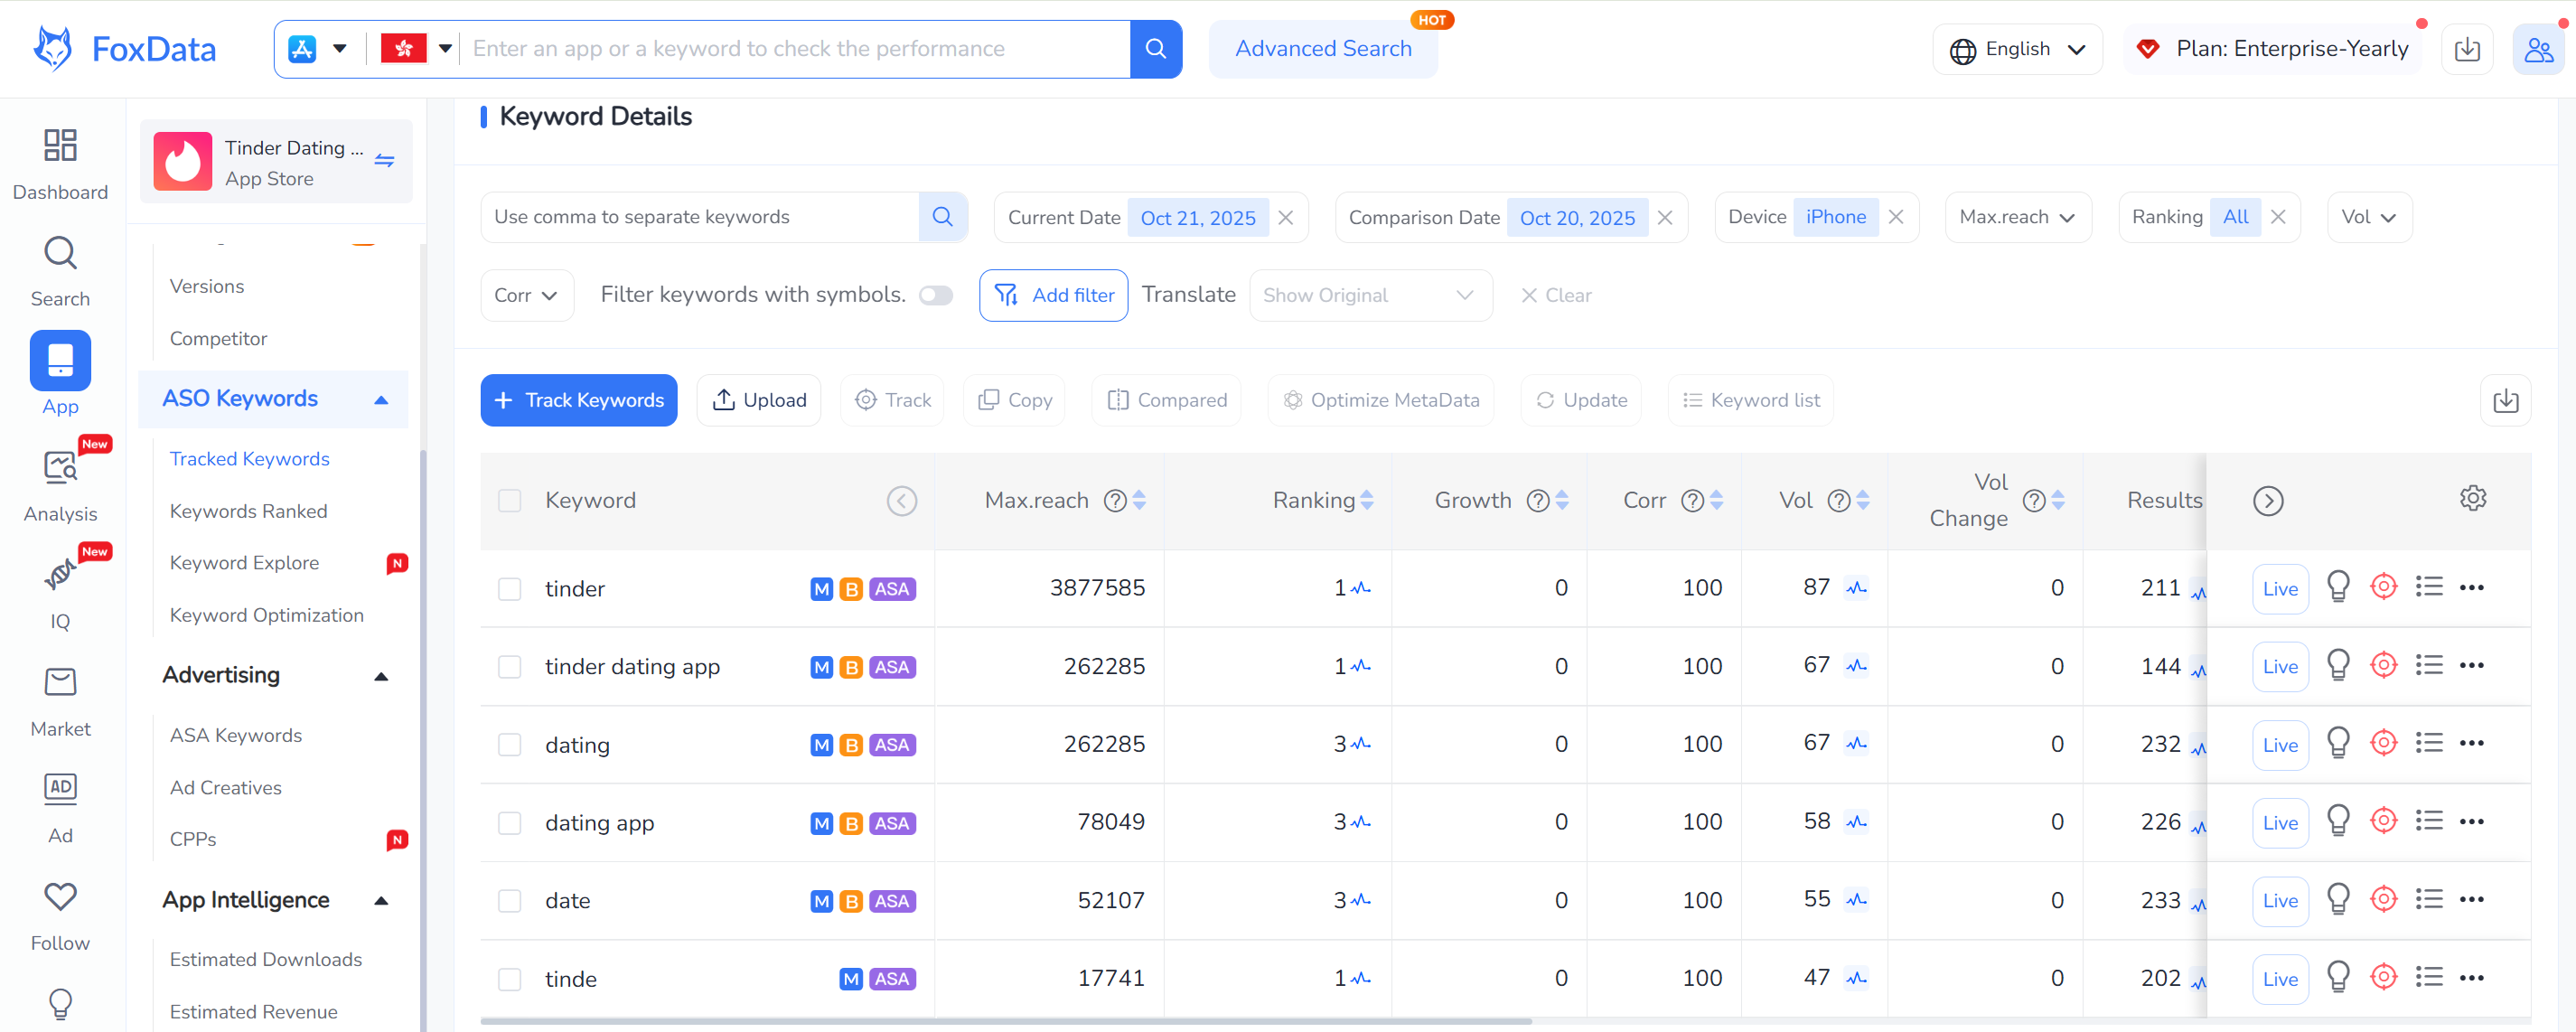
The “ASO Keywords – Keyword Details” dashboard in FoxData merges key metrics—rank, growth, correlation, and search volume—into a live-tracking interface.Distinct features:
In summary:
Mobile Action emphasizes structural depth and competitor benchmarking.
FoxData emphasizes speed, semantics, and responsiveness—turning data into an adaptive keyword optimization system.
ASO is a long-term effort demanding accurate data tracking, continuous insight generation, and iterative validation.
Both platforms deliver comprehensive evaluation frameworks, but they differ in update frequency, analytics automation, and workflow flexibility.
|
Dimension |
Mobile Action |
FoxData |
Key Differences |
|
Ranking and chart tracking |
✅ |
✅ |
FoxData refreshes more frequently and supports simultaneous monitoring across devices and versions. |
|
Ratings and reviews analytics |
✅ |
✅ |
FoxData automates sentiment detection and optimization suggestions, reducing manual review work. |
|
Download and revenue trends |
✅ |
✅ |
Both support multi-region filters; FoxData excels in custom dashboards linking downloads with revenue. |
|
Historical data span |
6–12 months |
24+ months |
FoxData offers longer-term visibility for strategy validation and trend modeling. |
|
Data export limits |
Limited quotas |
Unlimited exports |
FoxData supports direct BI integration and flexible raw-data handling. |
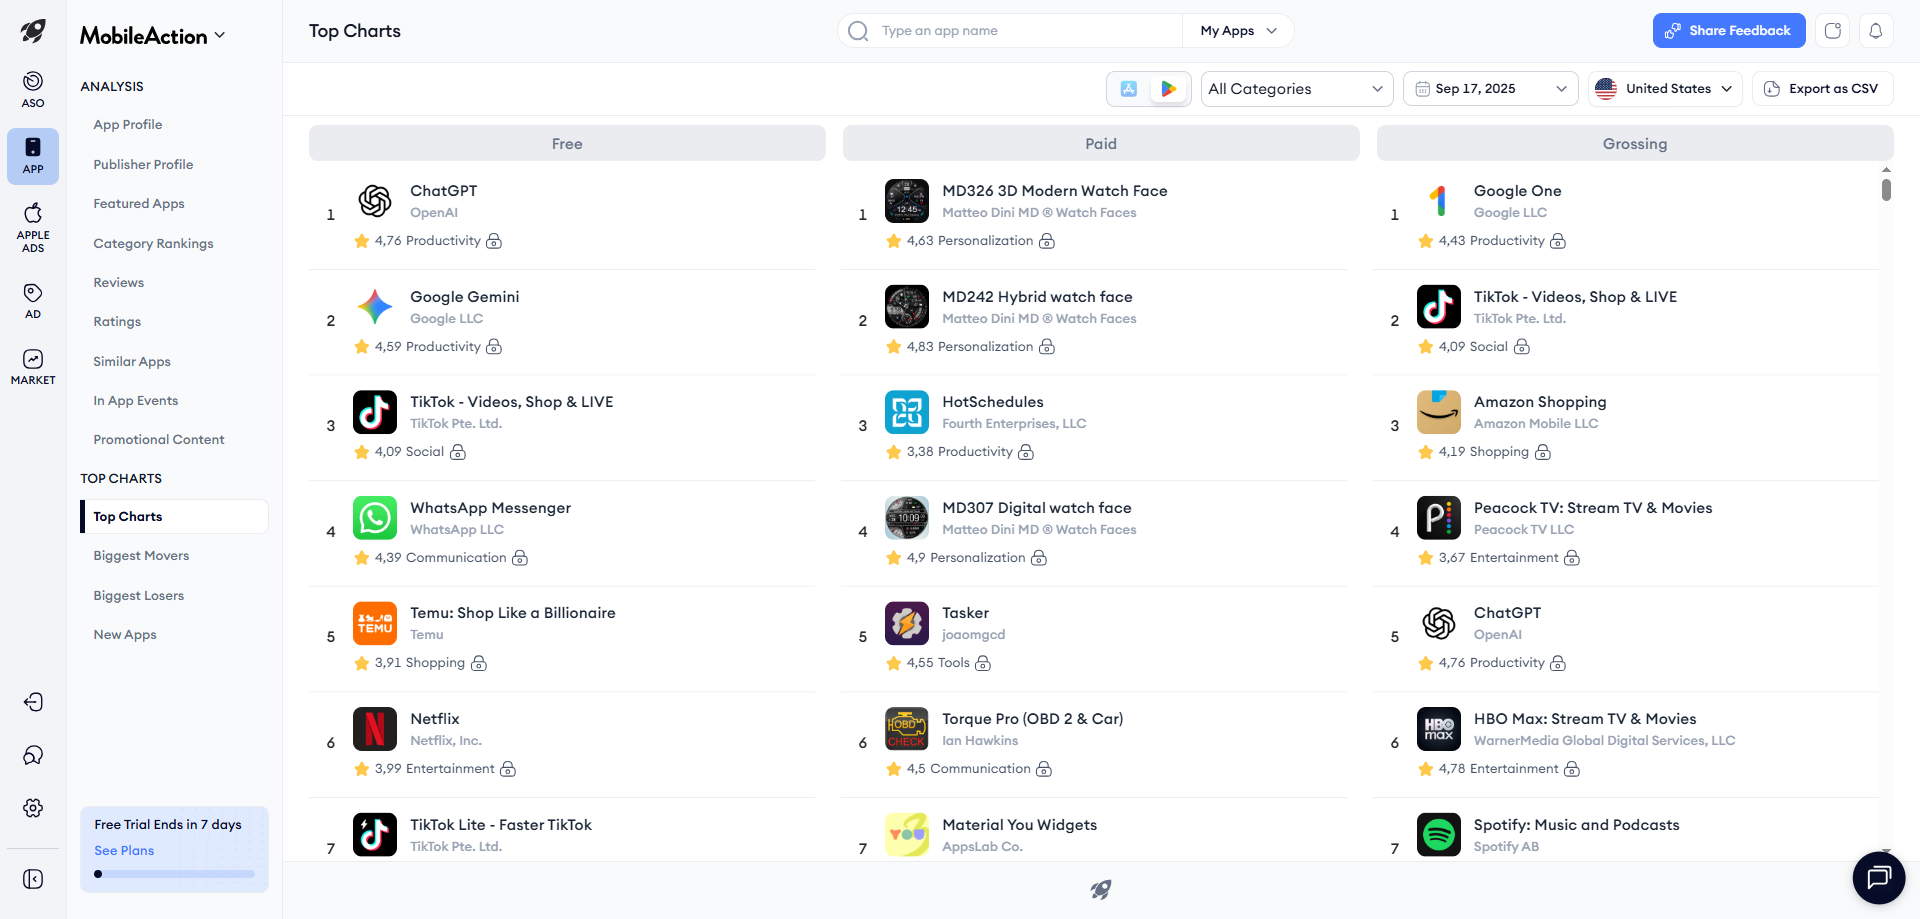
Mobile Action: Structured Dashboards & Reporting Consistency
Mobile Action’s Top Charts, Reviews, and Ratings modules highlight its systematic excellence:
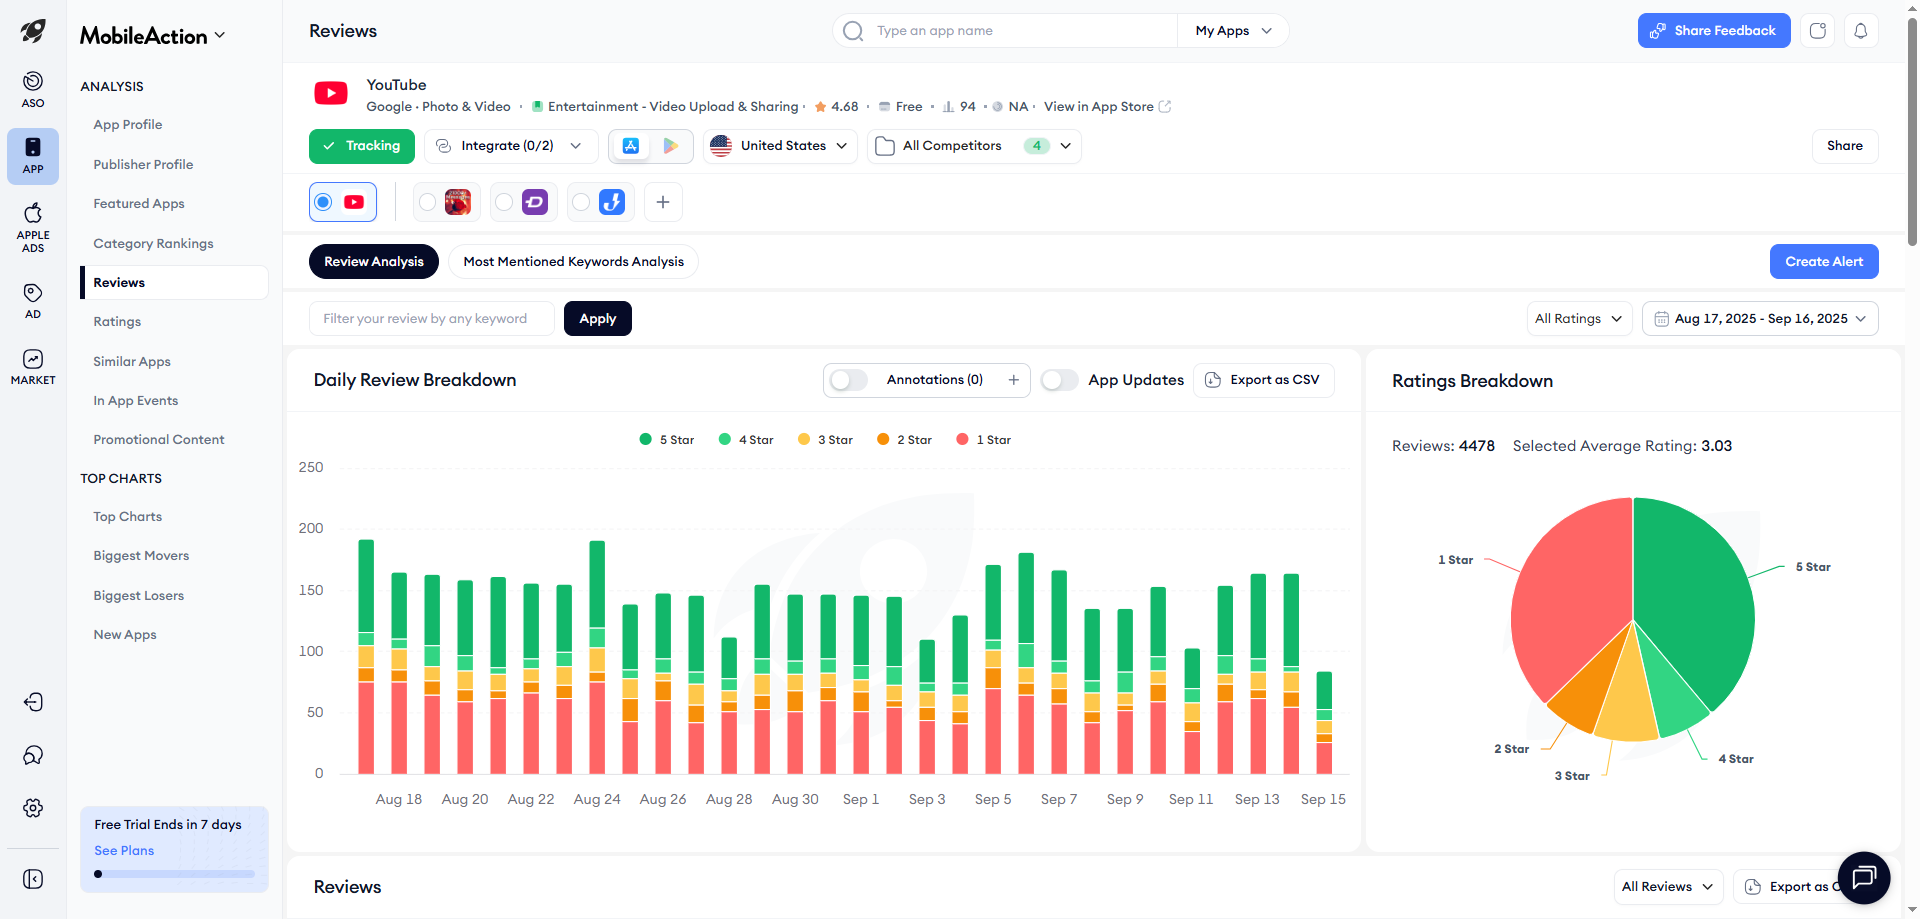
FoxData: AI-Powered Continuous Feedback Loop
FoxData’s Rating & Reviews module enhances intelligence and fluidity:
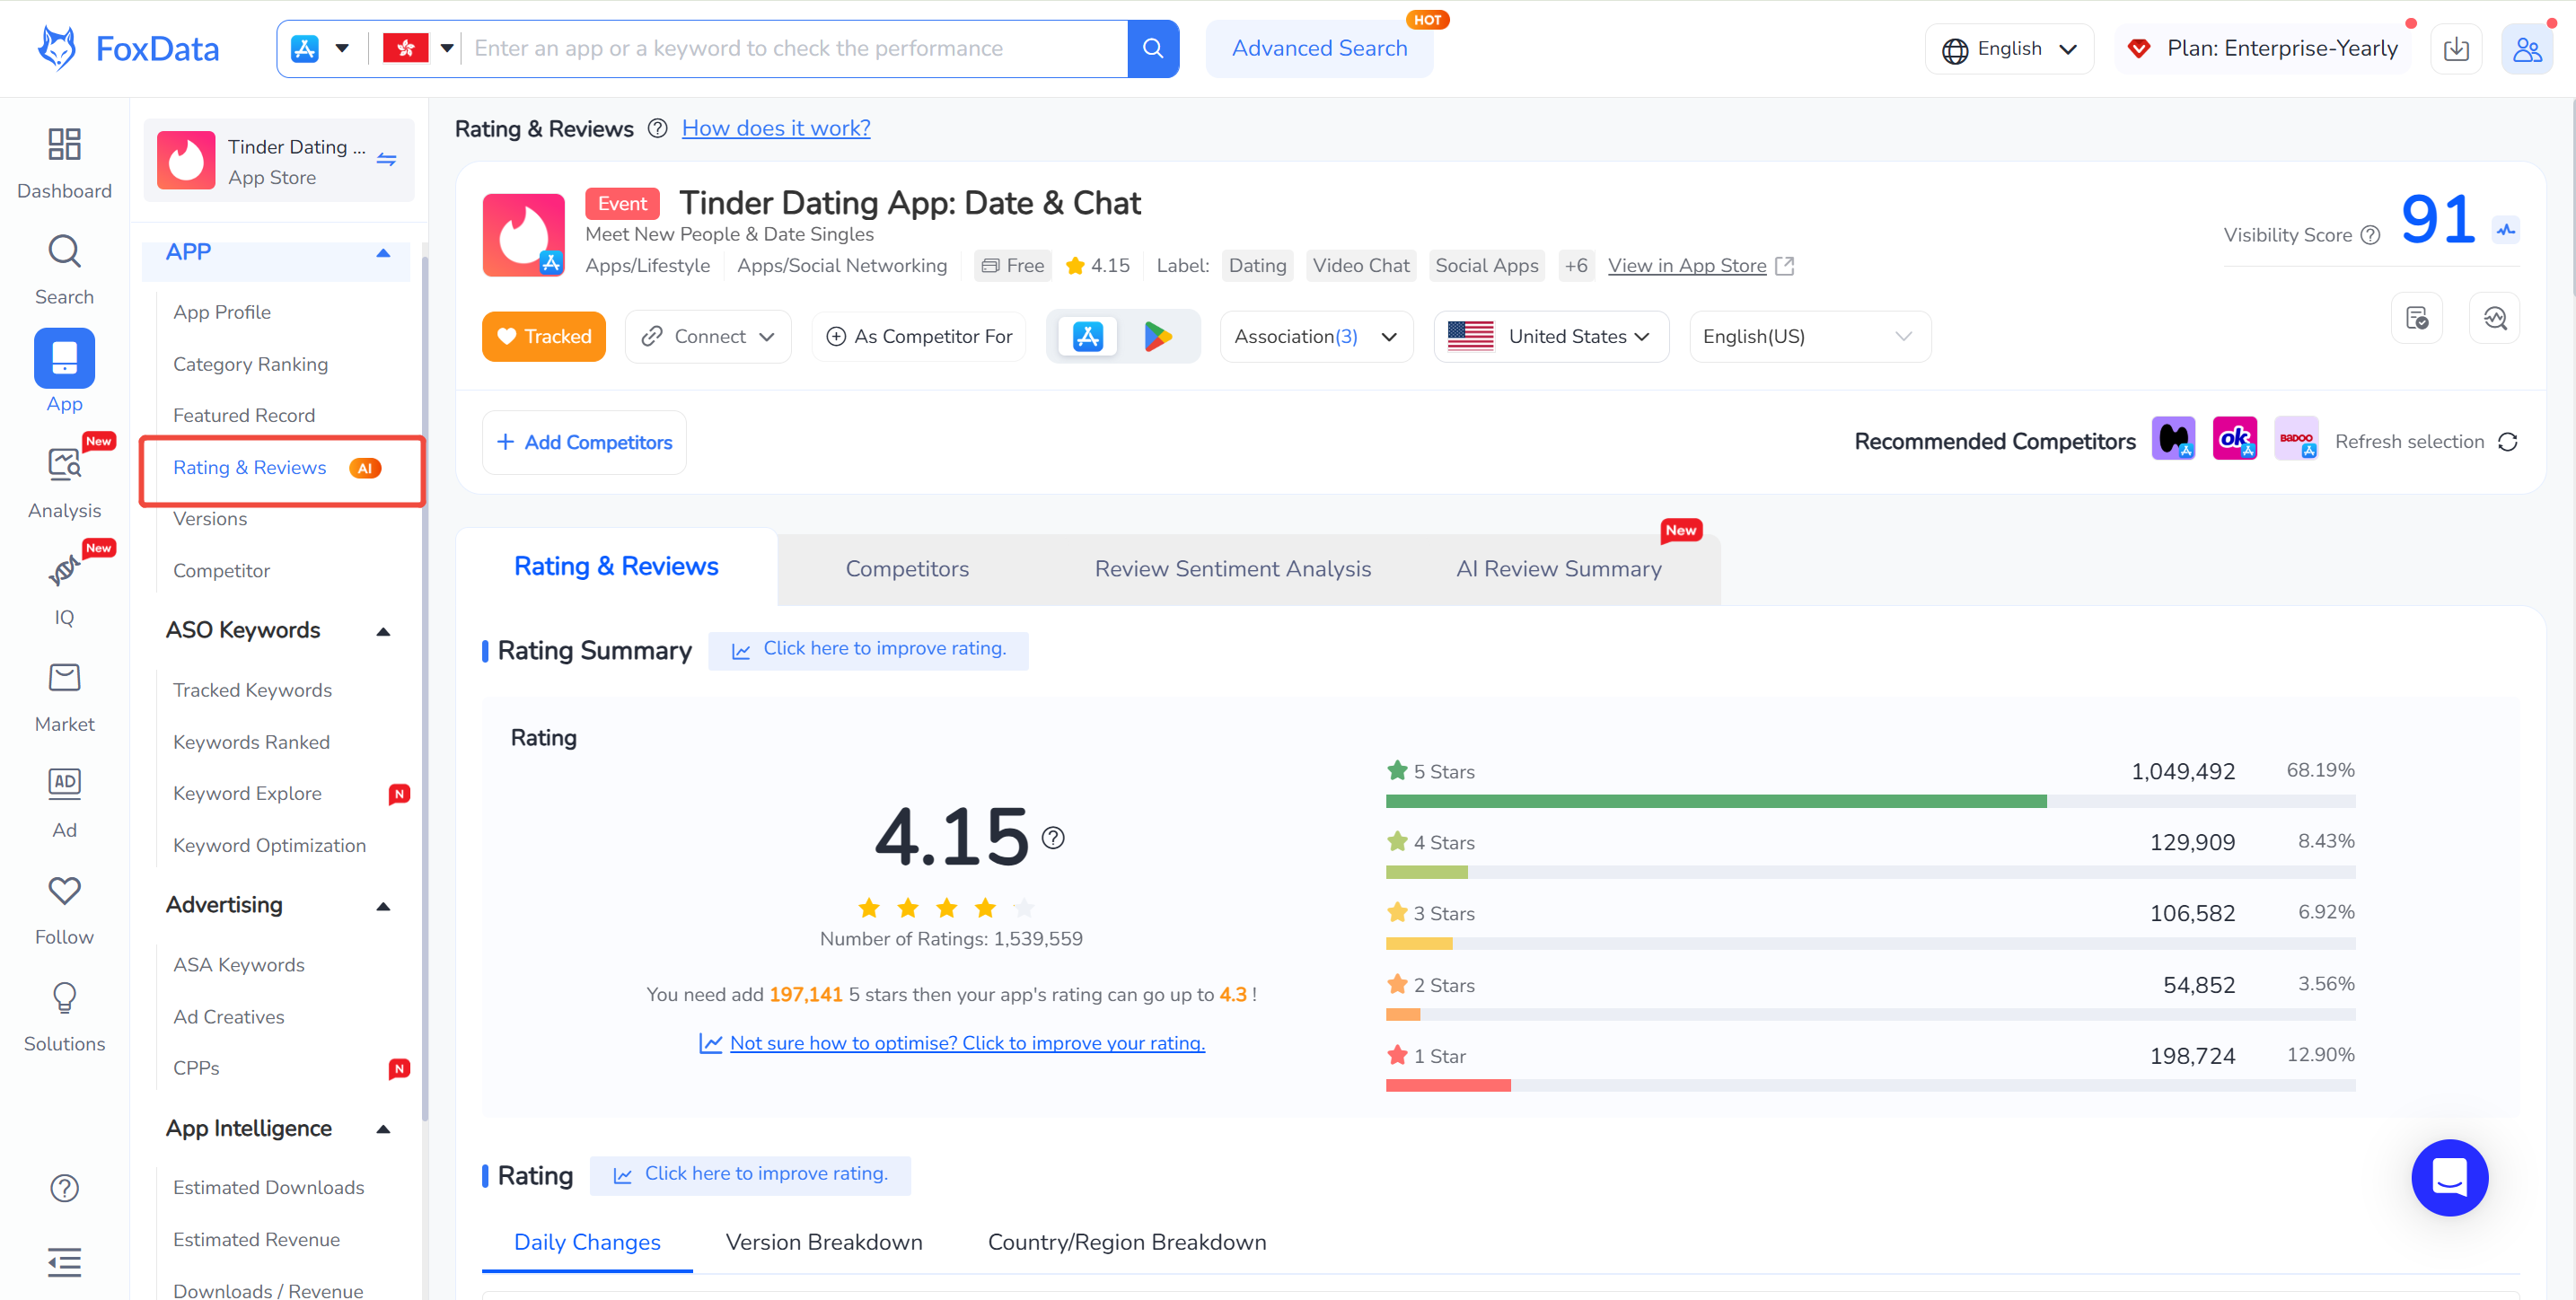
In essence, FoxData fuses AI sentiment analytics + live monitoring, compressing the ASO feedback loop from “tracking → insight → optimization” into one continuous cycle.
Price distribution of Mobile Action
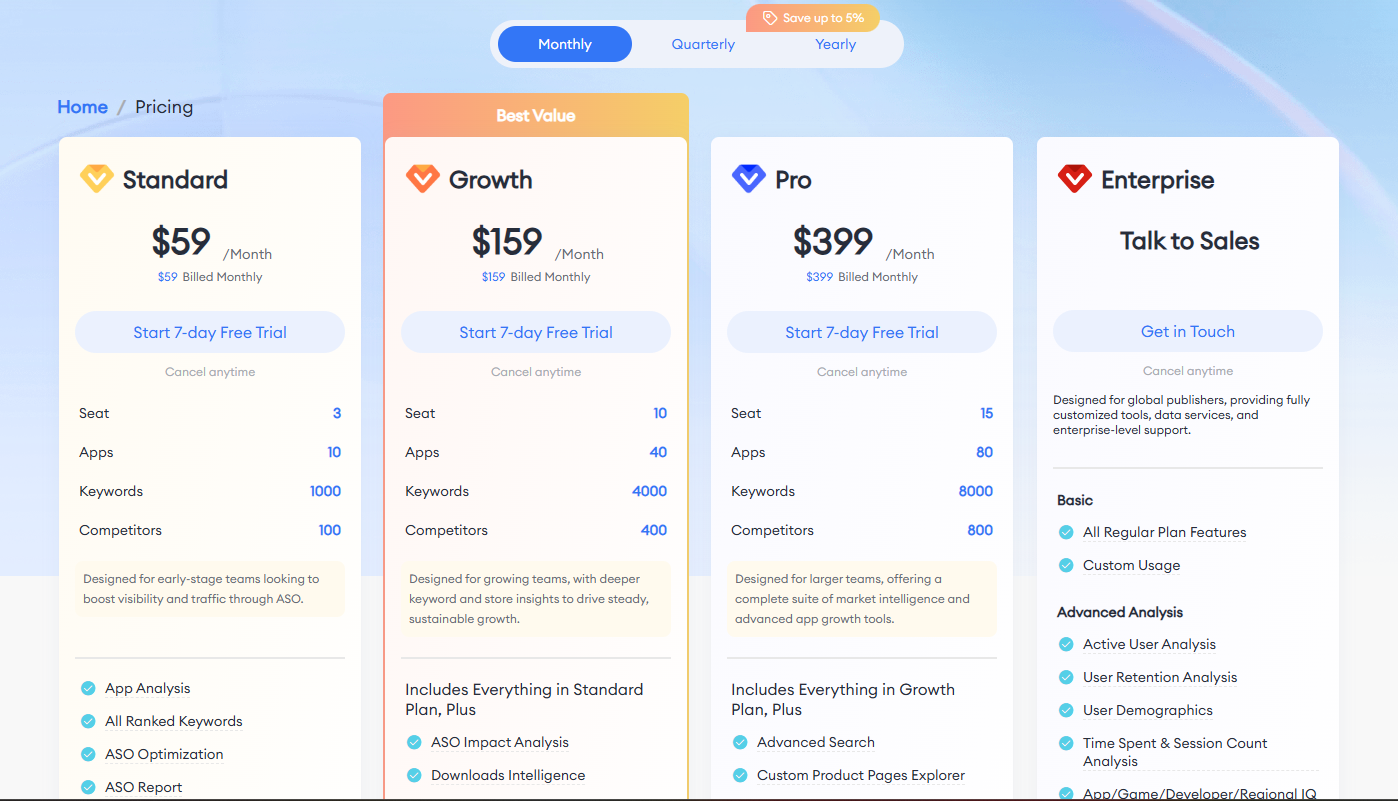
FoxData Pricing Plans
(Public pricing below; actual cost may vary by region and package.)
|
Plan |
Mobile Action |
FoxData |
Key Differences |
|
Entry |
$15 / 25 keywords / 3-month history |
Free / 50 keywords / 4-month history |
FoxData provides a permanent free tier. |
|
Standard |
¥699 / 500 keywords / 6-month history |
¥59 / 1000 keywords / unlimited history |
FoxData offers higher keyword limits and unrestricted historical data. |
|
Pro |
¥2399 / 1500 keywords / 12-month history |
¥1599 / 10000 keywords / unlimited history |
FoxData delivers higher data capacity and richer integration modules. |
The real difference is not who’s cheaper, but rather how much actionable value each dollar delivers.
In other words:
Mobile Action represents standardized analytical value, while FoxData represents real-time operational efficiency.
The key question isn’t “which costs less,” but which yields a higher ROI per dollar invested.
In today’s ASO ecosystem, Mobile Action reflects the depth of structured analysis, while FoxData embodies the speed of adaptive execution.
For strategies focused on data accumulation, benchmarking, and long-term planning, Mobile Action remains a reliable choice.
For agile decision-making, trend responsiveness, and multi-market coordination, FoxData provides unmatched efficiency and transparency.
Ultimately, the better tool depends not on raw cost or fame, but on how its cadence aligns with your team’s ASO rhythm.
📊 Experience FoxData’s real-time ASO dashboard today and redefine your optimization workflow.
© 2020-2026 FoxData. All Rights Reserved.
