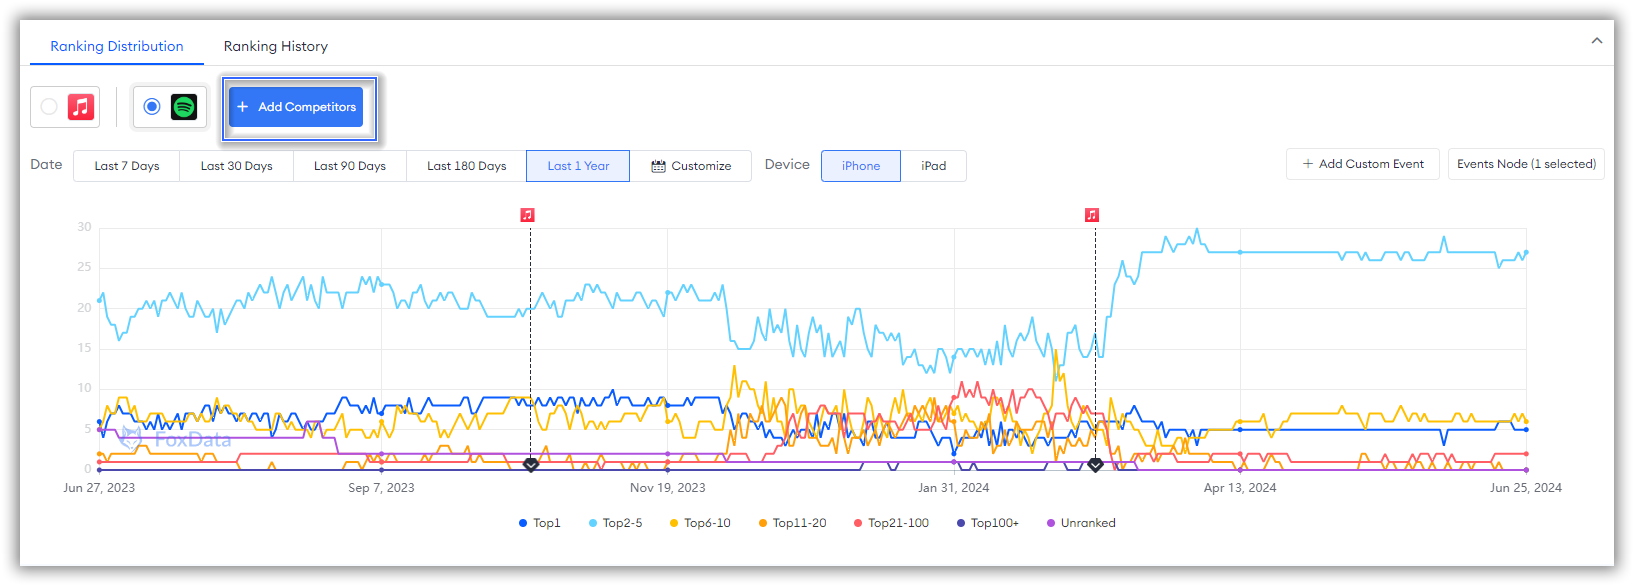
Based on feedback from FoxData users, we conducted a new round of version updates at the end of June.
This time, we added three new features: "Live Search", "Keyword Track List", and "Keyword Position".
These features will help you track data more intuitively and conveniently.
Let's delve into our updates!
Live Search
You can easily find the "Live Search" feature under the four sections of
ASO Keywords.
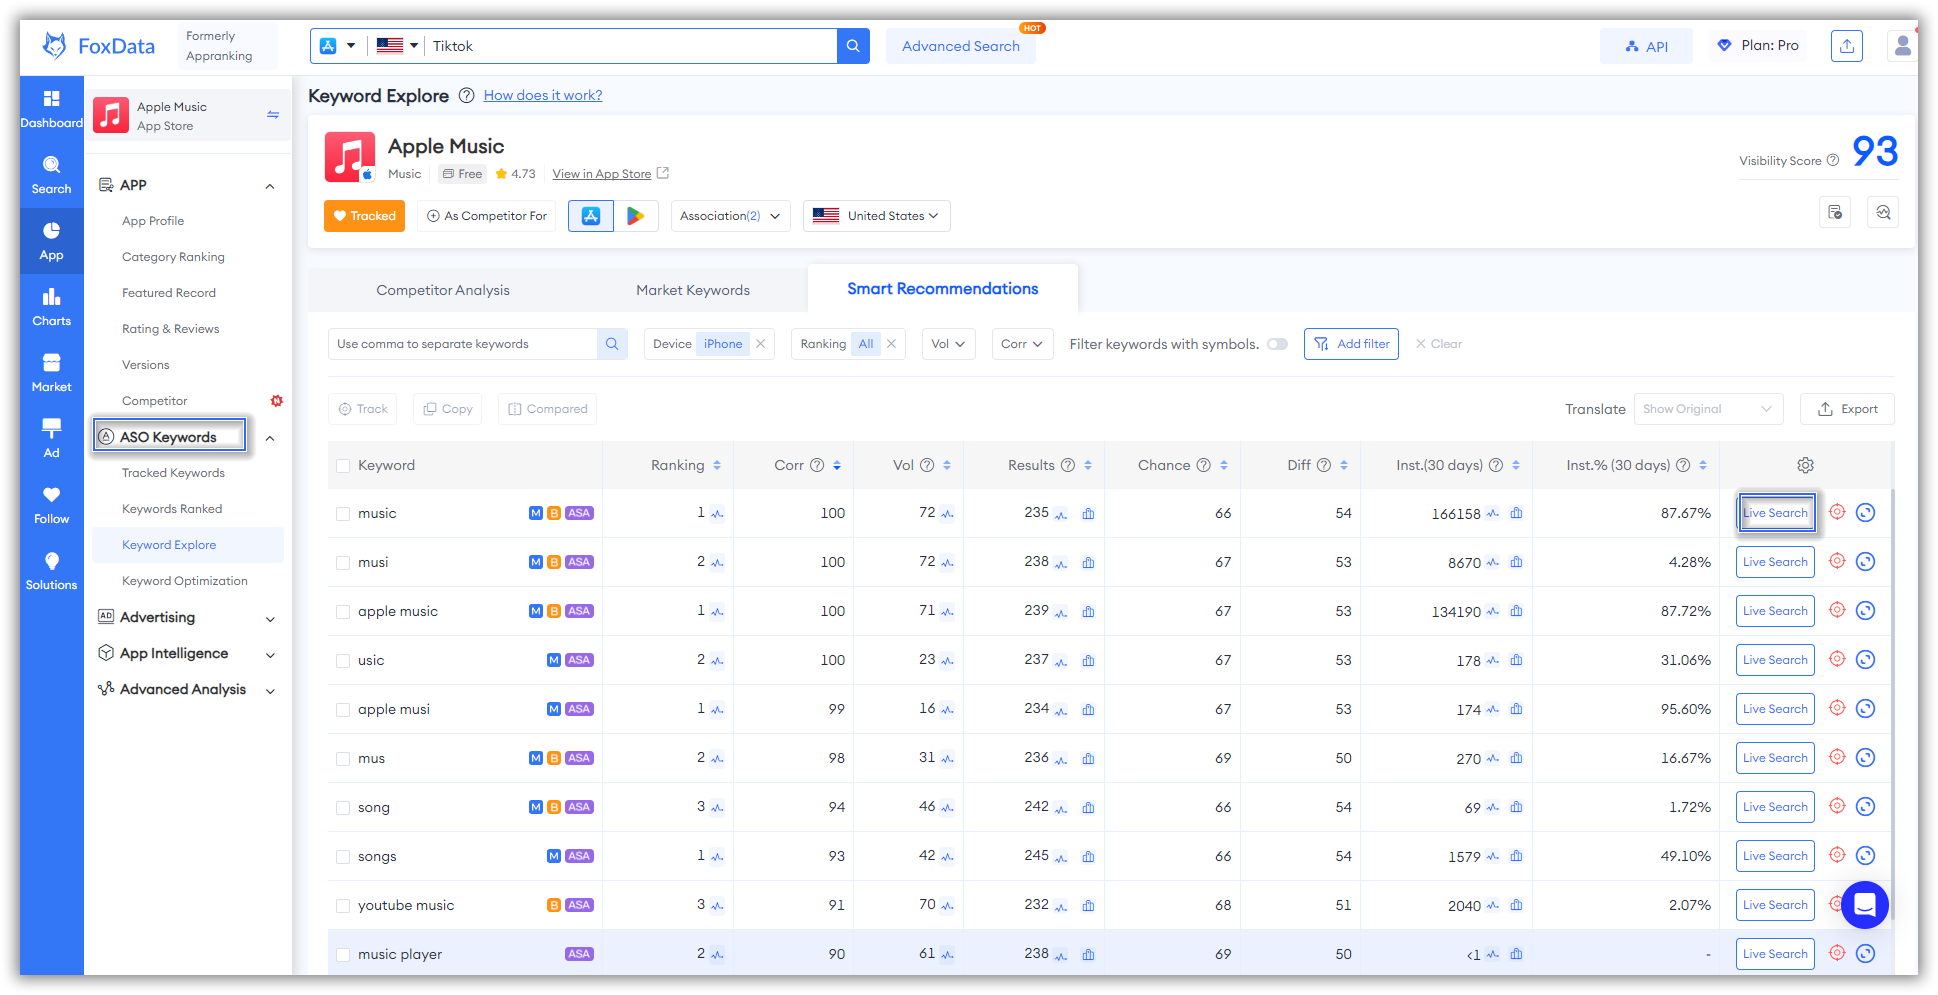
This feature primarily helps developers track keywords' performance and rank competitors' apps under these keywords in real-time. This allows for timely adjustments to optimization strategies to maintain or enhance app visibility and download rates.
Currently, this feature specifically supports viewing:
- "Real-time search results for keywords on the App Store or Google Play" - Live Search
- "Real-time app information under Stories" - Stories
- "Real-time information on Bidding Apps under the same keyword" - Bidding Apps
- "Historical search results for the past 7 days under the keyword" - Past Results
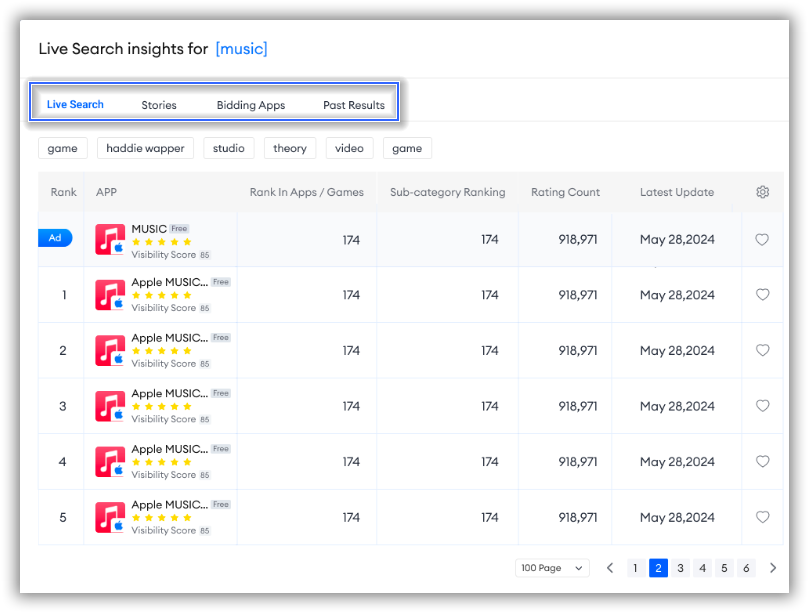
Please note that not every app will have Bidding Apps and Stories. If there are no stories or bidding apps under a particular keyword, the relevant tabs will not be displayed.
Keyword Track List
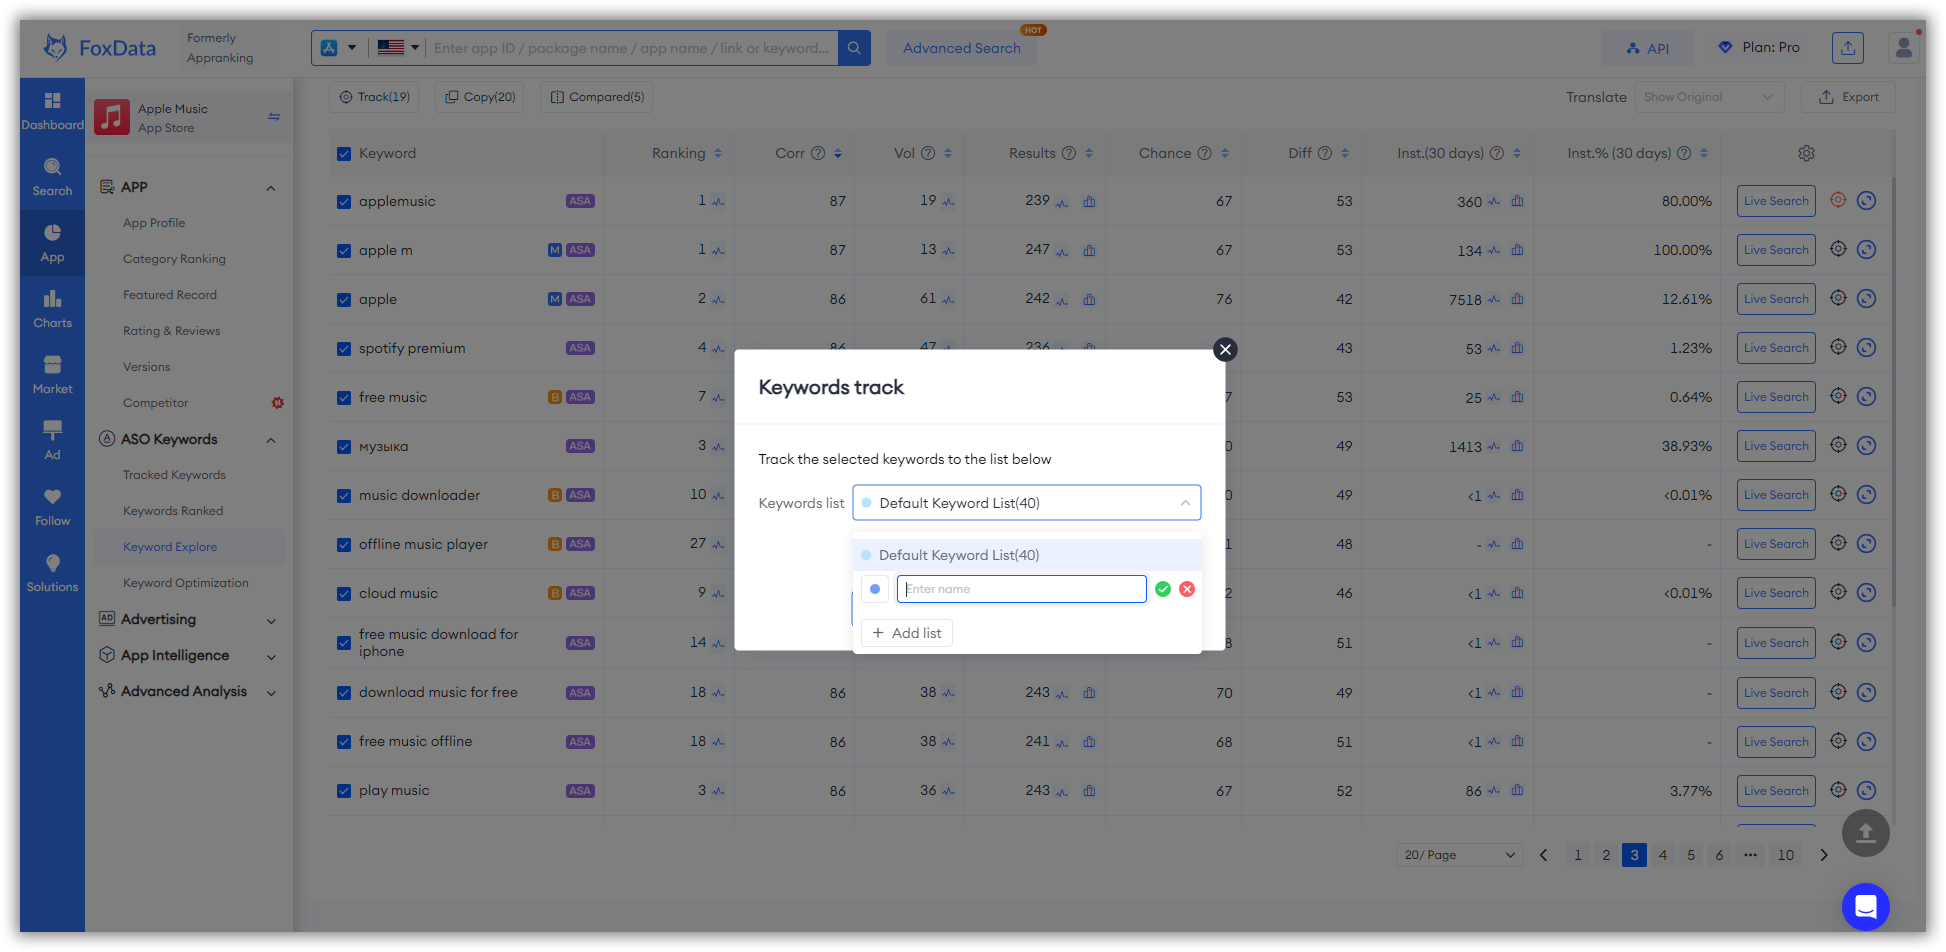
Many users may have already noticed our newly added keyword grouping feature. FoxData now also supports editing Keyword Track List names. Each list can include up to 1000 keywords.
We are committed to streamlining your entire keyword tracking process, providing you with the smoothest data monitoring and analysis experience.
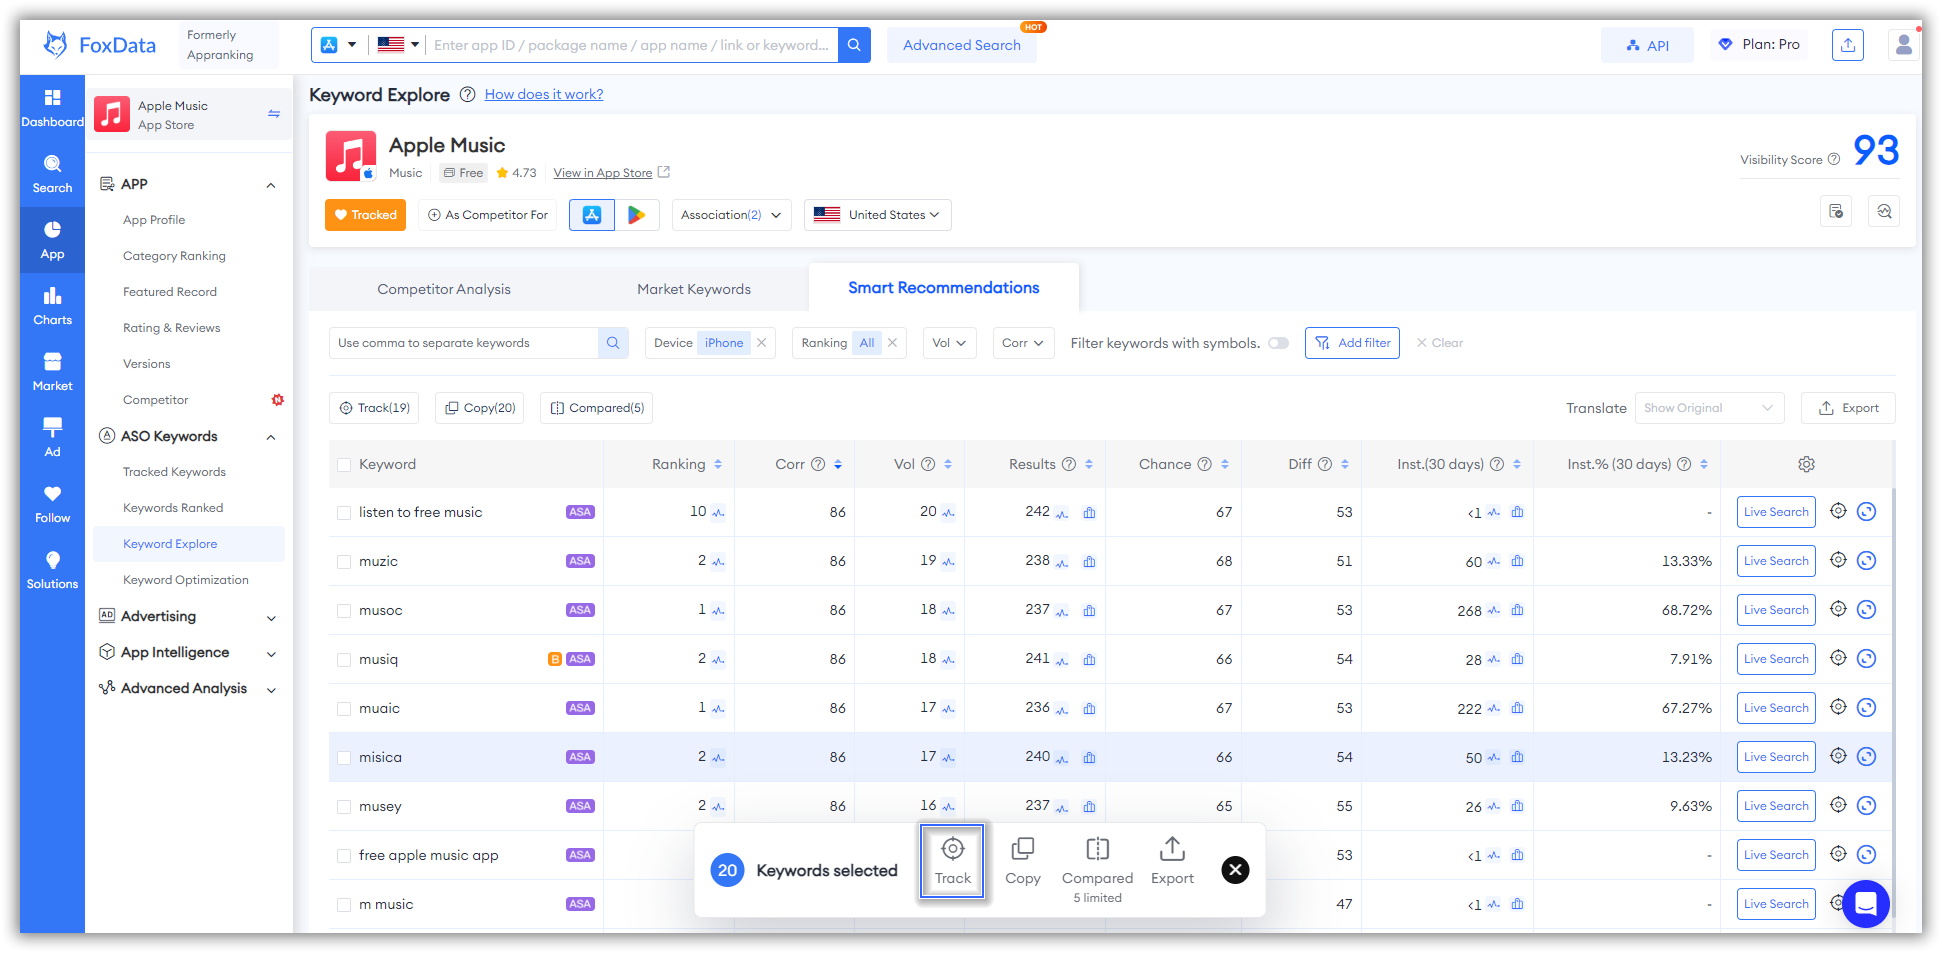
Simply select the keywords you want to monitor, then click "Track," and you can easily manage your lists!
Keyword Position
The Keyword Position feature is one of the most exciting additions in this version update. It helps developers and market researchers visualize keyword data for more intuitive tracking and monitoring.
👉 You can use this feature under
Tracked Keywords, making it easy to perform visual data analysis with the help of charts.
Scatter Plot
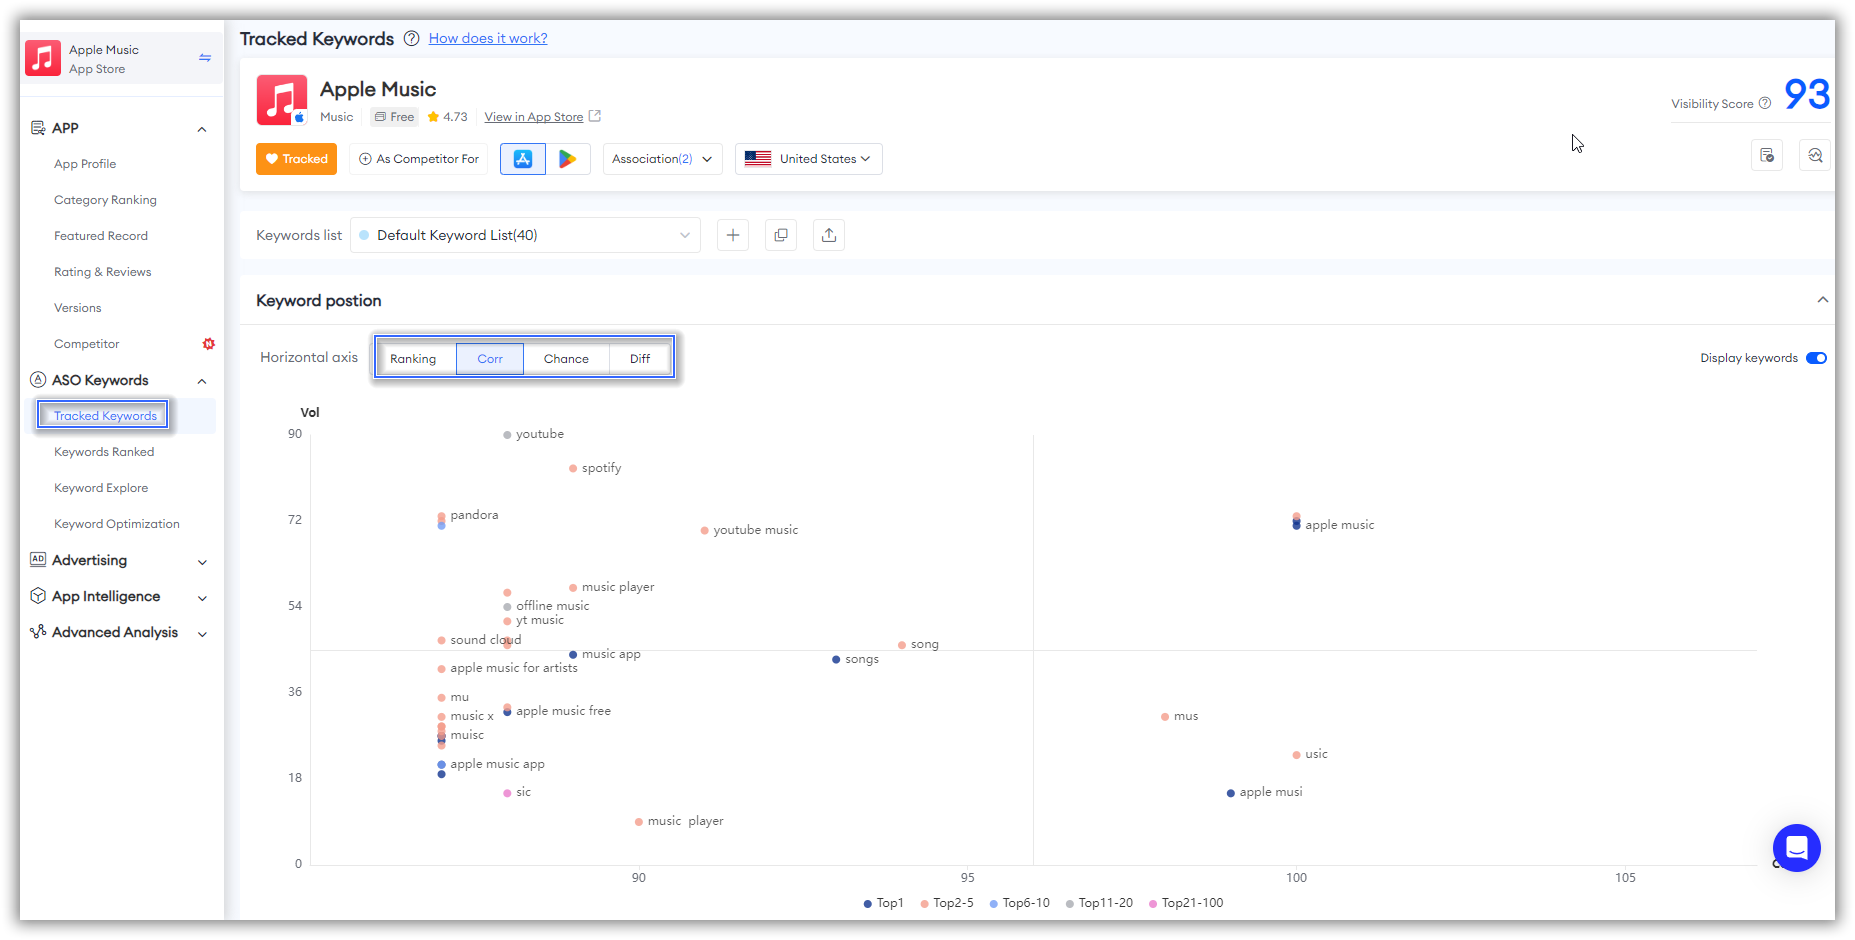
Our latest update introduces scatter plots to visualize the ranking, correlation, cahnce score, and difficulty score of tracked keywords.
In App Store Optimization (ASO), keyword scatter plots are an extremely valuable tool.
Scatter plots can visually display the performance of different keywords, such as search volume, correlation, and ranking. This helps developers and market researchers allocate resources more rationally, focusing more effort on high-potential keywords to ensure optimization measures are more precise and effective.
Users can also see how competitors perform on specific keywords, allowing them to formulate strategies to surpass their competitors.
Line Trend Chart
Our latest update uses line trend charts to display the distribution and trend data of keyword rankings.
Line trend charts provide a clear visualization of how keyword rankings change over time, helping users identify patterns and trends. This enables developers and market researchers to make informed decisions based on the historical performance of keywords, ensuring more effective and strategic optimization efforts.
By monitoring the ranking trends, users can quickly respond to any changes in keyword performance and adjust their strategies accordingly to maintain or improve their app's visibility.
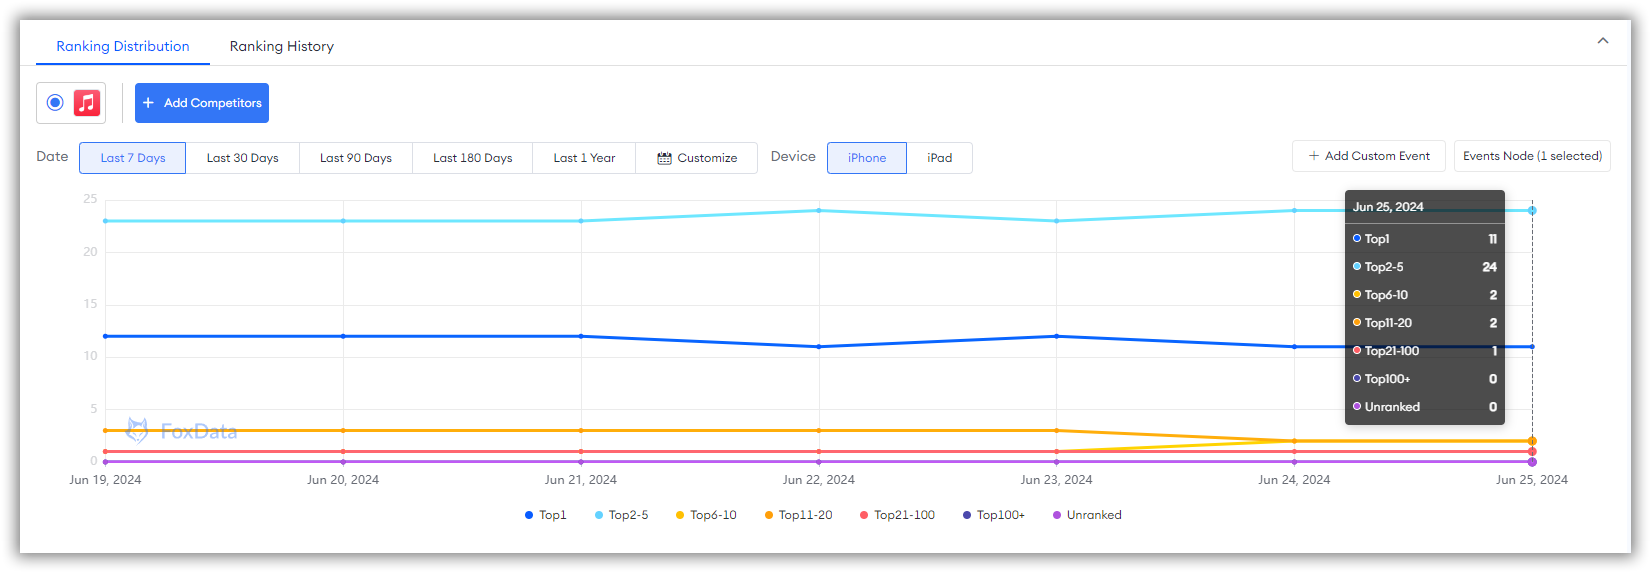
You can not only freely choose the time dimension to view changes in your keyword distribution rankings to monitor your keyword strategy, but you can also "Add Competitors" to track the performance and strategies of competitors' keywords.
It's all right here, ready to help you drive your success!
At
FoxData, we're constantly building new features to make it easier for you to efficiently scale your campaigns!
All content, layout and frame code of all FoxData blog sections belong to the original content and technical team, all reproduction and references need to indicate the source and link in the obvious position, otherwise legal responsibility will be pursued.


