

Explore More Possibilities for Your Business
Full-cycle scenario construction to meet your needs from App research, development, and release to operation.
Ready for your soaring growth

The mobile gaming market is more competitive with millions of titles competing for screen time and wallet share. The difference between a game that scales and one that stalls often comes down to a single variable:
What you measure and when you act on it.
Mobile gaming is the largest sector in the global gaming market, accounting for roughly 49% of all gaming revenue in 2023, totaling around $90 billion. However, due to skyrocketing user acquisition costs, most new games struggle to achieve a positive Return on Advertising Spend (ROAS) quickly.
Studies have shown that 83% of mobile games fail to survive in the long term, and many that do launch are unable to turn a profit on their marketing spend in the initial months.
That gap is rarely a product problem. It is almost always a data problem.
Mobile game marketers, UA managers, and publishers who rely on gut instinct or fragmented dashboards are flying blind. The good news is that the right mobile game data analytics framework does not require a team of data scientists. It requires knowing which five data points actually matter, and building a system to track them consistently.
This article walks you through those five data points, explains why each one is critical, and shows you exactly how to act on what you find.
The mobile gaming funnel has never been leakier. Users discover your game through search, ads, or word of mouth, install it, play for a session or two, and then a significant portion vanishes.
Industry data consistently shows that average Day 1 retention for mobile games often sits around 25-30%, meaning more than 70% of players who install a game never return after the first day.
That kind of churn is not just a product issue. It signals misalignment between how a game is marketed, how it is positioned on the app store, and what the actual in-game experience delivers. Closing that gap requires a systematic approach to how to track mobile game performance at every stage of the funnel.
Beyond retention, the rise of privacy-first attribution models, the deprecation of third-party identifiers, and the growing complexity of app store algorithms have made it harder to connect marketing spend to outcomes. Data-driven teams who have built clean, layered measurement stacks are pulling ahead of everyone.
The five data points below are not the only metrics worth tracking. They are the ones that, when monitored together, give you a complete and actionable picture of how your game is performing at any given moment.
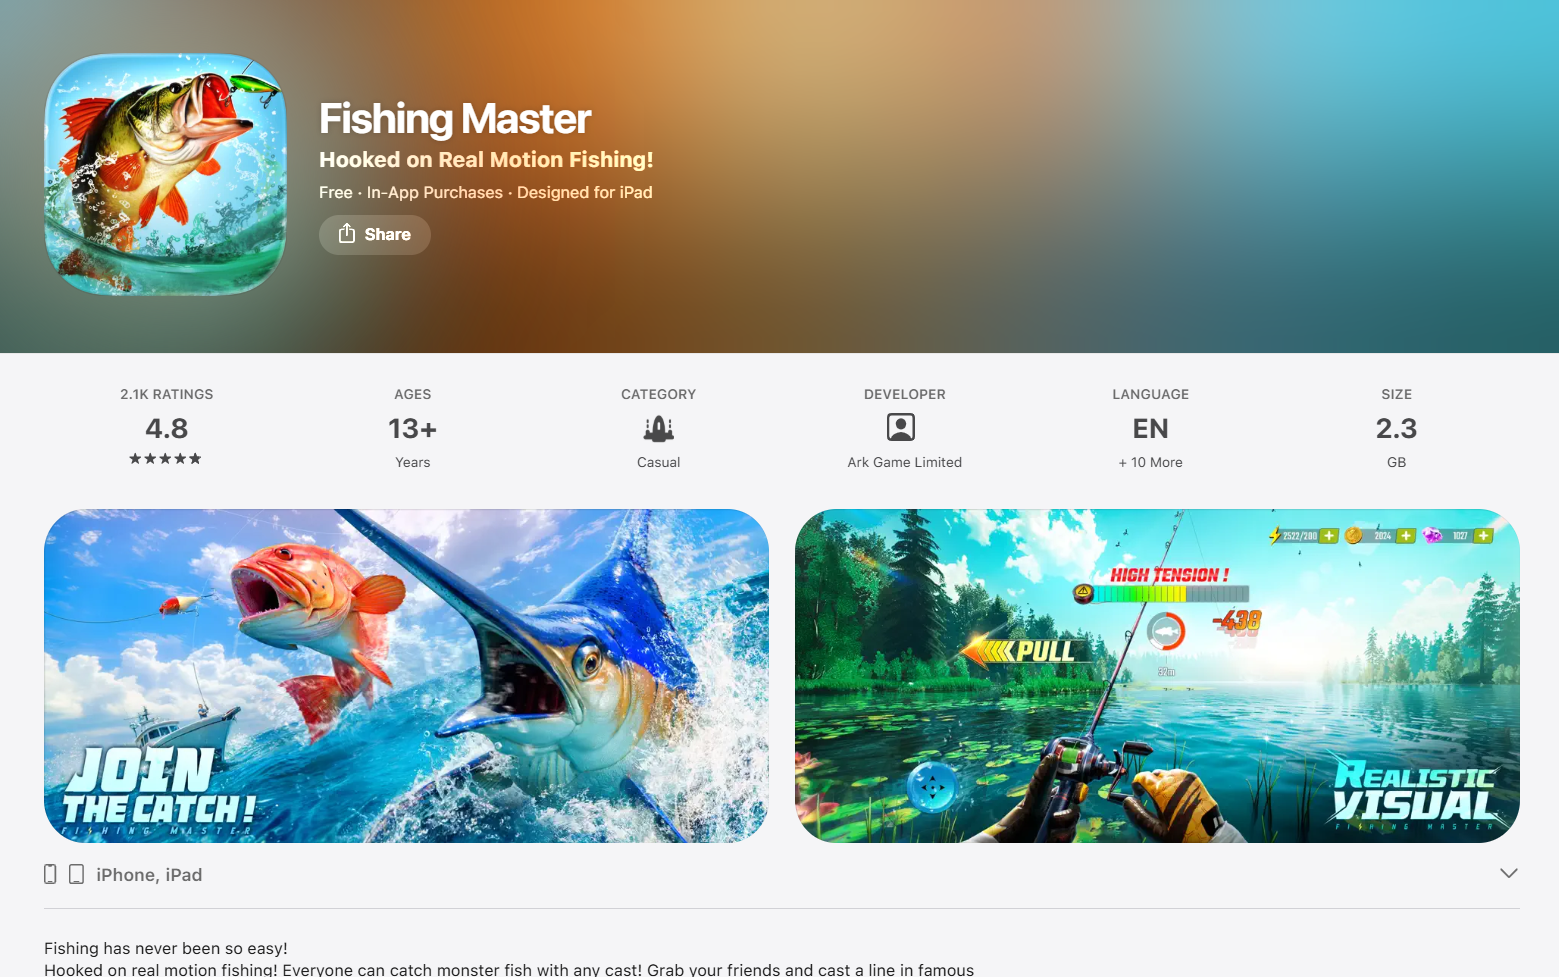
App store discoverability is the foundation of organic growth. A game that does not appear in top search results for its core keywords is invisible to the most motivated segment of potential players: people actively searching for exactly what you offer.
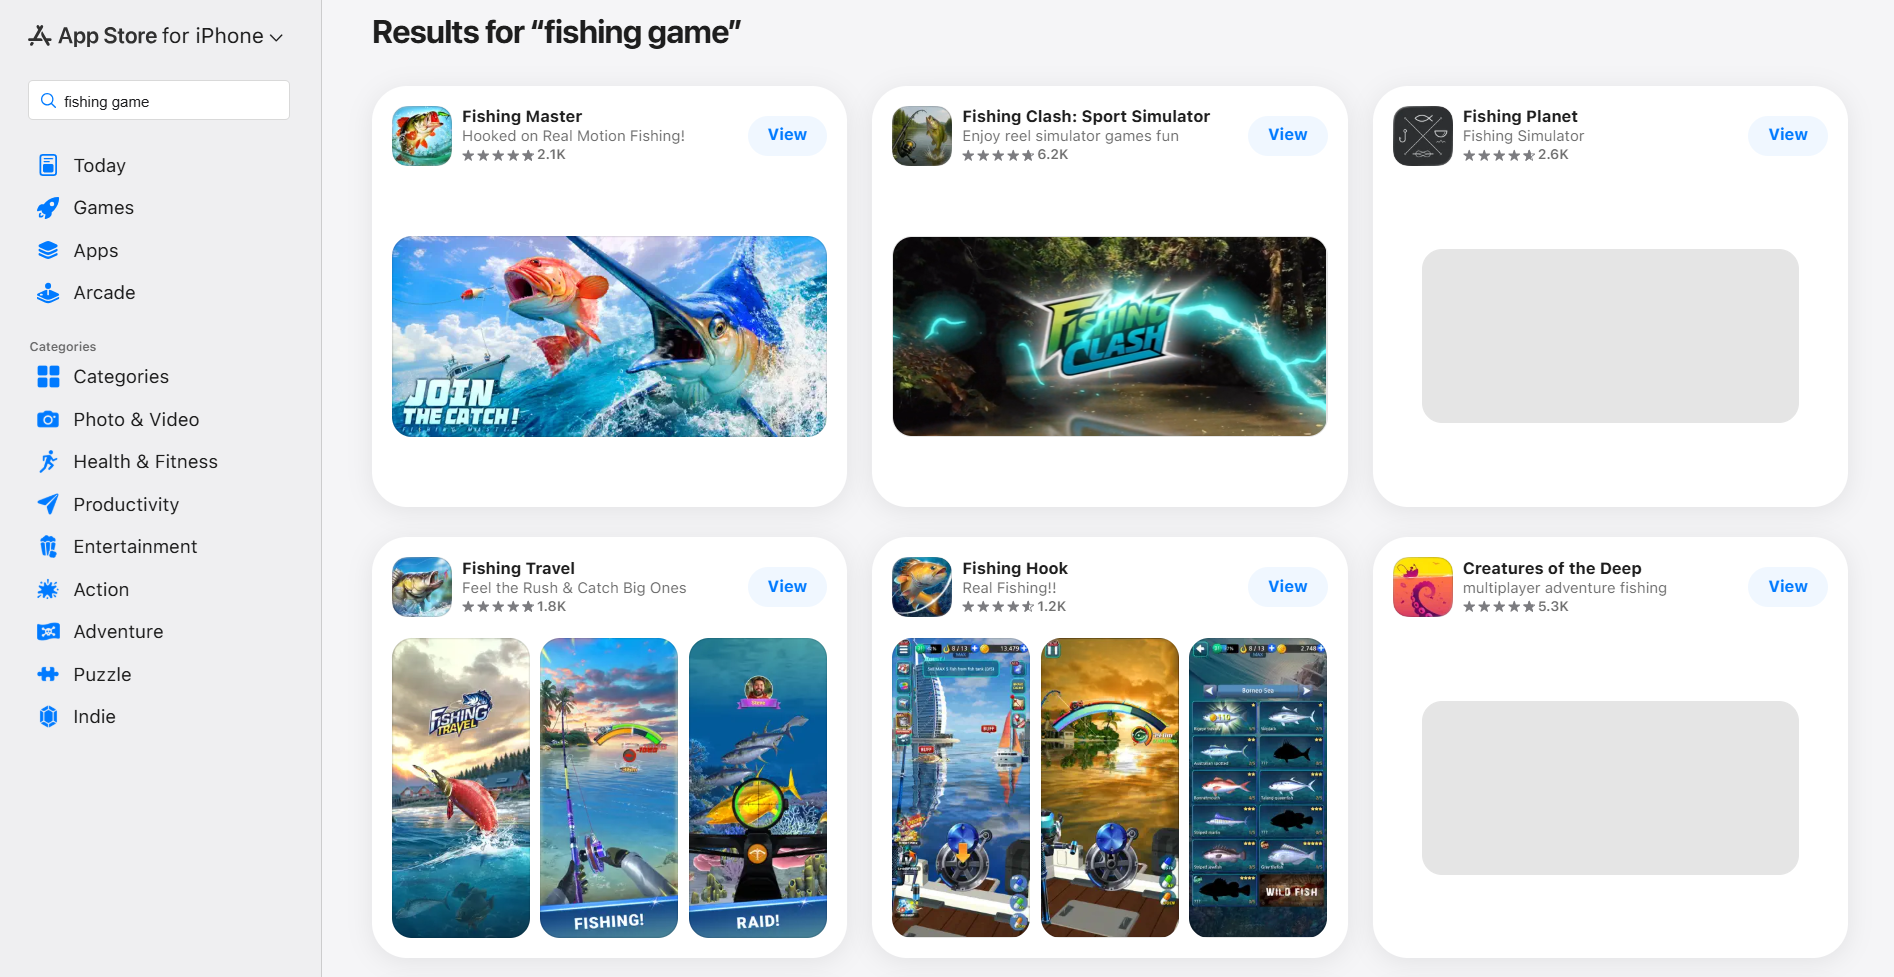
Your keyword visibility score tells you how prominently your game appears across relevant search terms on both the Apple App Store and Google Play. Tracking this metric weekly, not monthly, allows you to spot ranking fluctuations caused by algorithm updates, competitor activity, or your own metadata changes.
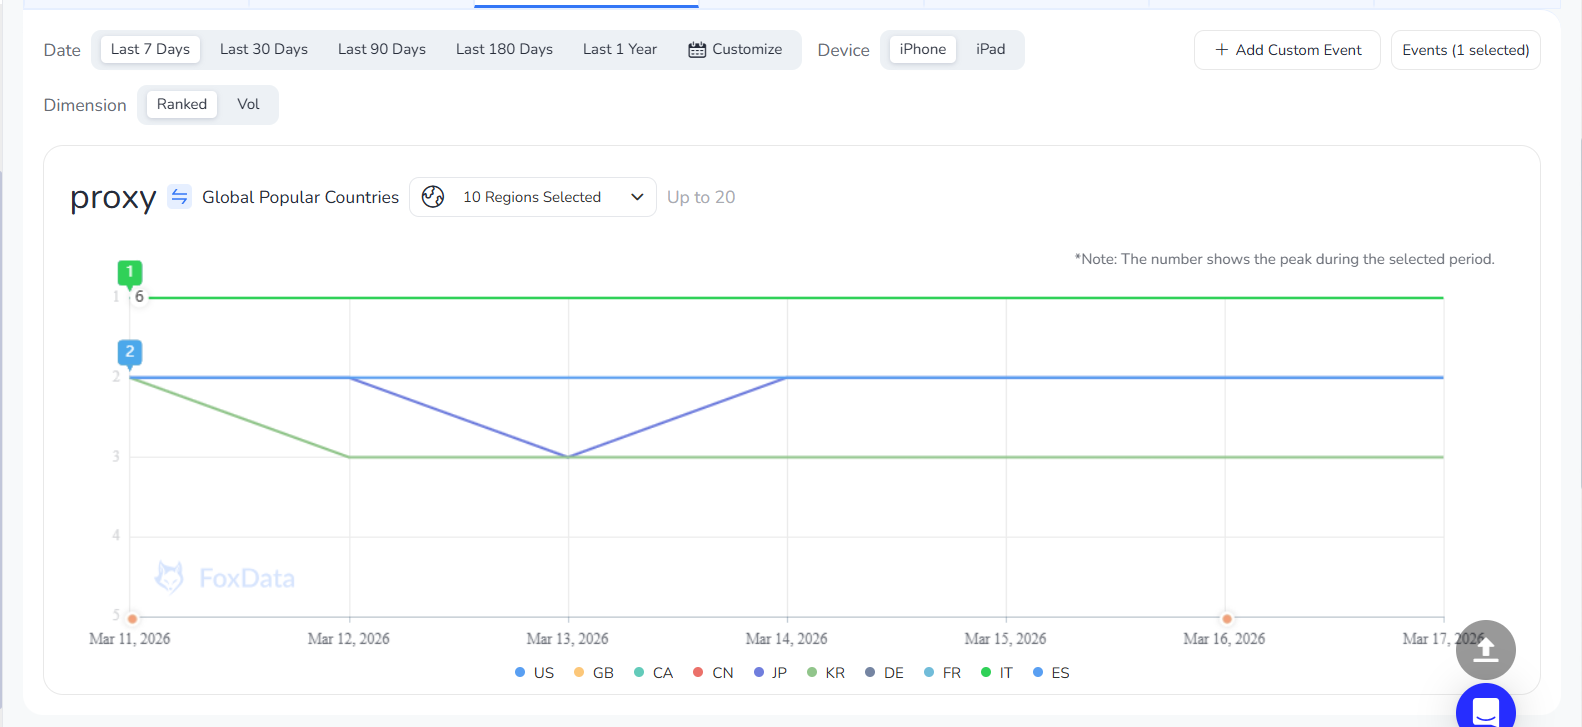
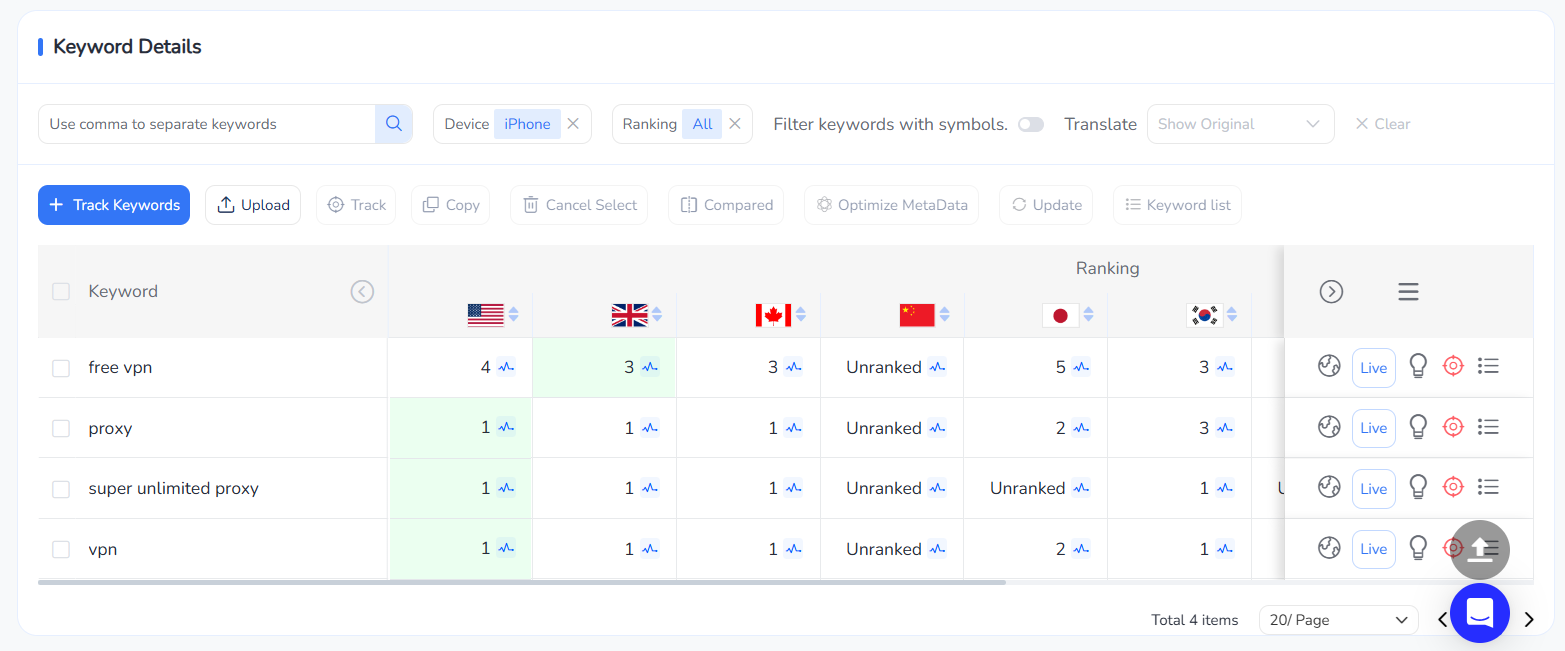 Tracked keywords performance across 10 selected regions | Source: FoxData
Driving traffic to your store listing is only half the battle. If your icon, screenshots, preview video, or description are not converting that traffic into installs, your entire UA spend is working against an invisible ceiling.
Store page conversion rate (CVR) is calculated by dividing total installs by total store listing page views. Top-performing mobile game store pages achieve CVR benchmarks significantly above category averages, often by 2x or more, simply through disciplined creative testing.
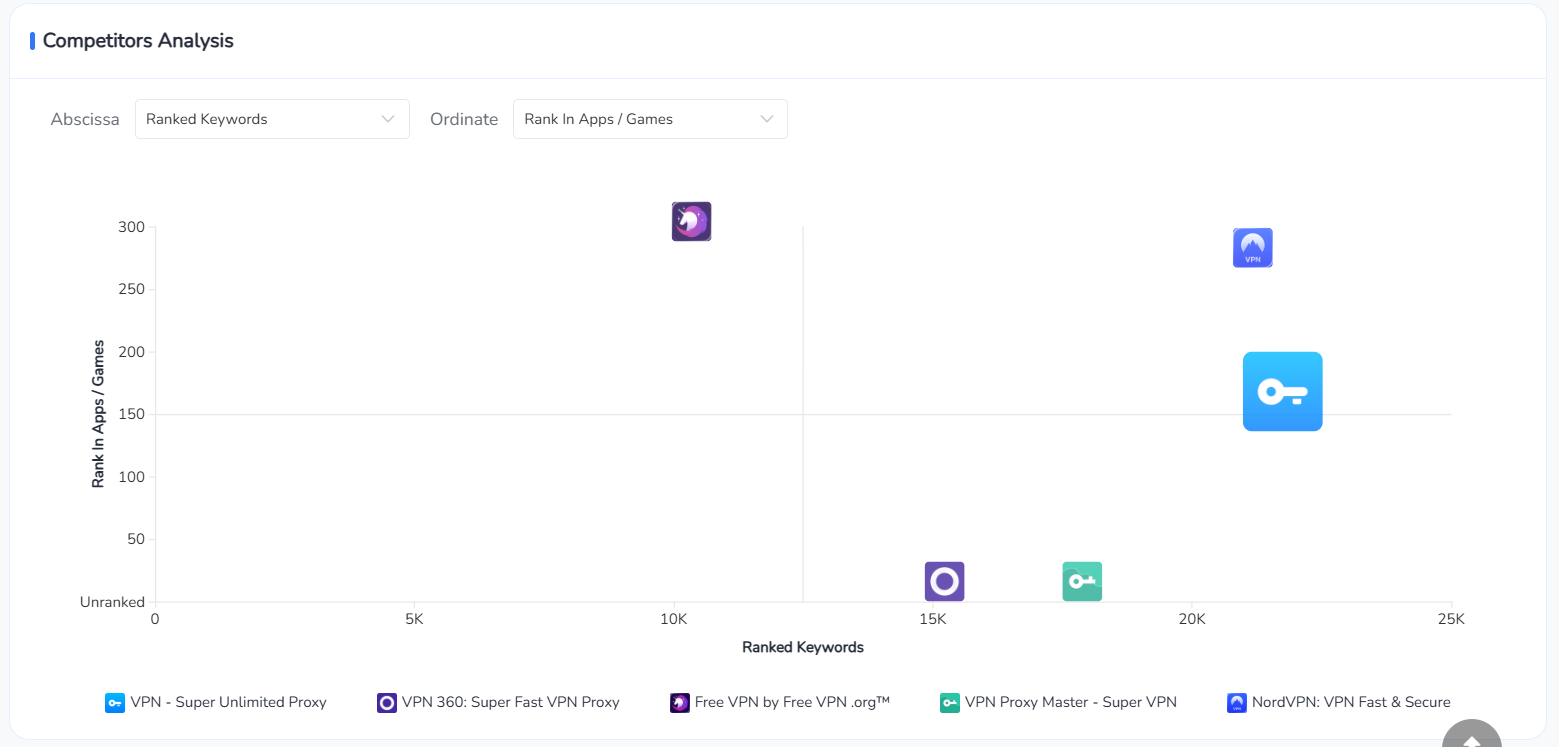
Retention is the single most predictive indicator of a mobile game's long-term commercial viability. It tells you whether players find enough value in your game to keep coming back, and it directly determines the efficiency of every dollar you spend on user acquisition.
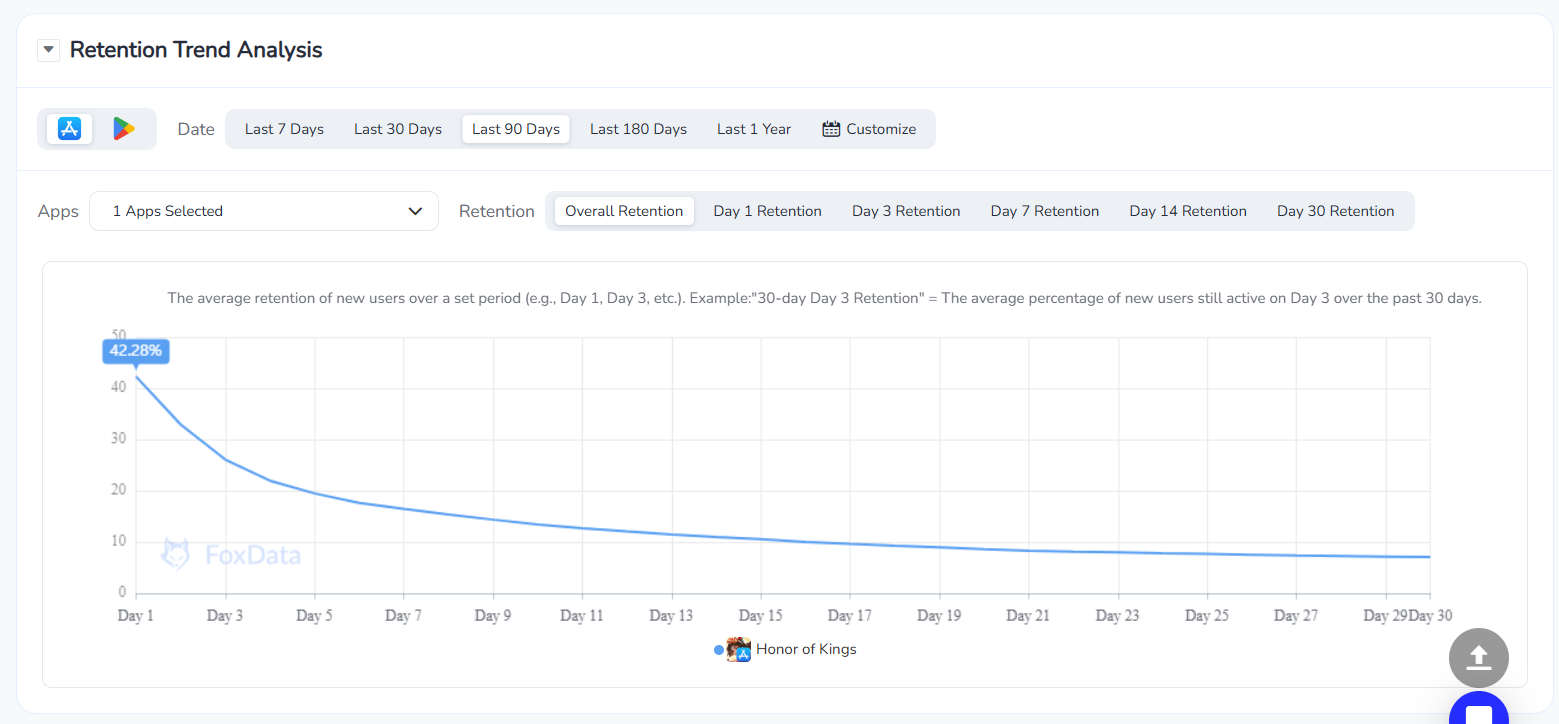
Industry benchmarks for mobile game retention typically cluster around 25 to 30% for Day 1, 10 to 15% for Day 7, and 3 to 8% for Day 30. If your numbers are below these ranges, scaling UA spend will only amplify the problem, not solve it.
Overall retention rate percentage | Source: FoxData
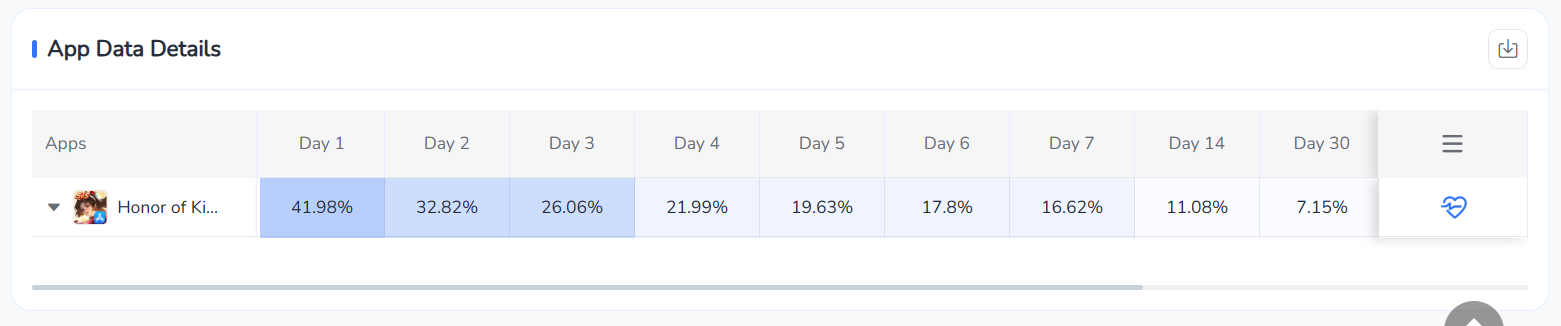
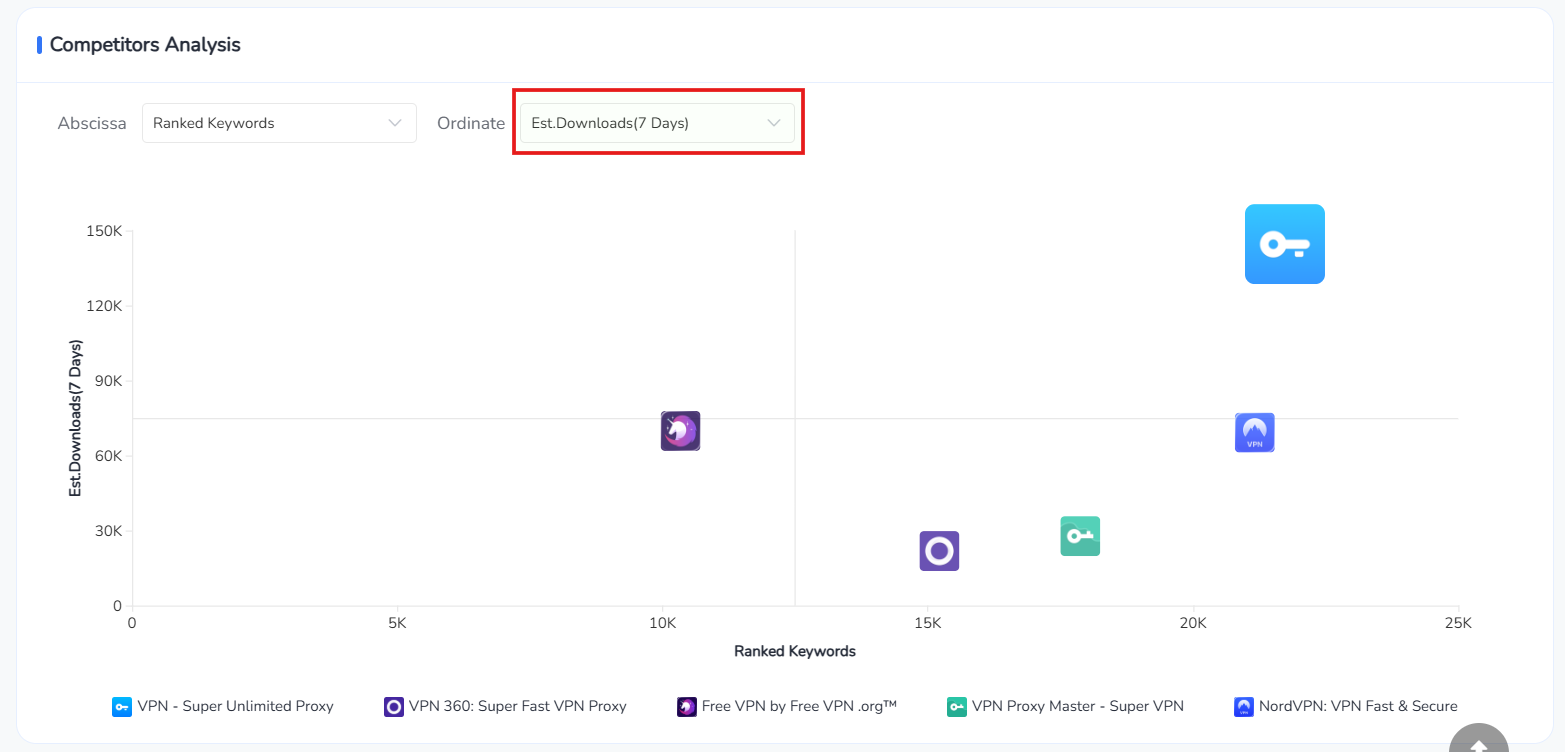
Understanding your own performance in isolation is not enough. Mobile game marketing is a zero-sum competition for player attention and app store shelf space. The teams that grow consistently are the ones who understand the competitive landscape as well as they understand their own product.
Competitor download estimates and category share trends reveal which titles are gaining momentum in your genre, which keywords they are winning, and how your growth rate compares to the market. This is not about copying competitors. It is about identifying opportunities they have not yet claimed and threats before they arrive.
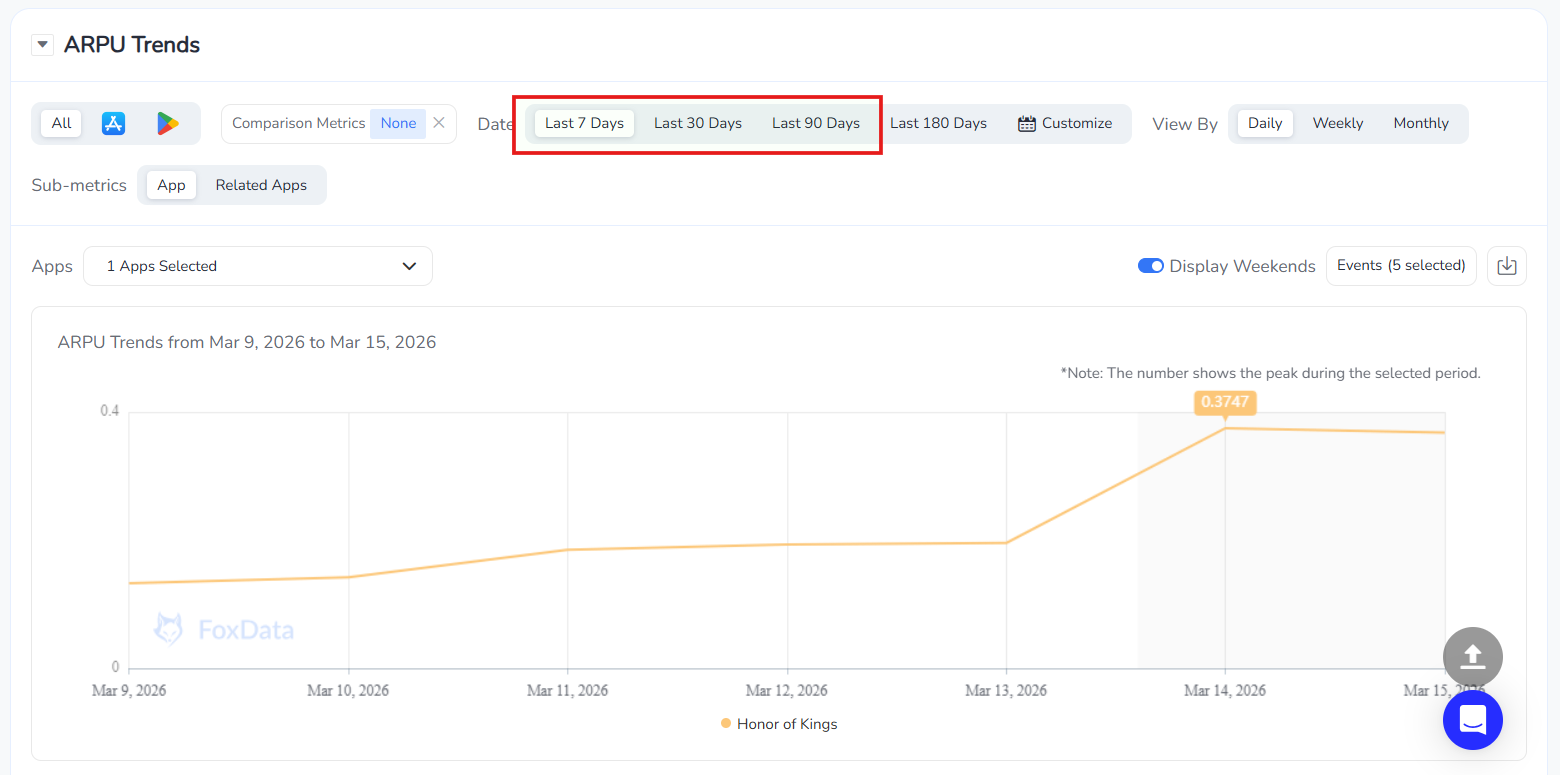
Average Revenue Per User (ARPU) is a standard metric, but the real intelligence comes from segmenting it by where those users came from. Paid social, Apple Search Ads, organic search, and app store browse all deliver users with very different monetization profiles.
A study on mobile monetization patterns found that users acquired through high-intent channels, particularly app store search, consistently show higher lifetime value compared to users acquired through passive discovery channels. This has direct implications for how you build your UA media mix and how you evaluate channel efficiency.
Knowing what to track is step one. Having a tool that surfaces these insights in a single, coherent view is what separates teams that react quickly from teams that are always catching up.
A purpose-built mobile game store performance tracker brings together keyword rankings, competitor intelligence, store CVR trends, and download estimates into one workflow. Instead of stitching together data from five different sources, your team can monitor the metrics that matter, spot anomalies early, and make decisions with confidence.
FoxData's mobile game analytics solutions are built specifically for this use case. The platform gives mobile game marketers and UA managers a unified view of store performance data, competitive benchmarks, and keyword tracking across both major app stores. You can monitor ranking changes in near real time, run keyword gap analyses against competitors, and export clean datasets for deeper analysis.
If your team needs to integrate store performance data directly into your own BI tools or internal dashboards, the App Data API provides programmatic access to the same underlying data, so you can build custom reporting workflows without switching tools.
The core workflow looks like this:
Even experienced teams fall into predictable traps when tracking mobile game performance. Here are the most costly ones.
An average Day 7 retention rate hides enormous variation. A cohort from a high-performing creative on Apple Search Ads might retain at 20%. A cohort from a broad lookalike campaign on a social platform might retain at 5%. If you average those together, you will never know which channel to scale and which to cut.
Many teams treat ASO as a launch activity and then forget about it. In reality, app store algorithms update continuously, competitors optimize their listings, and seasonal trends shift keyword volume throughout the year. Mobile game store performance tracking should be a weekly routine, not a quarterly project.
Downloads are a vanity metric unless paired with retention and revenue data. A campaign that delivers 100,000 installs with 5% Day 7 retention is a liability. A campaign that delivers 20,000 installs with 22% Day 7 retention is an asset. Build your reporting around what happens after the install, not just how many installs you generate.
Teams that only measure their own performance have no frame of reference for whether they are winning or losing market share. If your downloads are flat but your category competitors are all declining, you are actually outperforming the market. If your downloads are up 10% but competitors are up 30%, you are falling behind despite positive absolute numbers. Always benchmark against the category.

Discover how FoxData enhances data protection and security standards to keep your analytics safe and reliable.
The five data points covered in this article, keyword visibility, store CVR, retention cohorts, competitor trends, and channel-segmented ARPU, are not advanced analytics concepts. They are the fundamental building blocks of a disciplined, growth-oriented mobile game marketing operation.
Teams that track these metrics consistently, act on anomalies quickly, and benchmark their performance against the competitive landscape do not just grow faster. They allocate their budgets more efficiently, reduce wasted UA spend, and build sustainable advantages in a market where most competitors are still reacting instead of planning.
The tooling to do this well is more accessible than ever. Whether you are a solo developer, a studio UA manager, or an agency running campaigns across multiple titles, there is a purpose-built solution that fits your workflow and budget.
Ready to start tracking the metrics that actually matter? Explore FoxData's comprehensive mobile game analytics platform and see how the right data, surfaced at the right time, can transform the way you grow your game.
The five highest-impact metrics are keyword search visibility, store page conversion rate, retention rates at Day 1, Day 7, and Day 30, competitor download trends, and ARPU segmented by acquisition channel. These five metrics, tracked together, give you a complete picture of how to track mobile game performance across the full funnel from discovery to monetization.
Keyword rankings and store CVR should be reviewed weekly, since ranking fluctuations can happen quickly and early action limits the damage. Retention and revenue metrics are best reviewed on a monthly cohort basis, though you should set alerts for sharp day-over-day drops. Competitor benchmarking works well on a biweekly cadence for most teams.
Absolutely. In fact, smaller studios often benefit more from analytics tools than large publishers, because they have fewer resources to absorb the cost of guessing wrong. Purpose-built platforms like FoxData offer analytics solutions designed specifically for independent developers, providing access to keyword intelligence, competitor tracking, and store performance data without requiring a dedicated data team.
Competitor tracking helps you identify keyword opportunities your rivals are not fully capitalizing on, spot threats before they affect your rankings, and understand what creative and metadata strategies are working in your category. Research consistently shows that teams with regular competitive intelligence routines achieve higher organic growth rates than those relying solely on first-party data.
Ready to make your app shine? Optimize your app's visibility with FoxData, the ultimate ASO tool! Maximize downloads and rankings by leveraging our powerful insights today.
App Growth & ASO Tools by FoxData
FoxData supports every stage of app growth with specialized ASO and app analytics tools, helping teams improve keyword visibility, user acquisition, and retention through reliable data.
🔍 Store Keyword Research Tools
Research high-intent keywords, search volume, and competition to strengthen your app store optimization strategy.
📈 App Store Keyword Tools
Analyze keyword rankings and performance across the Apple App Store and Google Play to refine ASO execution.
📊 ASO Monitoring Tools
Monitor keyword ranking changes, visibility trends, and ASO impact over time with continuous performance tracking.
👥 User Activity Monitoring Tools
Understand in-app user behavior, engagement, and retention with real-time user activity analytics.
Together, these tools form FoxData’s ASO analytics and app intelligence ecosystem, designed to help developers, marketers, and growth teams make data-driven decisions and scale sustainably.
Explore it today!
👉 Learn more about FoxData here | 👉 Book a demo with FoxData team today!
© 2020-2026 FoxData. All Rights Reserved.
