


Explore More Possibilities for Your Business
Full-cycle scenario construction to meet your needs from App research, development, and release to operation.
Ready for your soaring growth

💡 Harness GameIQ deep game tags, global ad creative insights, precise download revenue predictions and player behavior analytics. Make every market decision backed by intelligence.
We address your challenges with tailored data-driven solutions for each pain point.
From insights to revenue, FoxData mobile game analytics solution integrates competitive intelligence, smart user acquisition, market predictions, and player value optimization.
Contact the FoxData Data Services Team
In the intensely competitive app market, a primary challenge for developers is gaining precise insights into user behavior and profiles to inform product iterations and operational strategies.
Have you repeatedly asked yourself these questions?
To assist developers in gaining a deeper understanding of user behavior, we are officially launching the "User Analysis Feature," which includes three core modules:
Leveraging multi-dimensional behavioral data and visualized trend graphs, this feature will provide deeper insights for your product operation decisions.
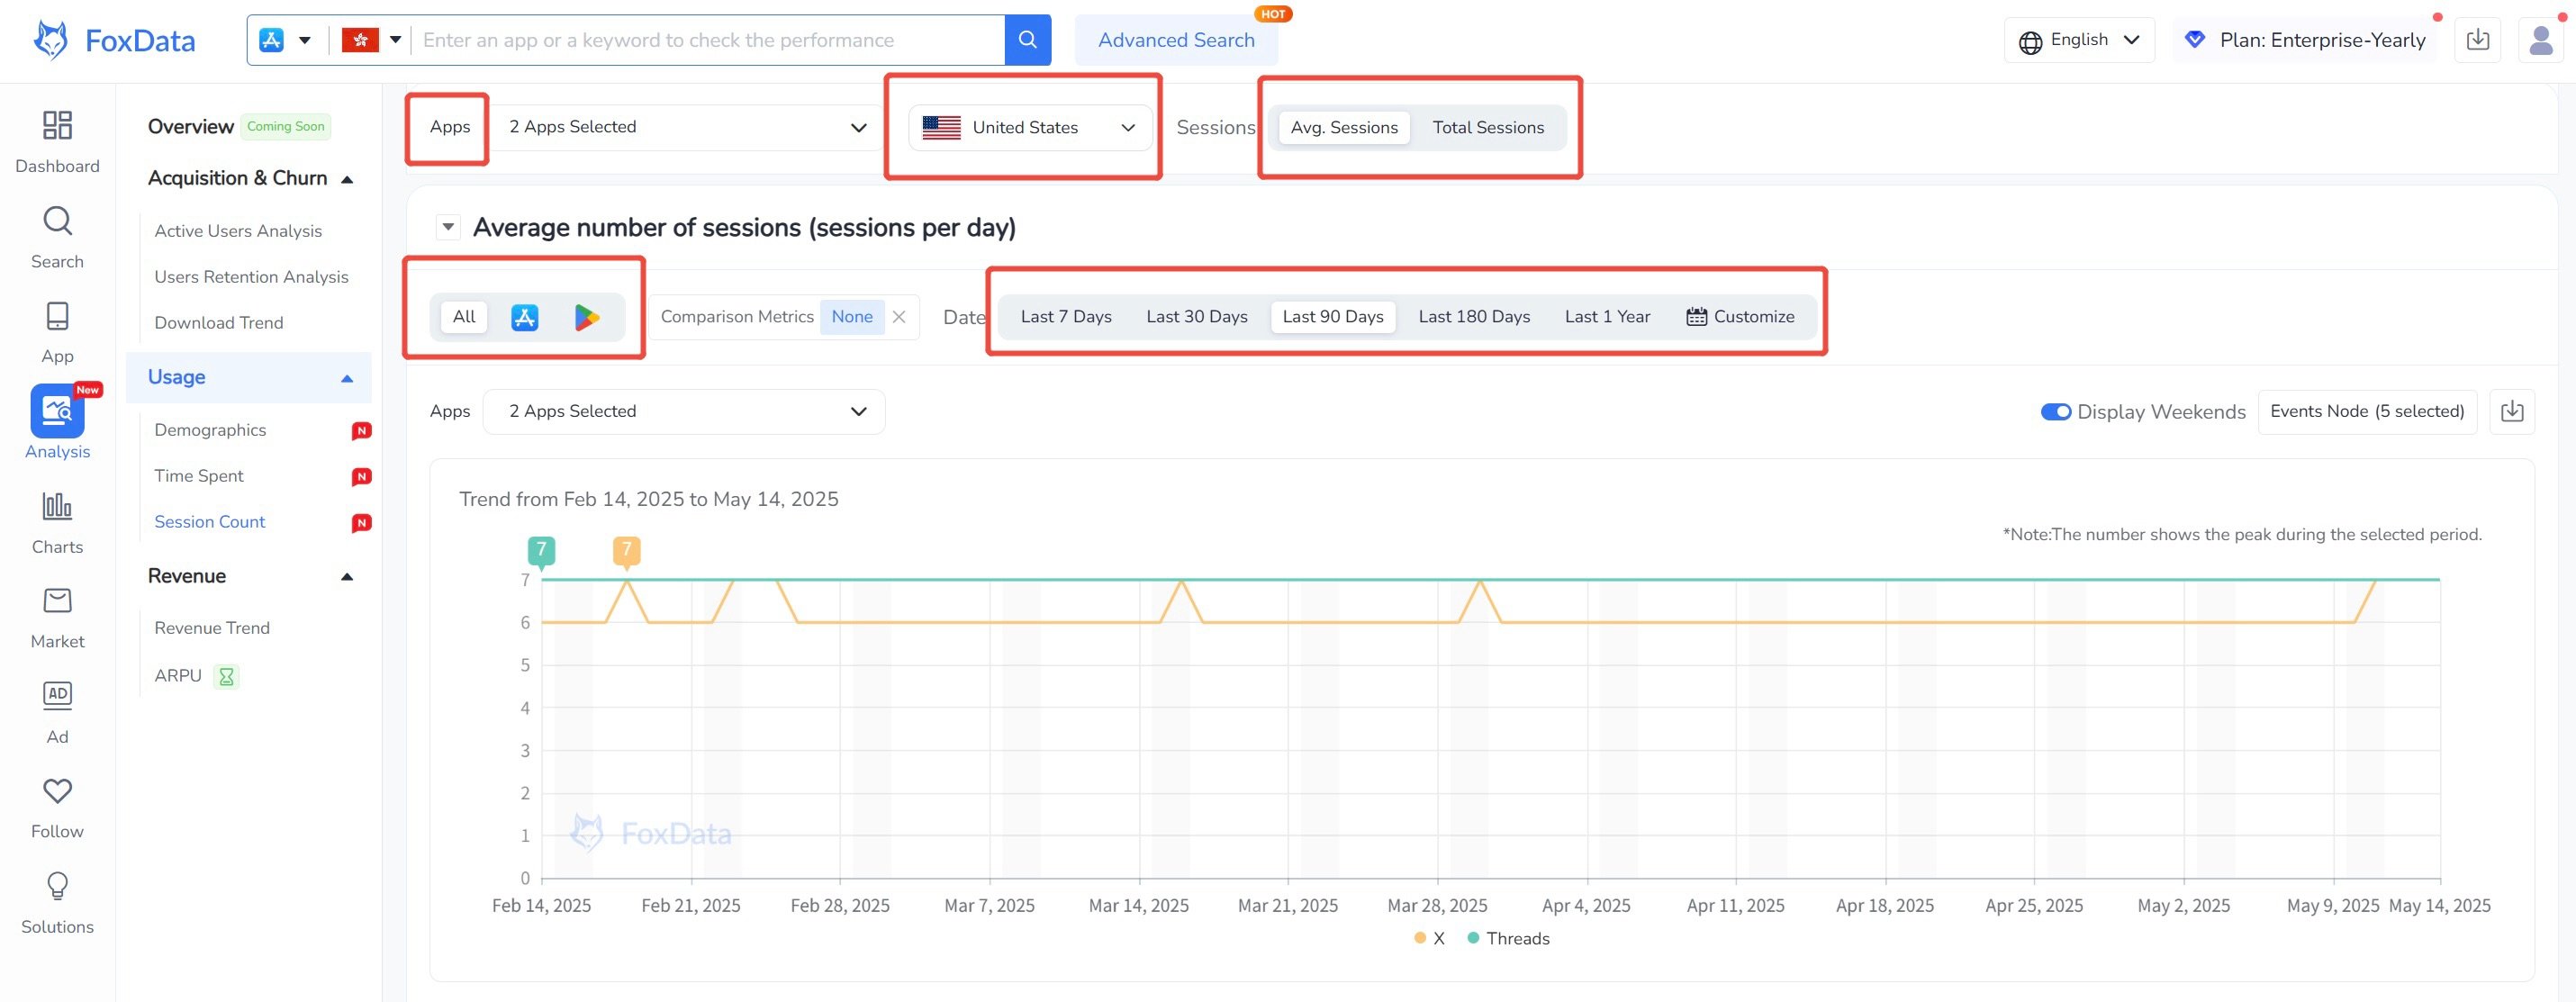
To quickly locate and enable the "User Analytics" feature, follow these steps:
【Analysis】 > 【Usage】>【Demographics】or 【Time Spent】or 【Session Count】
Within the user analysis section, you can navigate between views using three sub-modules, applying filters for time, region, and other criteria. Features include trend chart visualization, report exports, and version/channel comparisons to accommodate various needs.
We aim to move beyond data collection, enabling actionable insights:
Value Breakdown:
✅ Growth Tip:Prioritize operational efforts in high-rating, high-activity regions to drive regional viral growth.
Value Interpretation:
✅ Growth Tip: Decreasing user time isn't the issue; identify the cause—e.g., insufficient content update frequency, slow loading speeds?
Value Interpretation:
✅ Growth Tip: If a significant drop in daily conversations is observed, cross-reference with the 【Update Log】 timeline to quickly identify issues.
Now let’s take Duolingo (an online language learning app) as an example to demonstrate our [User Analysis Function].
Duolingo launched a new event, "Stay Sharp with Math Games!" on March 10, 2025. The team anticipated this feature would boost user engagement and learning duration. However, within two weeks of the launch, the team observed a significant drop in overall user activity and session counts, leading to stagnant user growth.
The operations team recognized an issue but struggled to identify the "what" and "who" of the problem. Previously, they needed to analyze multiple tracking metrics simultaneously, which was time-consuming and didn't guarantee a solution.
Navigate to the backend under [Usage] > [Time Spent], and select the "Compare one week before and after launch" timeframe:
Following the March 10th feature launch, average session duration increased by 9.12%, subsequently declining over time.
Total session count increased by 8.73%. Following a three-day stabilization period (March 10-12, 2025), total sessions gradually decreased.
Within the[Demographics], filtering by dimensions such as gender, age, and country/region reveals:
* Duolingo's user base is predominantly female, accounting for approximately 67.63% of total users.
* The core user demographic is concentrated in the 25-35 age bracket (most significant), followed by the 18-25 age group.
* The top 5 usage regions are India, the United States, Brazil, Russia, and Mexico.
This indicates:
1️⃣ Gender Skew Towards Females ➜ Potential Content Affinity Issues
Duolingo's primary users are often casual learners, favoring language, cultural, and travel-related content. Math challenges may be perceived as "science-oriented," "logically demanding," and "serious," potentially conflicting with female users' preference for gamified, contextualized "light knowledge" content.
2️⃣ Core Age Group: 18-35 ➜ Focus on Efficiency and Outcomes, Reluctance to Deviate from Core Objectives
3️⃣ Regions Led by Emerging Markets (India, Brazil, etc.) ➜ Math Games Not a Primary Need
📉 Inference: The activity strategy does not align with the actual learning needs of the primary markets, resulting in a lack of regional enthusiasm.
A: Not necessarily. The decrease in usage time may be caused by multiple factors, such as functional changes, lower content update frequency, seasonal fluctuations during holidays, or even a smoother user behavior path leading to higher task completion efficiency.
We suggest you combine:
Analyze together to find the core problem.
A: Yes, the regional distribution data is mainly based on the user's IP location, and is combined with the device system language, time zone and other multi-dimensional comprehensive judgments to ensure that the display is relatively accurate and representative of the user's origin.
⚠️ It should be noted that the distribution of devices in some regions may be biased due to VPN, cloud proxy or special network environment (such as global universal ROM). It is recommended to make an overall judgment based on the mainstream user behavior data.
A: Currently we support one-click export to Excel, so that your team can grasp the user dynamics at the first time without manually checking the data.
A: All data comes from cooperating third-party SDK tools, authorized user data, and large-scale model estimates. It is aggregated and calculated by the back-end and undergoes multiple layers of cleaning to ensure accuracy and timeliness.
A: Yes, FoxData provides comprehensive tutorials and support documents to help you make full use of the "User Analysis" function. You can find them on FoxData Blogs or Help Center.
A: Currently, the [User Analysis] function is an exclusive function of FoxData Enterprise Edition, Optional modules can be purchased according to different needs.
If your product is undergoing a rapid iteration phase, or you want to make market judgments, user grouping and channel optimization with higher data sensitivity, then the Enterprise Edition will provide you with a complete and systematic user behavior analysis solution.
🎯Subscribe to the Enterprise Edition now >
Open full-link user insights to provide a more forward-looking decision-making basis for product growth.
Users will not tell you directly where the problem is, but their stay time, active curve and usage frequency will.
FoxData[User Analysis]module helps product teams interpret motivations from behavior, improve product decision-making efficiency and user conversion level.
Try FoxData now to build a more sustainable product growth strategy.
© 2020-2026 FoxData. All Rights Reserved.
