


Explore More Possibilities for Your Business
Full-cycle scenario construction to meet your needs from App research, development, and release to operation.
Ready for your soaring growth
Not all mobile games should be measured the same way. A hyper-casual title and a mid-core RPG have almost nothing in common. Their players are different. Their revenue models are different. Their lifecycle is different.
Yet many studios apply the same analytics playbook to both. That mistake costs real money.
The mobile gaming market now generates roughly $92 billion in annual revenue. There are 3.2 billion active mobile gamers worldwide, with that number projected to reach 3.5 billion by end of 2026. These are not casual hobbyists. They are a segmented, diverse player base with completely different expectations depending on the genre they choose.
This article breaks down exactly how your mobile game analytics approach must shift based on genre. We cover the right KPIs, the right ASO signals, and the right questions to ask at every stage of your game's lifecycle.
Genre is not just a category on the app store. It determines how players engage, how long they stay, and how they spend. Your data framework needs to reflect that reality.
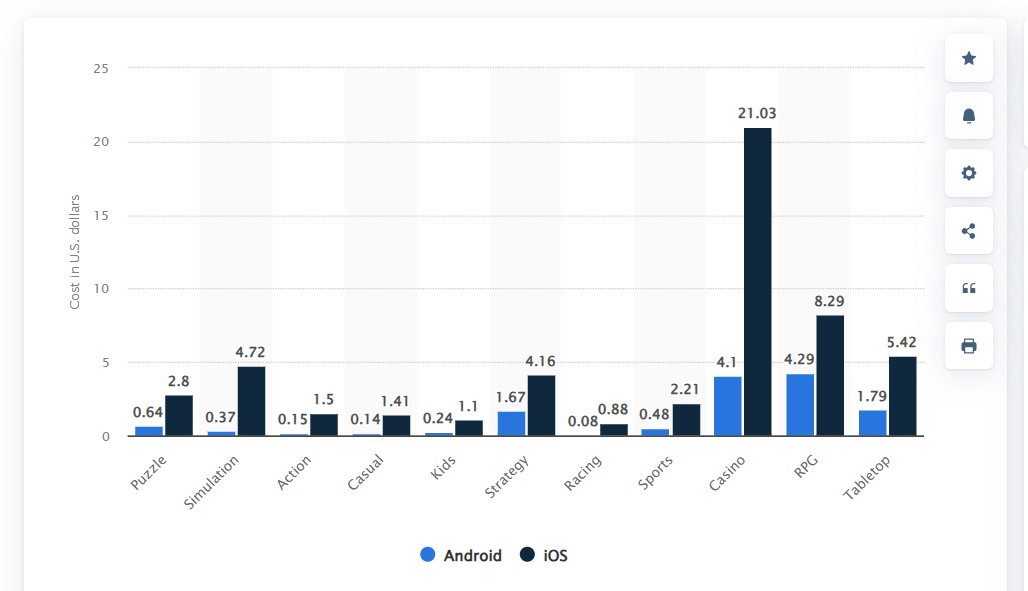
Start with the most obvious signal: cost per install. According to Liftoff and Singular's 2025 Casual Gaming Apps Report, the average CPI for casual games, including hyper-casual titles, was $1.41 on iOS and just $0.14 on Android between February 2024 and February 2025. Strategy, RPG, and shooter games sit considerably higher, with mid-core CPIs varying from around $2 on average to over $7 for shooter titles on iOS. That gap alone demands a completely different approach to measuring return on ad spend.
Retention benchmarks also diverge sharply. According to GameAnalytics data from over 16,000 live mobile games, the median D1 retention across all games in 2026 sits at approximately 22%. The median D7 retention is 3.4 to 3.9%, and 75% of projects see D28 retention fall below 3%. These are industry-wide medians, not targets. Understanding where your genre should sit relative to these numbers is what actually matters.
If you use one retention benchmark across two completely different genres, you will draw the wrong conclusions every time. Getting genre-calibrated data right is not optional. It is the difference between scaling a game and shutting it down.
Hyper-casual games live and die on volume and velocity. The core analytics framework is intentionally lean, built around rapid validation rather than long-term depth.
The KPIs that matter most:
The hyper-casual data loop is fast. A prototype should validate within one to two weeks. If D1 retention is too low or your D7 ROAS benchmark looks weak, kill the concept and move on. The genre rewards speed and decisiveness above all else.
ASO for hyper-casual is primarily about discoverability at volume. Your icon, screenshots, and short video preview must hook someone in under two seconds. Keyword targeting focuses on broad, high-traffic terms. Category rankings matter enormously because new players browse top charts, not search intent.

The biggest ASO signal in this genre is your install conversion rate on the product page. If your creative drives traffic but visitors do not install, your metadata and visual assets are misaligned. That gap is pure lost volume.
One important shift worth noting: hybrid-casual games, which blend hyper-casual mechanics with mid-core monetization layers, are now the genre's most active innovators. This monetization evolution means analytics for hyper-casual titles increasingly needs to account for both ad revenue and IAP simultaneously, not just impressions and ad fill rates.
For example, Paper.io 2 introduced 6 In-App Purchases, including Fistful of Gems, No Ads, Bucket of Gems, No Ads (Offer), Special Offer, and Skin Bundle.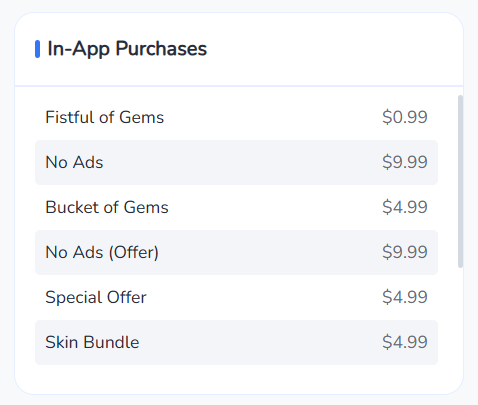
Paper.io 2 In-App Purchases | FoxData
Mid-core games require a completely different analytical lens. Here, you are not optimizing for volume. You are optimizing for value.
The KPIs that define mid-core success:
UA strategy for mid-core is far more selective than hyper-casual. D7 ROAS for mid-core on Android averages 6.1%, nearly double the iOS figure. However, iOS cohorts tend to deliver stronger long-term LTV. This means your platform mix and bidding strategy should reflect the LTV trajectory, not just the early ROAS signal.
According to Liftoff data, mid-core titles including strategy and RPG games on Android see D30 ROAS at 60% for strategy and 39% for RPG, outperforming the field on Android specifically. Use these benchmarks to set realistic payback windows before you scale.
ASO for mid-core is driven by search intent. Players actively look for specific experiences like "turn-based RPG," "guild war strategy game," or "offline fantasy RPG." Your keyword strategy must target these high-intent terms.
Ratings and reviews carry significantly more weight than in hyper-casual, because mid-core players research before they download.
Seasonal events, update cadence, and competitive positioning also affect ASO rankings in this space. Mid-core games compete in top-grossing charts, not just top-download charts. That requires a different optimization mindset entirely.
Understanding the theory is step one. Applying it with the right toolset is what actually moves the needle.
For hyper-casual teams, the priority is speed and iteration. You need rapid A/B testing on creatives, real-time CPI feeds, and fast ASO iteration on icons and short preview videos. Tracking IPM trends across ad networks, alongside daily retention snapshots, gives you the signal you need to decide within two weeks whether to scale or kill a title.
For mid-core teams, the data stack needs more depth. Cohort analysis across 30 to 90 days is essential. You need segmentation by geography, device, and acquisition channel to understand which user groups convert to payers and which simply churn. LTV modeling by acquisition source tells you where to concentrate UA spend and how aggressively to bid.
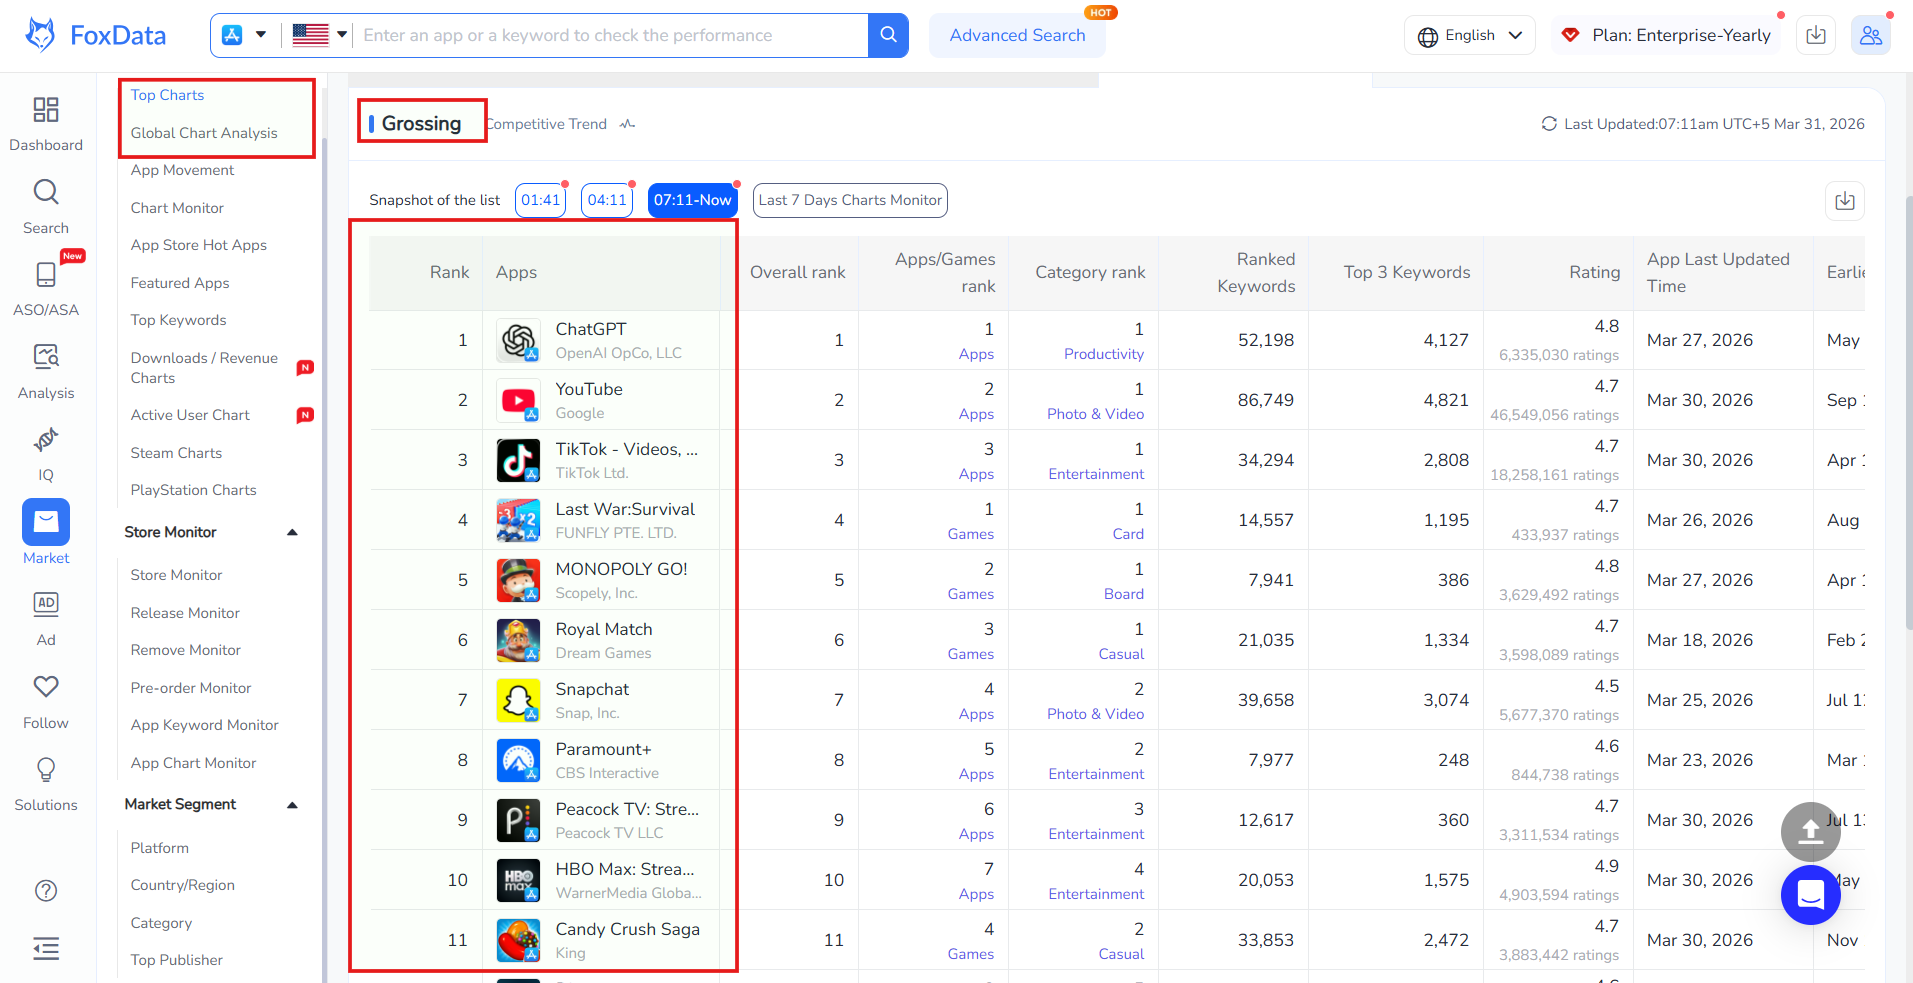
This is where purpose-built mobile game analytics platforms deliver real value. FoxData's mobile game analytics solution gives studios the ability to track performance across genres with the depth and speed each requires, from ASO keyword tracking and store performance metrics to competitive intelligence and UA data.
Rather than piecing together fragmented data from multiple tools, a unified platform lets your team see the full picture: store rankings, keyword movements, competitor positioning, and creative performance in one place. For mid-core titles running long-tail keyword strategies, tracking rank changes over weeks is critical.
For hyper-casual teams testing new creative concepts daily, fast feedback on app store conversion is what matters.
Teams using data-driven ASO and game performance analytics can also benchmark their game against category leaders. In a market where global in-app ad spend is projected to reach $390 billion by end of 2026, knowing exactly where you stand in keyword rankings and store visibility is not optional. It is table stakes.

Discover how FoxData enhances data protection and security standards to keep your analytics safe and reliable.
1. Using the same retention benchmarks for both genres.
A D1 rate of 22% is the industry median across all games, but it is not acceptable for mid-core, where 35% is the minimum target. Using one standard across genres will produce false confidence or false panic. Set genre-specific thresholds before you launch.
2. Ignoring ASO search intent in mid-core.
Hyper-casual wins on broad visibility. Mid-core wins on search relevance. Studios that optimize mid-core titles for download volume rather than keyword intent attract low-quality users who churn quickly. Every metadata element should signal value to the player who actively wants your specific experience.
3. Chasing install volume instead of LTV in mid-core.
More downloads do not equal more revenue in a genre where conversion to paying users typically falls below five percent. A smaller cohort of high-intent users, acquired at a higher CPI but with a strong LTV signal, will outperform a mass install campaign every time.
4. Failing to model IAP and ad revenue together in hybrid titles.
As more games blend hyper-casual mechanics with mid-core monetization layers, the total LTV calculation becomes the most critical number you have. Studios that model only ad revenue or only IAP will underprice their UA bids or overspend on low-quality cohorts. Track both revenue streams together from day one.
5. Not updating your ASO strategy as the game matures.
App store algorithms reward active products. A mid-core game that stops refreshing creative assets, ignores new keyword trends, or fails to respond to competitor moves will see rankings erode over months. ASO is not a launch activity. It is an ongoing function that requires consistent attention.
Genre is not a label. It is the entire context in which your game competes, monetizes, and retains players. A hyper-casual analytics playbook applied to a mid-core RPG will produce wrong decisions at every stage: wrong UA bids, wrong retention targets, wrong ASO priorities.
The studios winning in 2026 are not those with the biggest budgets. They are the ones asking the right questions of the right data, calibrated to the genre they are actually building.
If you are ready to align your analytics, ASO, and UA strategy to your genre, start with the right platform.
Stop guessing with generic benchmarks. FoxData's mobile game analytics platform gives you genre-level intelligence, competitor tracking, and ASO insights built specifically for mobile game studios that need to move fast and measure what actually matters. Explore FoxData's solutions and start making your data work for your game.
Q: What are the most important KPIs for a hyper-casual game launch? Focus on CPI, D1 retention, IPM, D7 ROAS, and ARPDAU. According to 2025 Liftoff and Singular data, the average casual CPI is $1.41 on iOS and $0.14 on Android. Your D1 target should be 40% or higher. If early signals miss these thresholds before scaling spend, reassess the concept first.
Q: How is mid-core ASO different from hyper-casual ASO? Mid-core ASO centers on search intent. Players search for specific game types, so keyword targeting must reflect high-intent terms. Ratings, reviews, and update frequency carry more weight because mid-core players research games before downloading. Hyper-casual ASO focuses on broad visibility and icon-level creative performance.
Q: When should a studio start tracking LTV cohorts for a mid-core game? Start from Day 1 of soft launch. LTV modeling requires cohort data over 30 to 90 days minimum. Waiting until global launch to build this picture leaves you bidding blind on UA and operating without a reliable monetization health signal.
Q: How does hybrid monetization affect analytics for casual games? Hybrid titles that combine ad revenue and IAP require a blended LTV model that accounts for both streams simultaneously. Studios that model only one revenue source will produce incomplete LTV estimates and set incorrect UA bid ceilings, either underinvesting or overspending against actual profitability.
Ready to make your app shine? Optimize your app's visibility with FoxData, the ultimate mobile app analytics and ASO tool! Maximize downloads and rankings by leveraging our powerful insights today.
App Growth & ASO Tools by FoxData
FoxData supports every stage of app growth with specialized ASO and app analytics tools, helping teams improve keyword visibility, user acquisition, and retention through reliable data.
🔍 Store Keyword Research Tools
Research high-intent keywords, search volume, and competition to strengthen your app store optimization strategy.
📈 App Store Keyword Tools
Analyze keyword rankings and performance across the Apple App Store and Google Play to refine ASO execution.
📊 ASO Monitoring Tools
Monitor keyword ranking changes, visibility trends, and ASO impact over time with continuous performance tracking.
👥 User Activity Monitoring Tools
Understand in-app user behavior, engagement, and retention with real-time user activity analytics.
Together, these tools form FoxData’s ASO analytics and app intelligence ecosystem, designed to help developers, marketers, and growth teams make data-driven decisions and scale sustainably.
Explore it today!
👉 Learn more about FoxData here | 👉 Book a demo with FoxData team today!
© 2020-2026 FoxData. All Rights Reserved.
