How to Make Informed Decisions for Global App Marketing and Development Strategies With "Global Overview"
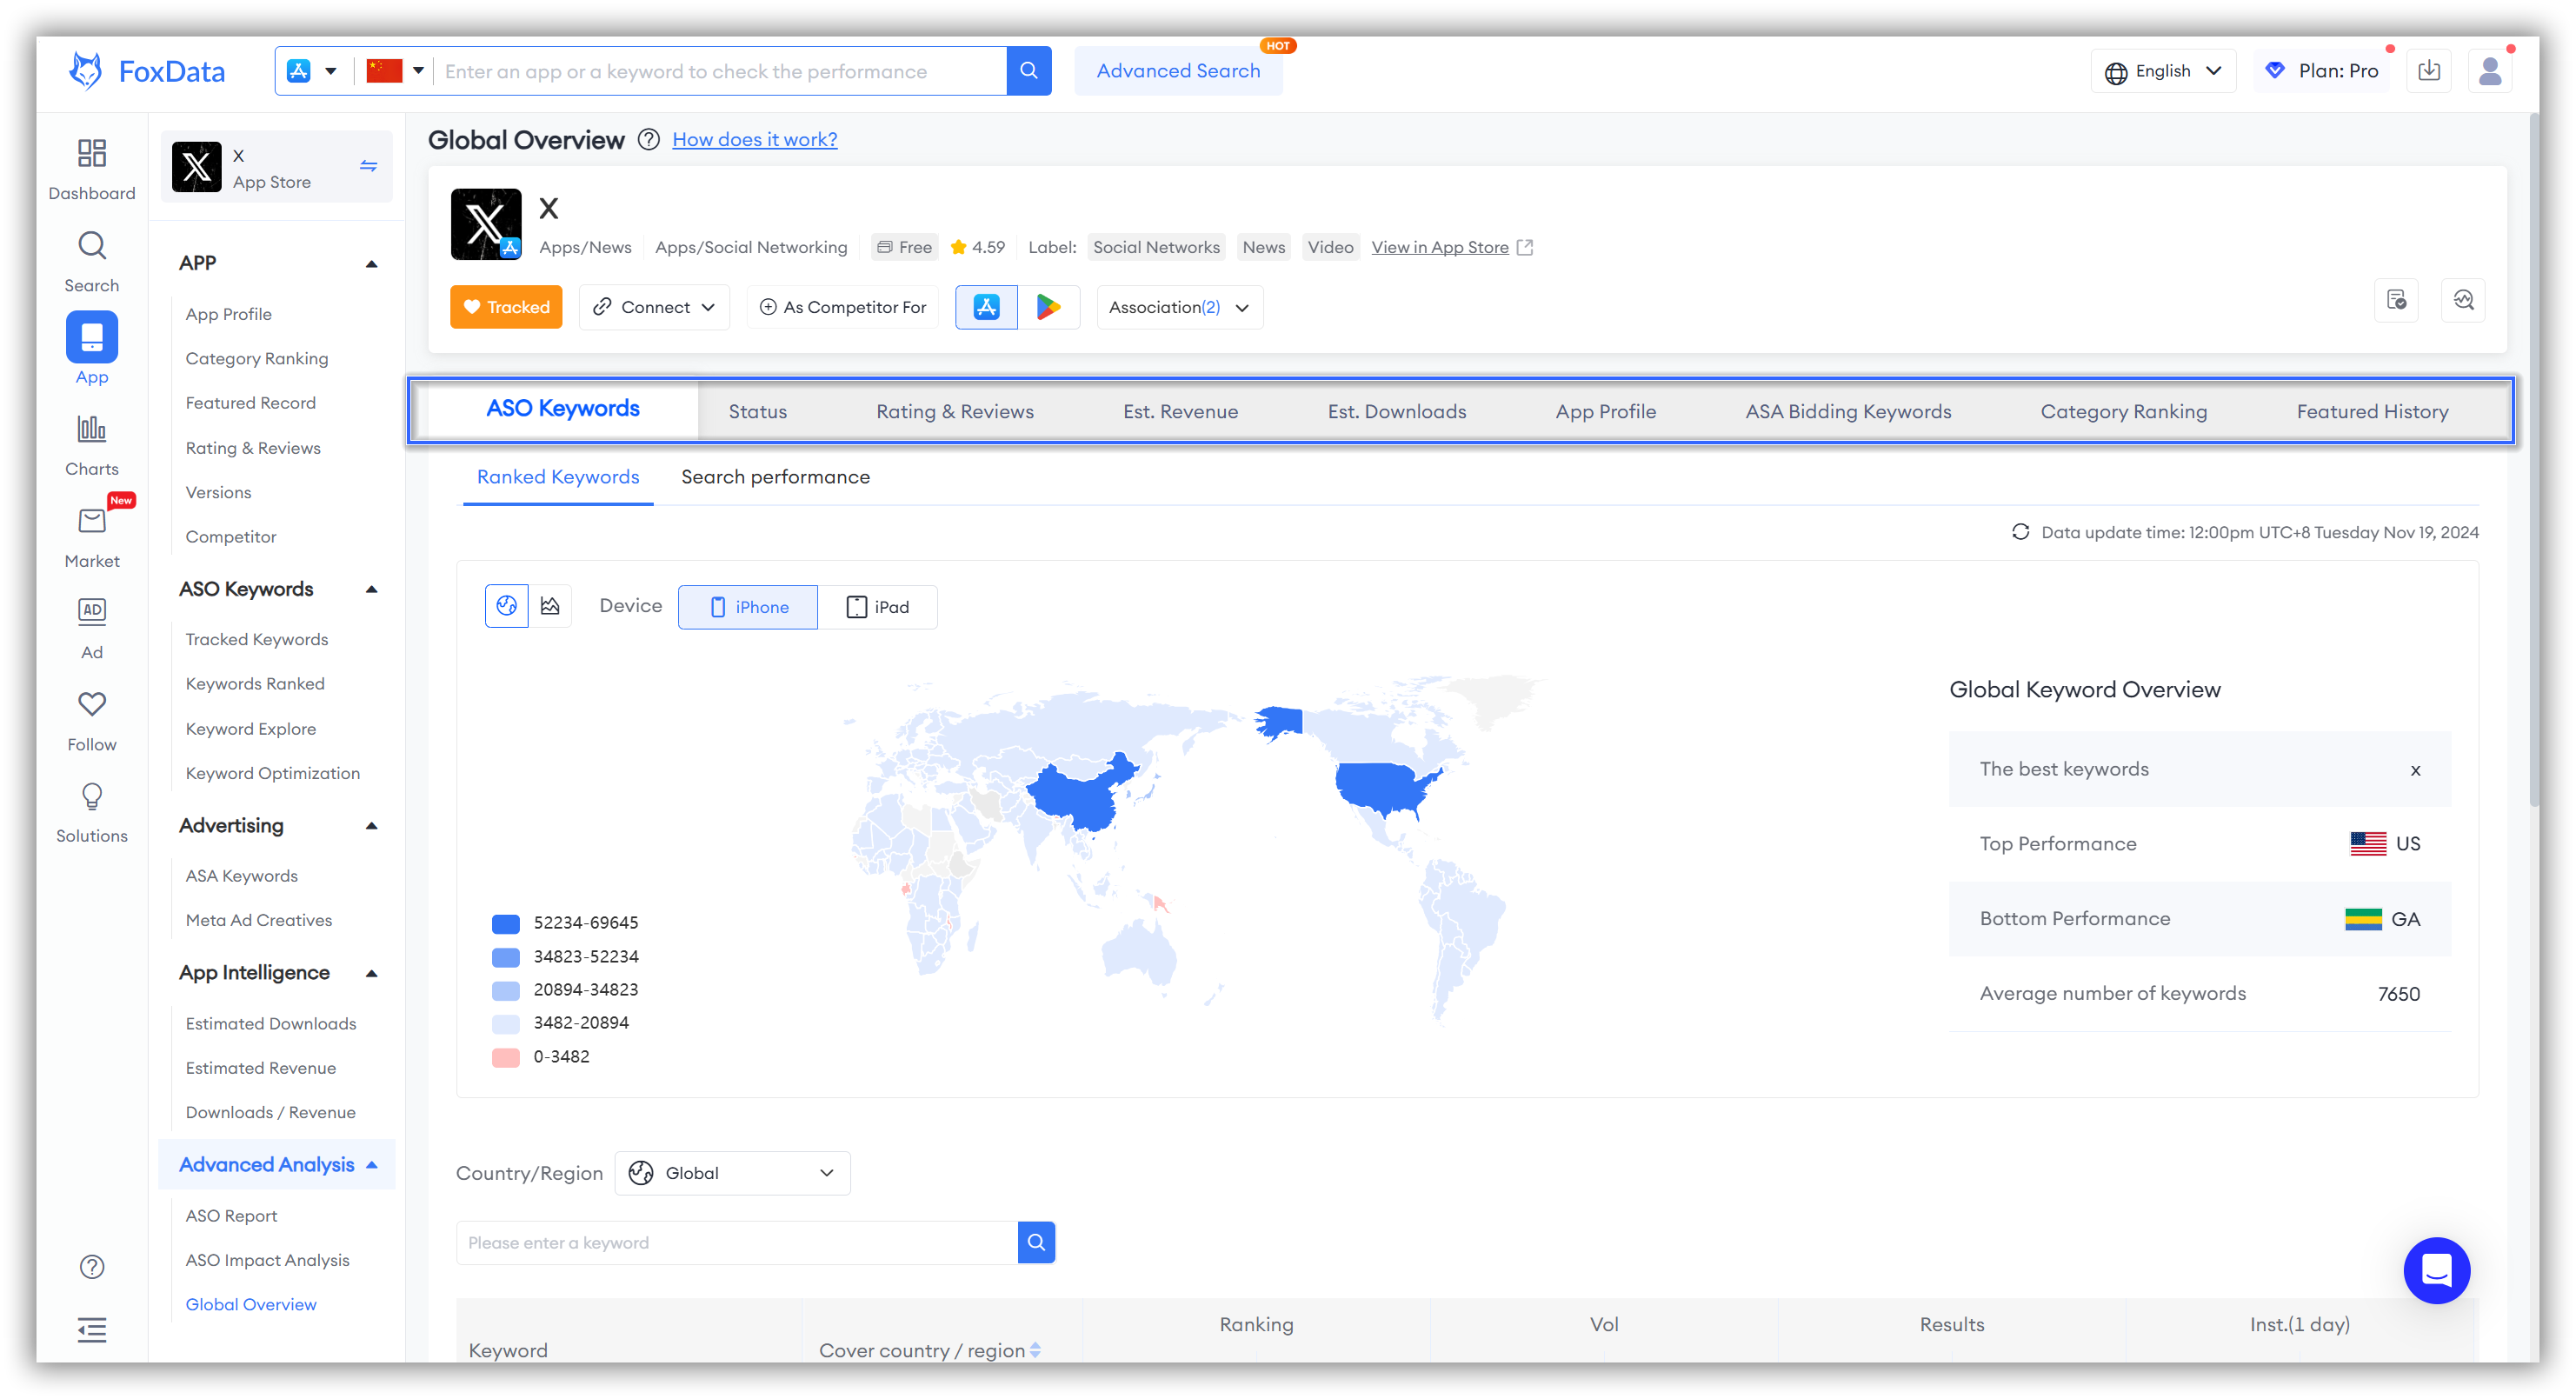
The "Global Overview" feature of FoxData consists of 9 sections: "ASO Keywords", "Status", "Rating & Reviews", "Est. Revenue", "Est. Downloads", "App Profile", "ASA Bidding Keywords", "Category Ranking", and "Featured History".
🗒️ Note: In December 2024, FoxData added the "Competitor" feature to the Global Overview in addition to the nine sections above.
💡 Read More: How to Discover New Market Opportunities With "Global Overview-Competitor"
How to use "Global Overview"
To view key Rating&Reviews metrics and insights:
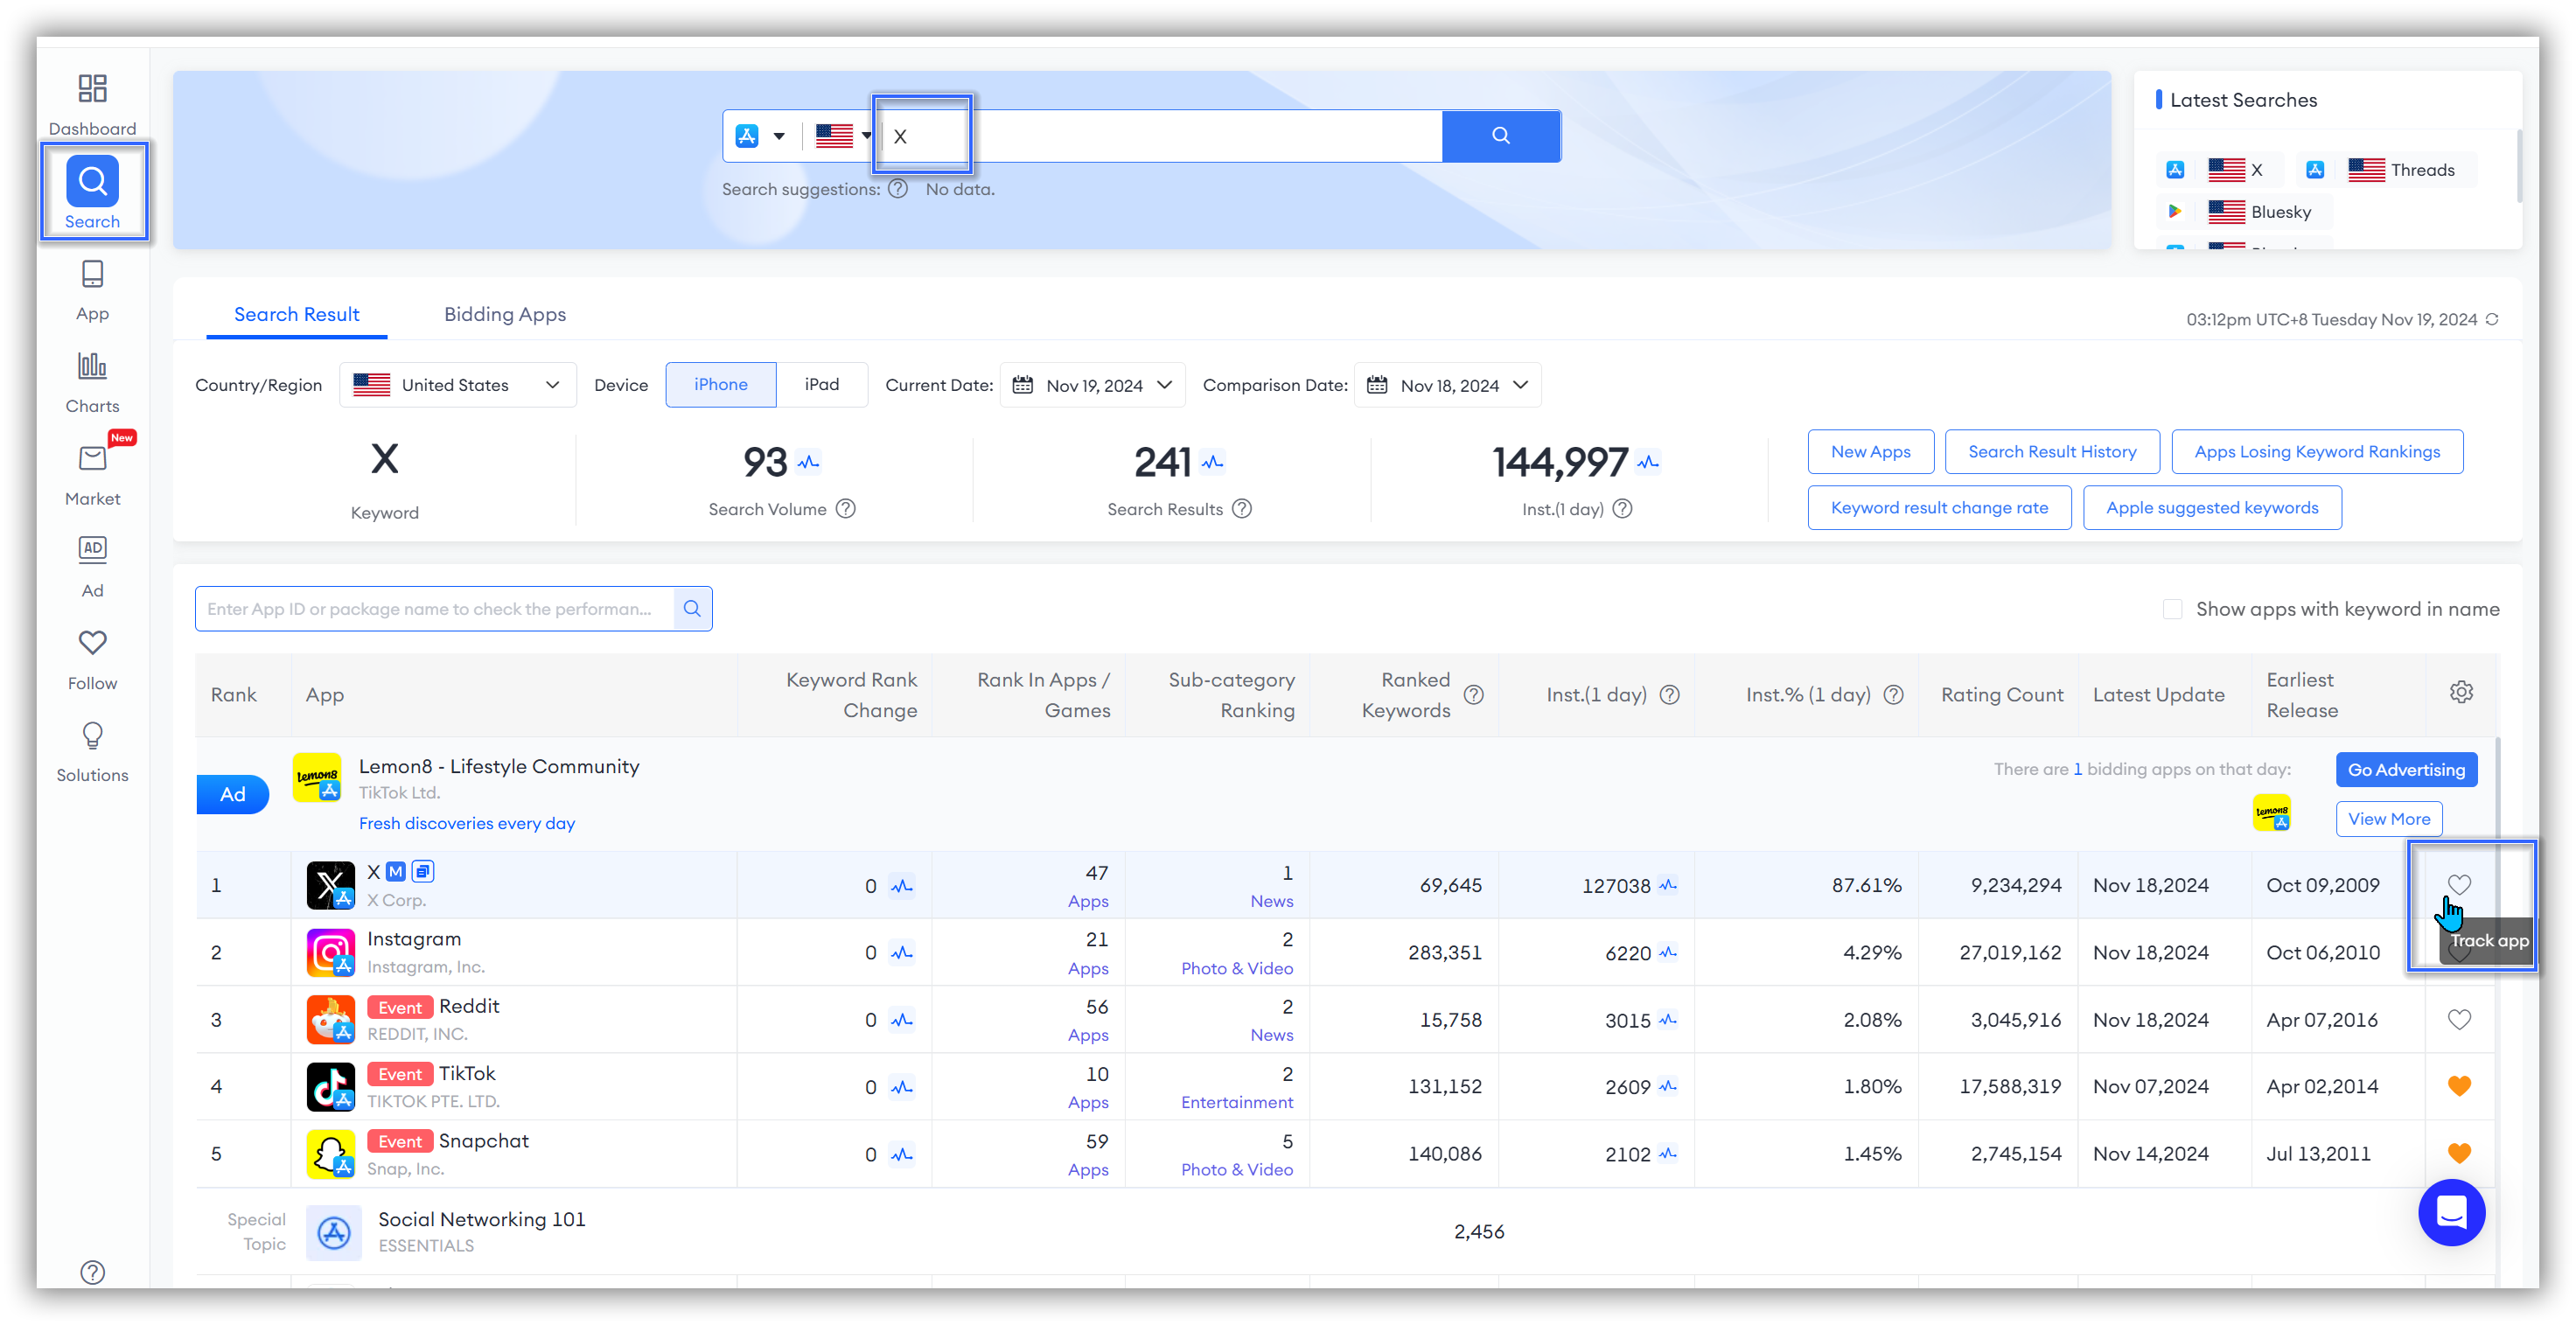
- Go to Dashboard > Search.
- Enter the app or game you'd like to analyze.
- To target your analysis, click "Track app" to reach the "App" overview page.
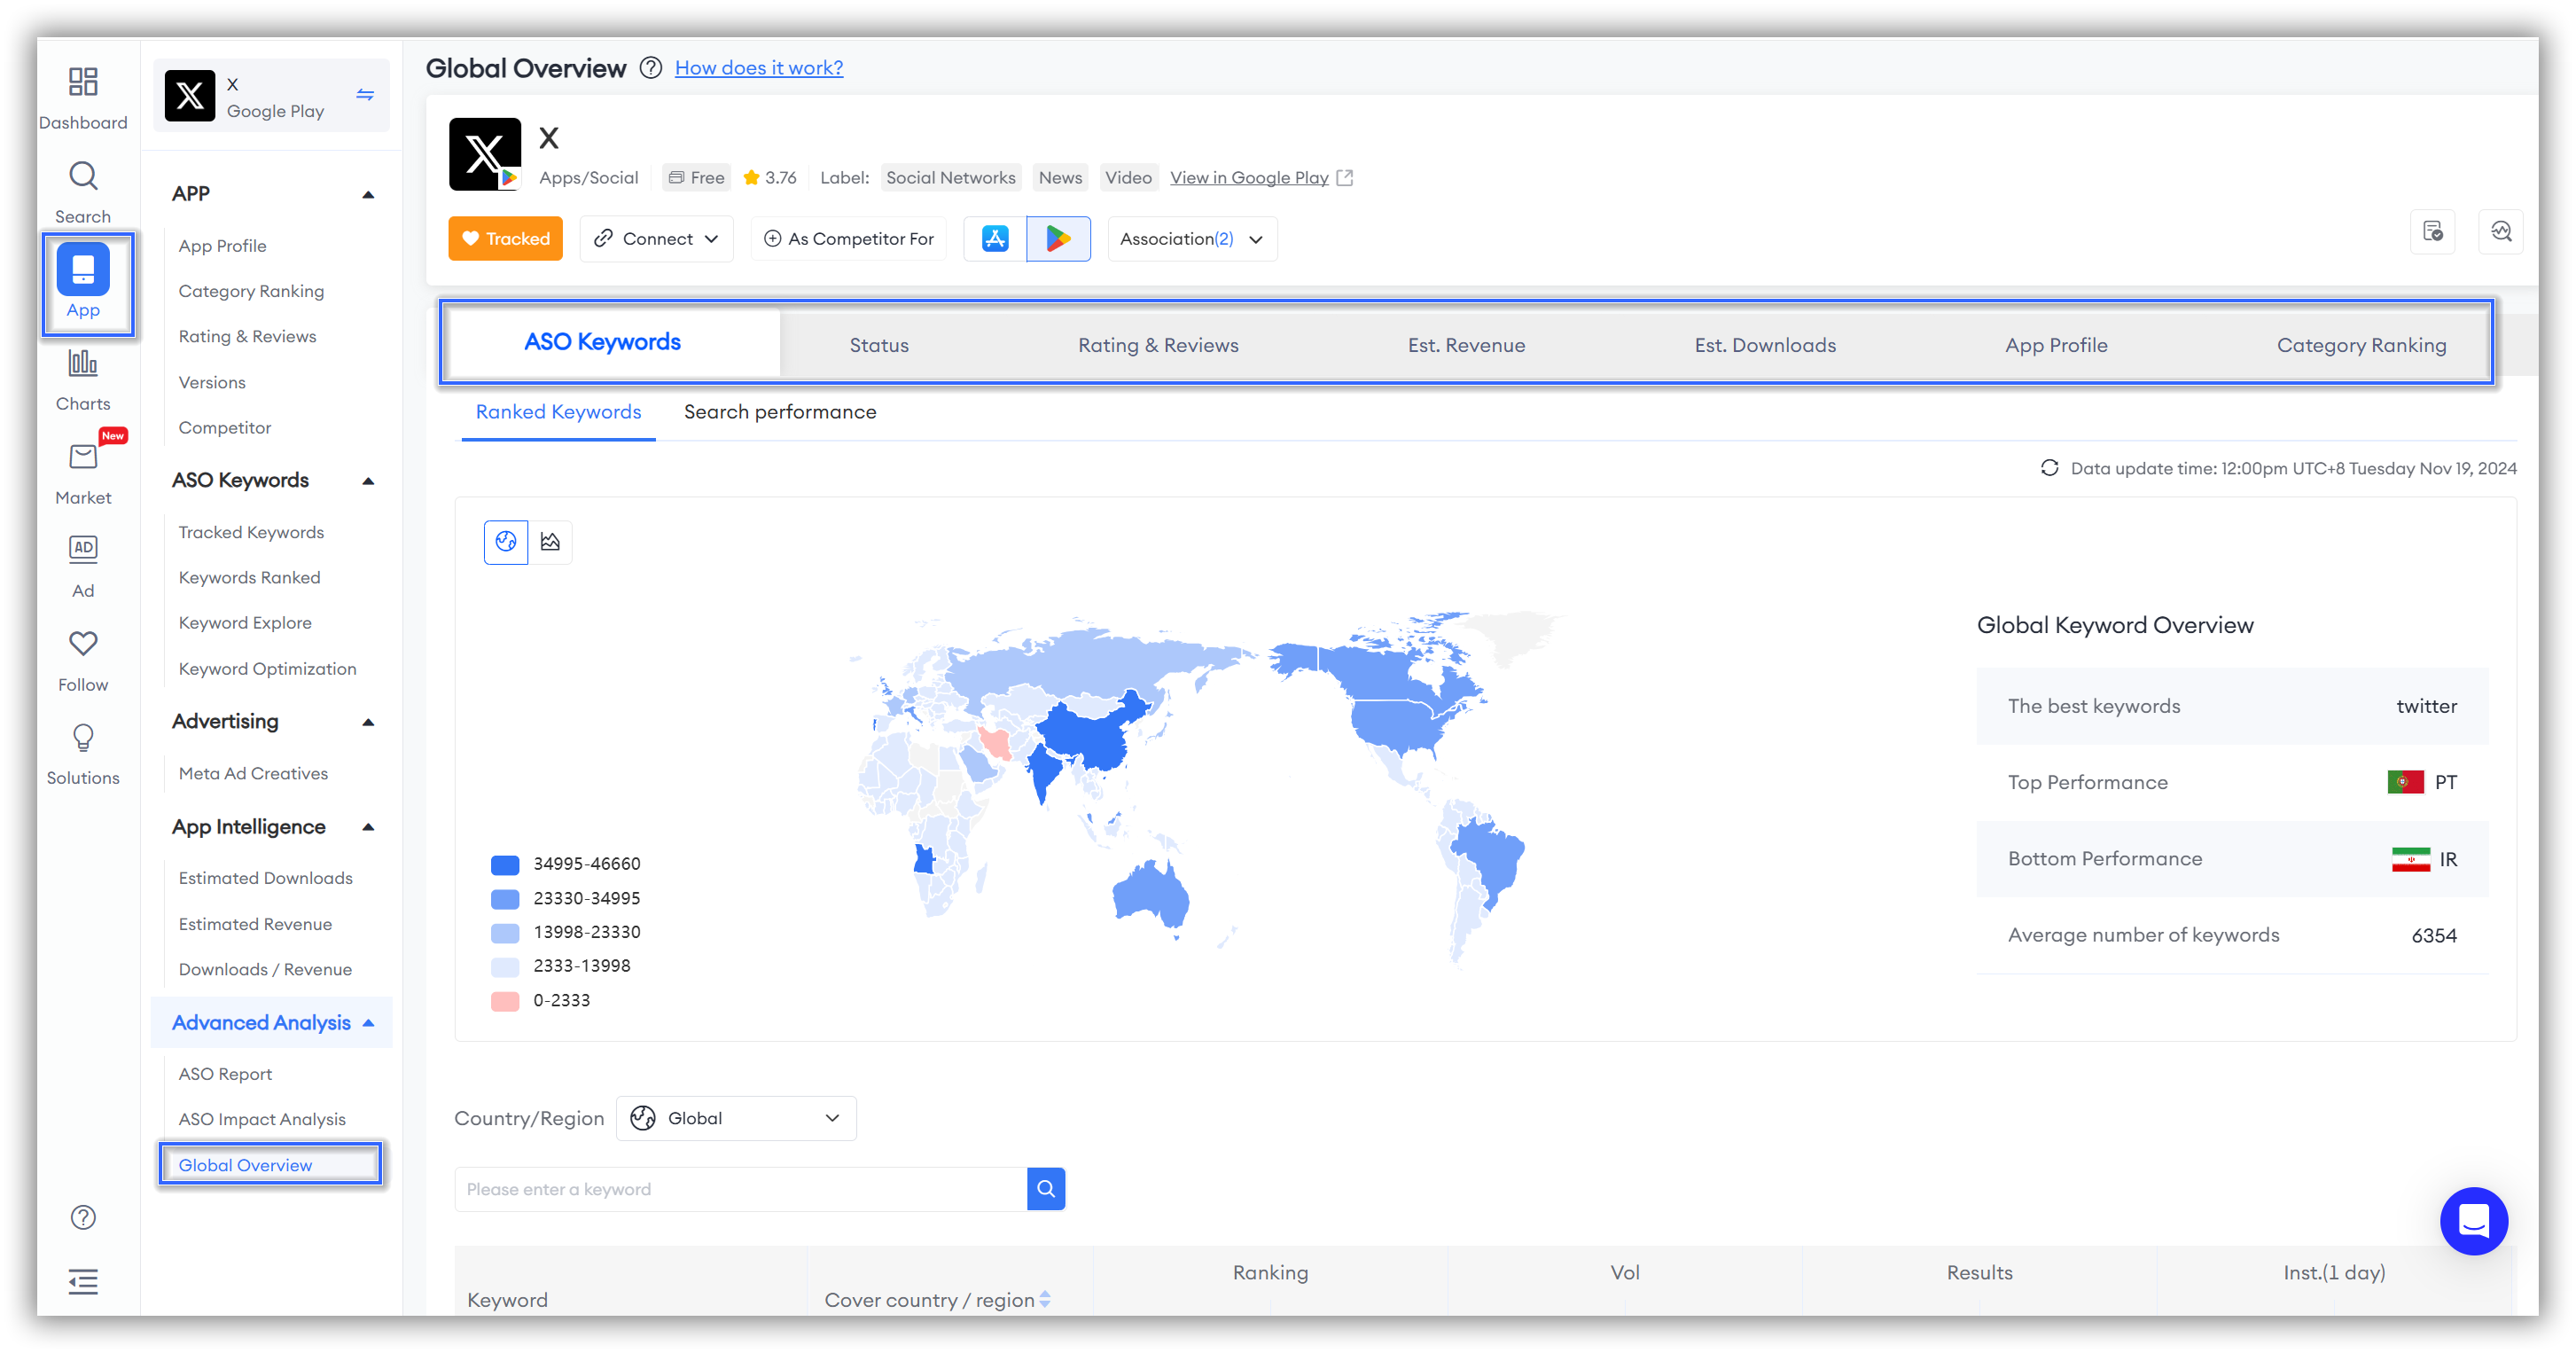
- To click "Global Overview" and then you can view "ASO Keywords", "Status", "Rating & Reviews", "Est. Revenue", "Est. Downloads", "App Profile", "ASA Bidding Keywords", "Category Ranking", and "Featured History".
🗒️ Note: In the App Store, this feature encompasses all 9 sections mentioned above.
However, on Google Play, it includes only 7 sections: "ASO Keywords," "Status," "Rating & Reviews," "Est. Revenue," "Est. Downloads," "App Profile," and "Category Ranking."
This difference arises because "ASA Bidding Keywords" and "Featured History" are exclusive to the App Store in the broader app market.
Key Metrics & Insights
1. ASO Keywords
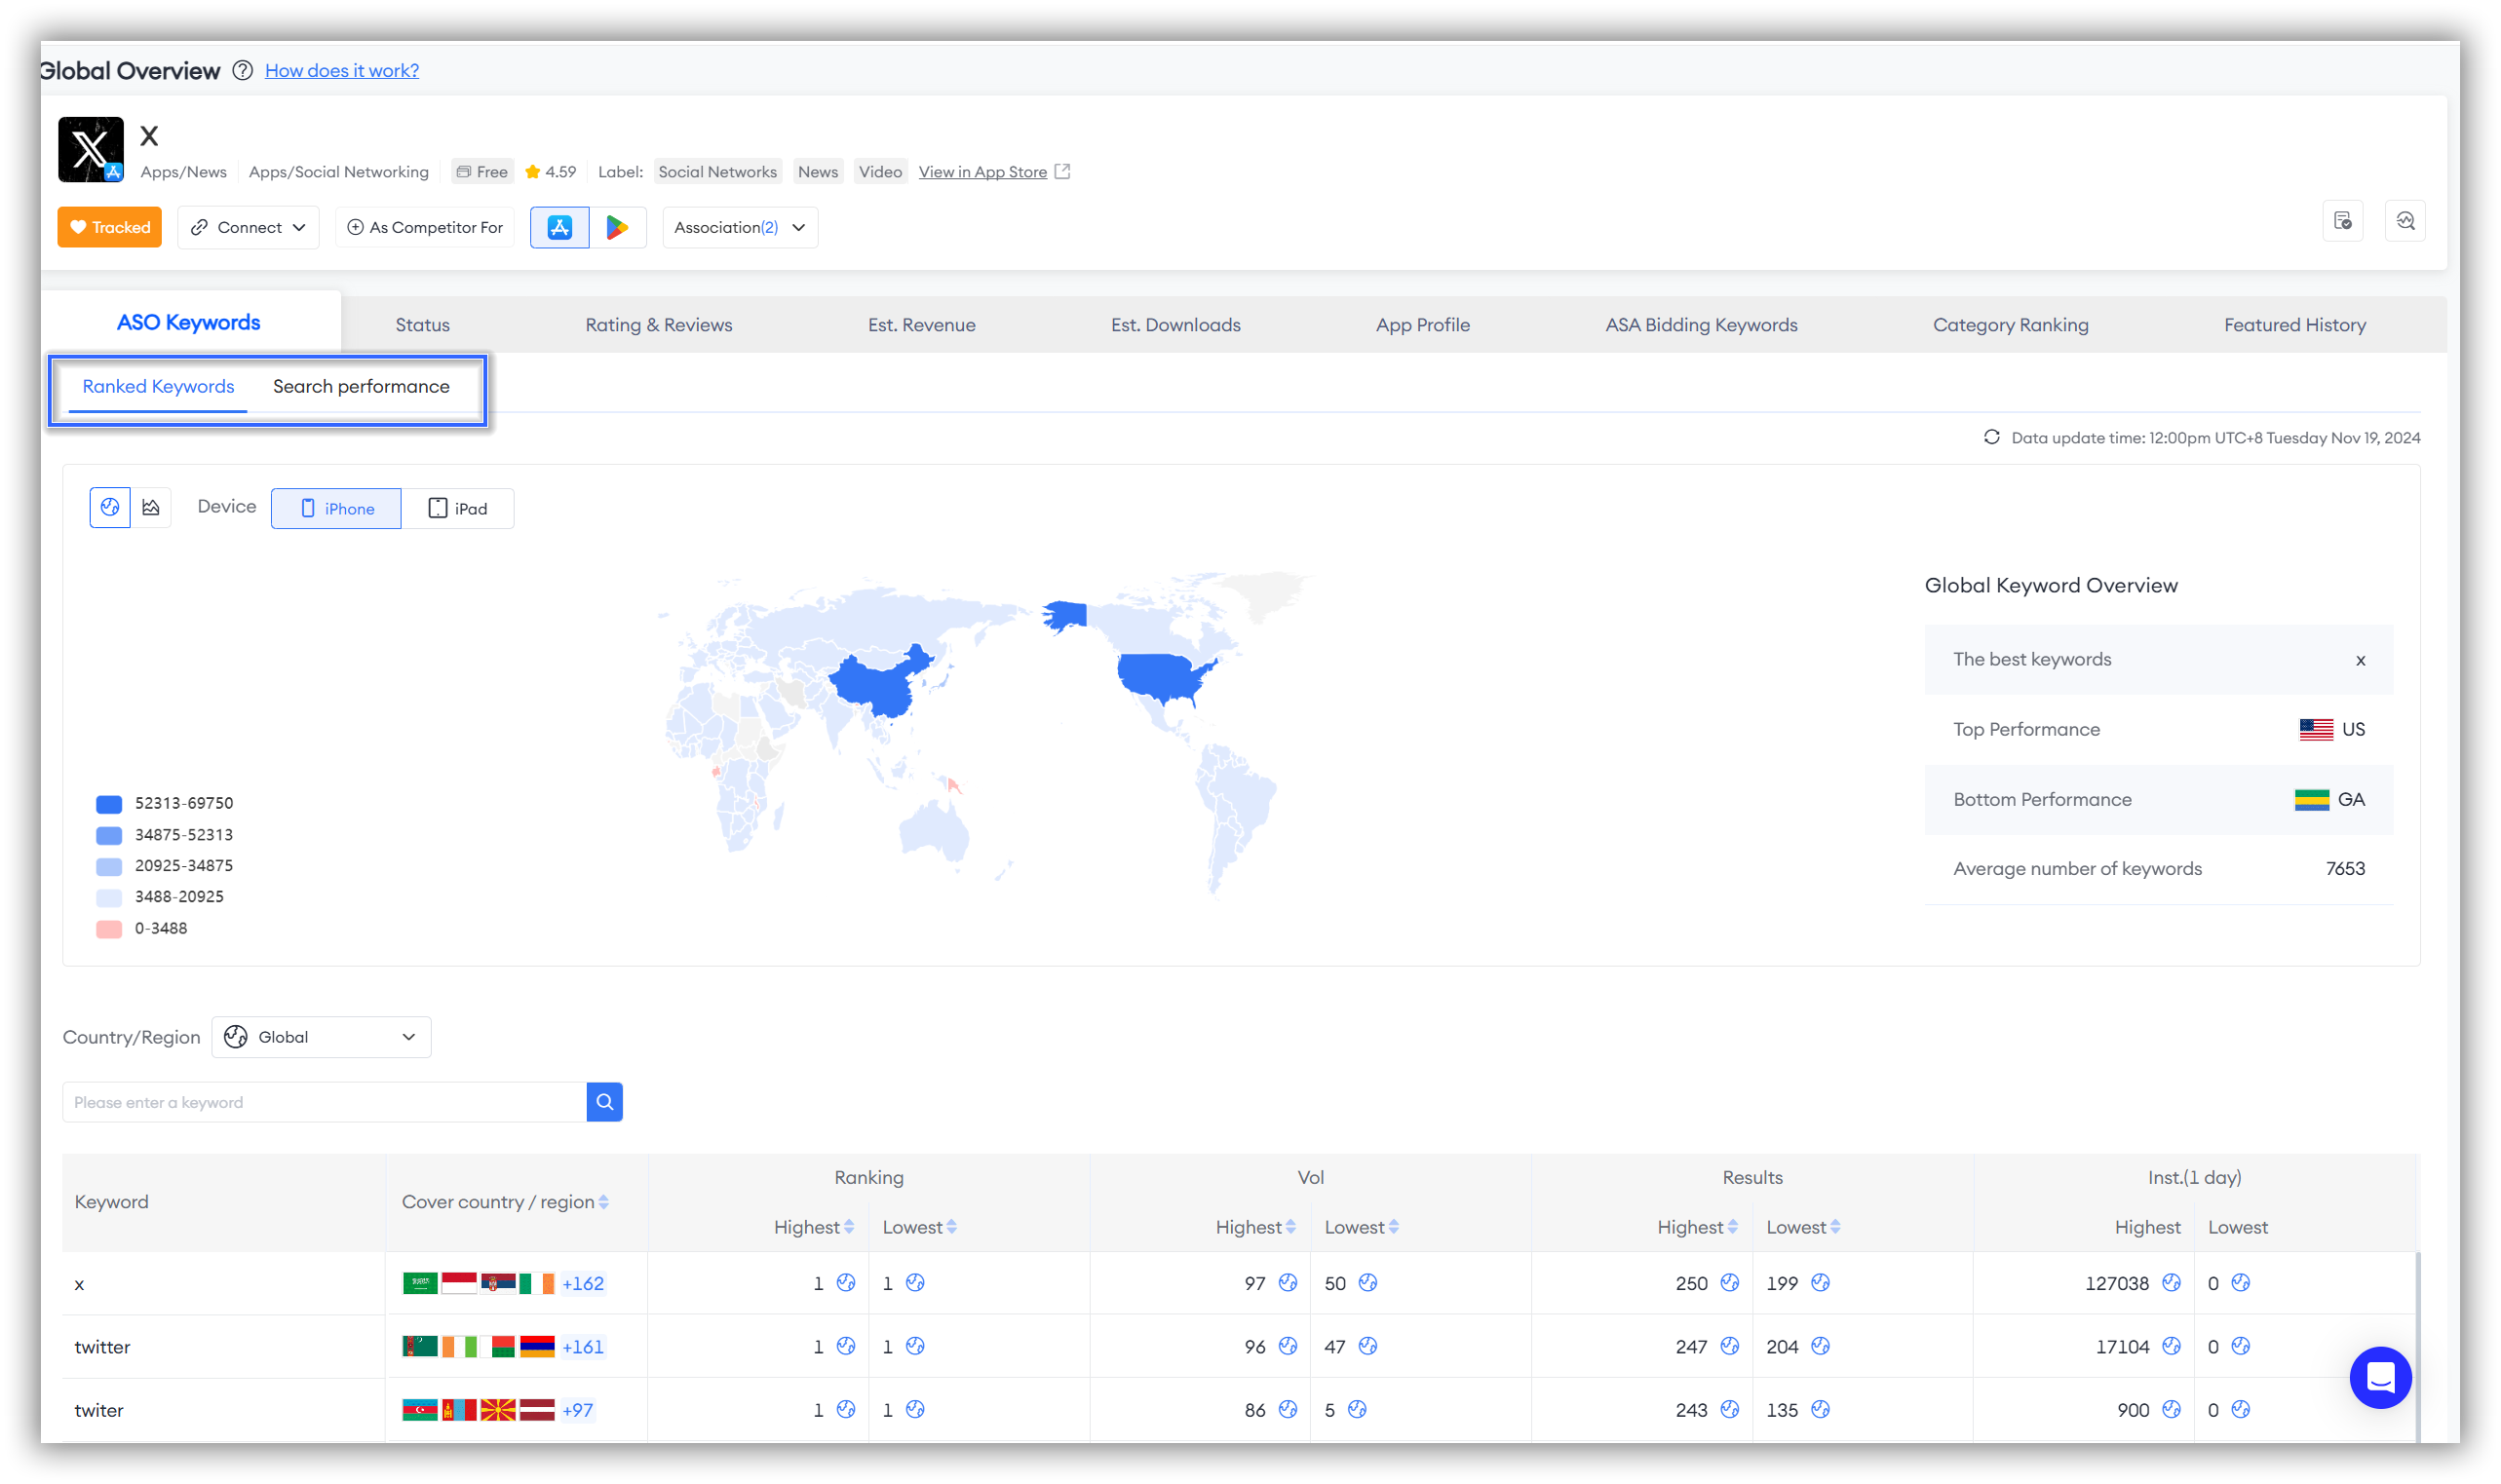
👏Expert Tips: You can switch between these sections based on your needs. However, if you're unsure where to start, FoxData recommends beginning with "Ranked Keywords" before moving on to "Search Performance."
The sections "Ranked Keywords" and "Search Performance" both include the map above and detailed data below. The visual data map at the top presents complex data in a graphical format, making it easier for you to understand and analyze the global performance of keywords.
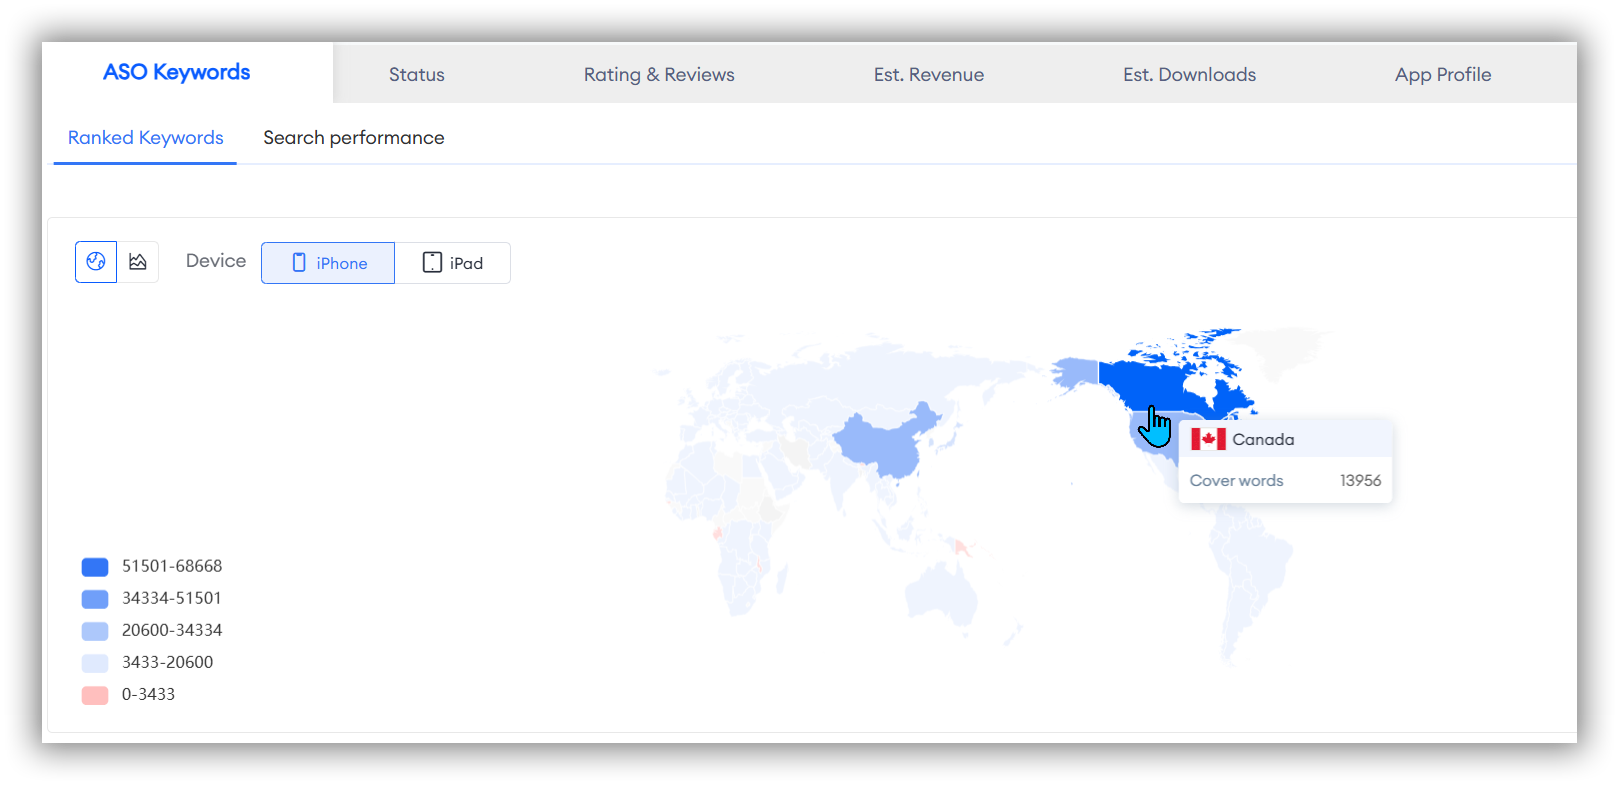
There are two ways to study the map data mentioned above.
- The first method allows you to view the global overview. Here's how it works:
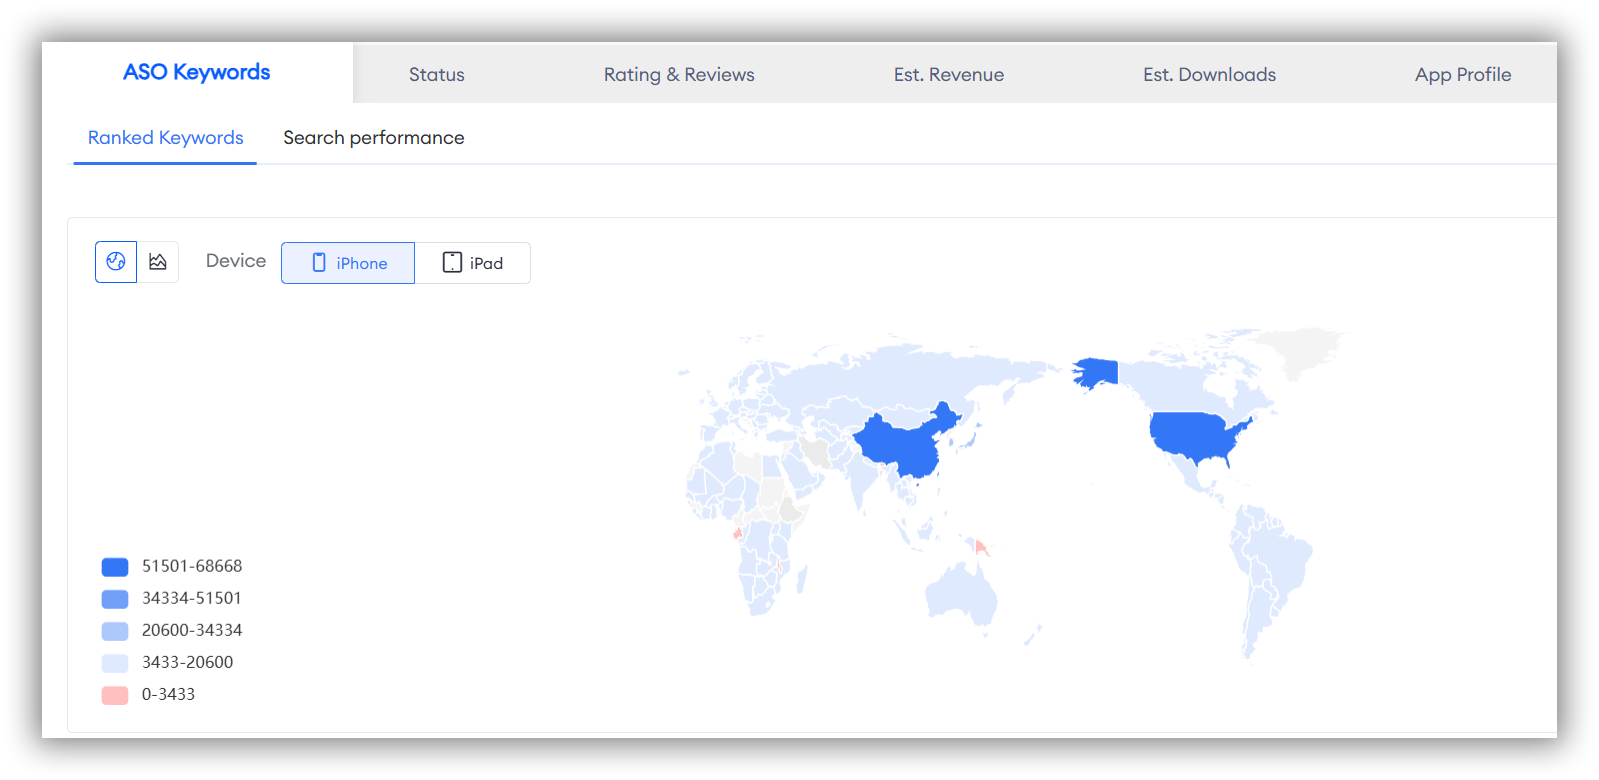
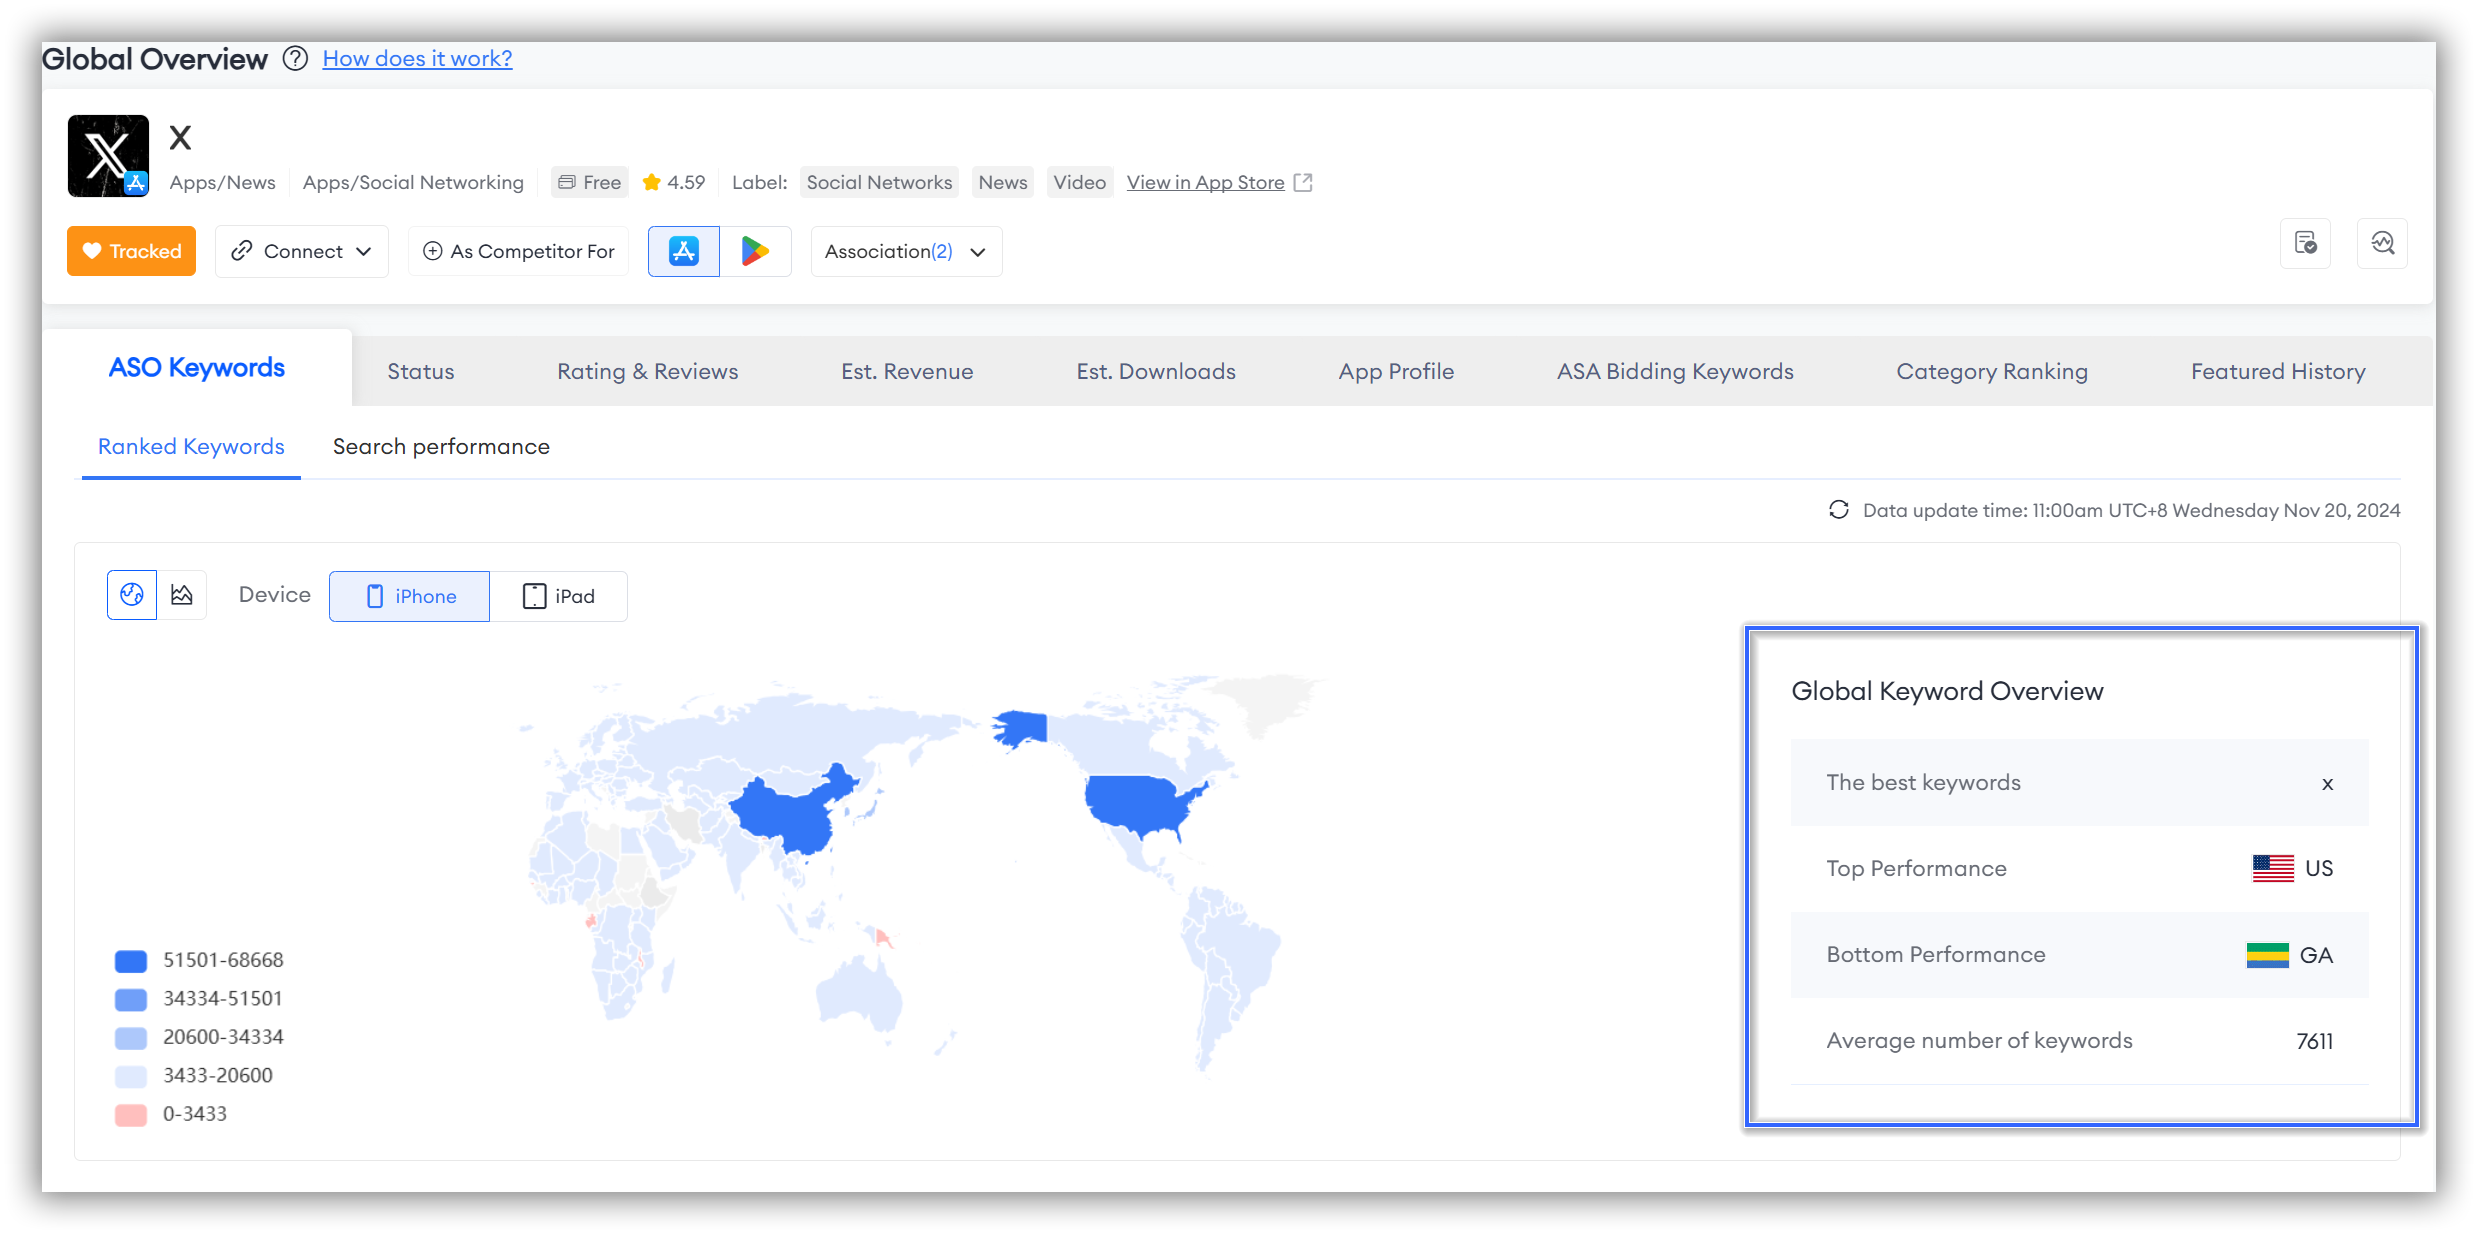
When you first open the page, you'll see different colors on the left side representing various data. The map on the right corresponds to these colors, representing different data points.
The deeper the shade of blue, the higher the number of keywords; conversely, lighter shades indicate fewer keywords, with red representing the lowest data volume.
- The second method allows you to conduct a more precise and personalized study of the regions you are interested in. Here's how it works:
Simply hover your mouse over the ranking data axis on the left or the map on the right.
Ranked Keywords
Ranked Keywords Global Overview
FoxData supports viewing the global Ranked Keywords for the app you are tracking. This helps you understand the app's keyword coverage worldwide, assess its visibility in different markets, and identify markets with optimization potential or untapped opportunities, enabling you to develop more effective market entry strategies.
Ranked Keywords Trends
In addition to the global keyword overview charts, FoxData also supports the study of global keyword trends.
By simply clicking the line chart icon in the top left corner, you can switch to the global keyword trends chart.
By observing the performance changes of keywords over different time periods, users can identify which keywords are gaining or losing popularity.
This helps in adjusting keyword strategies promptly to adapt to market dynamics.
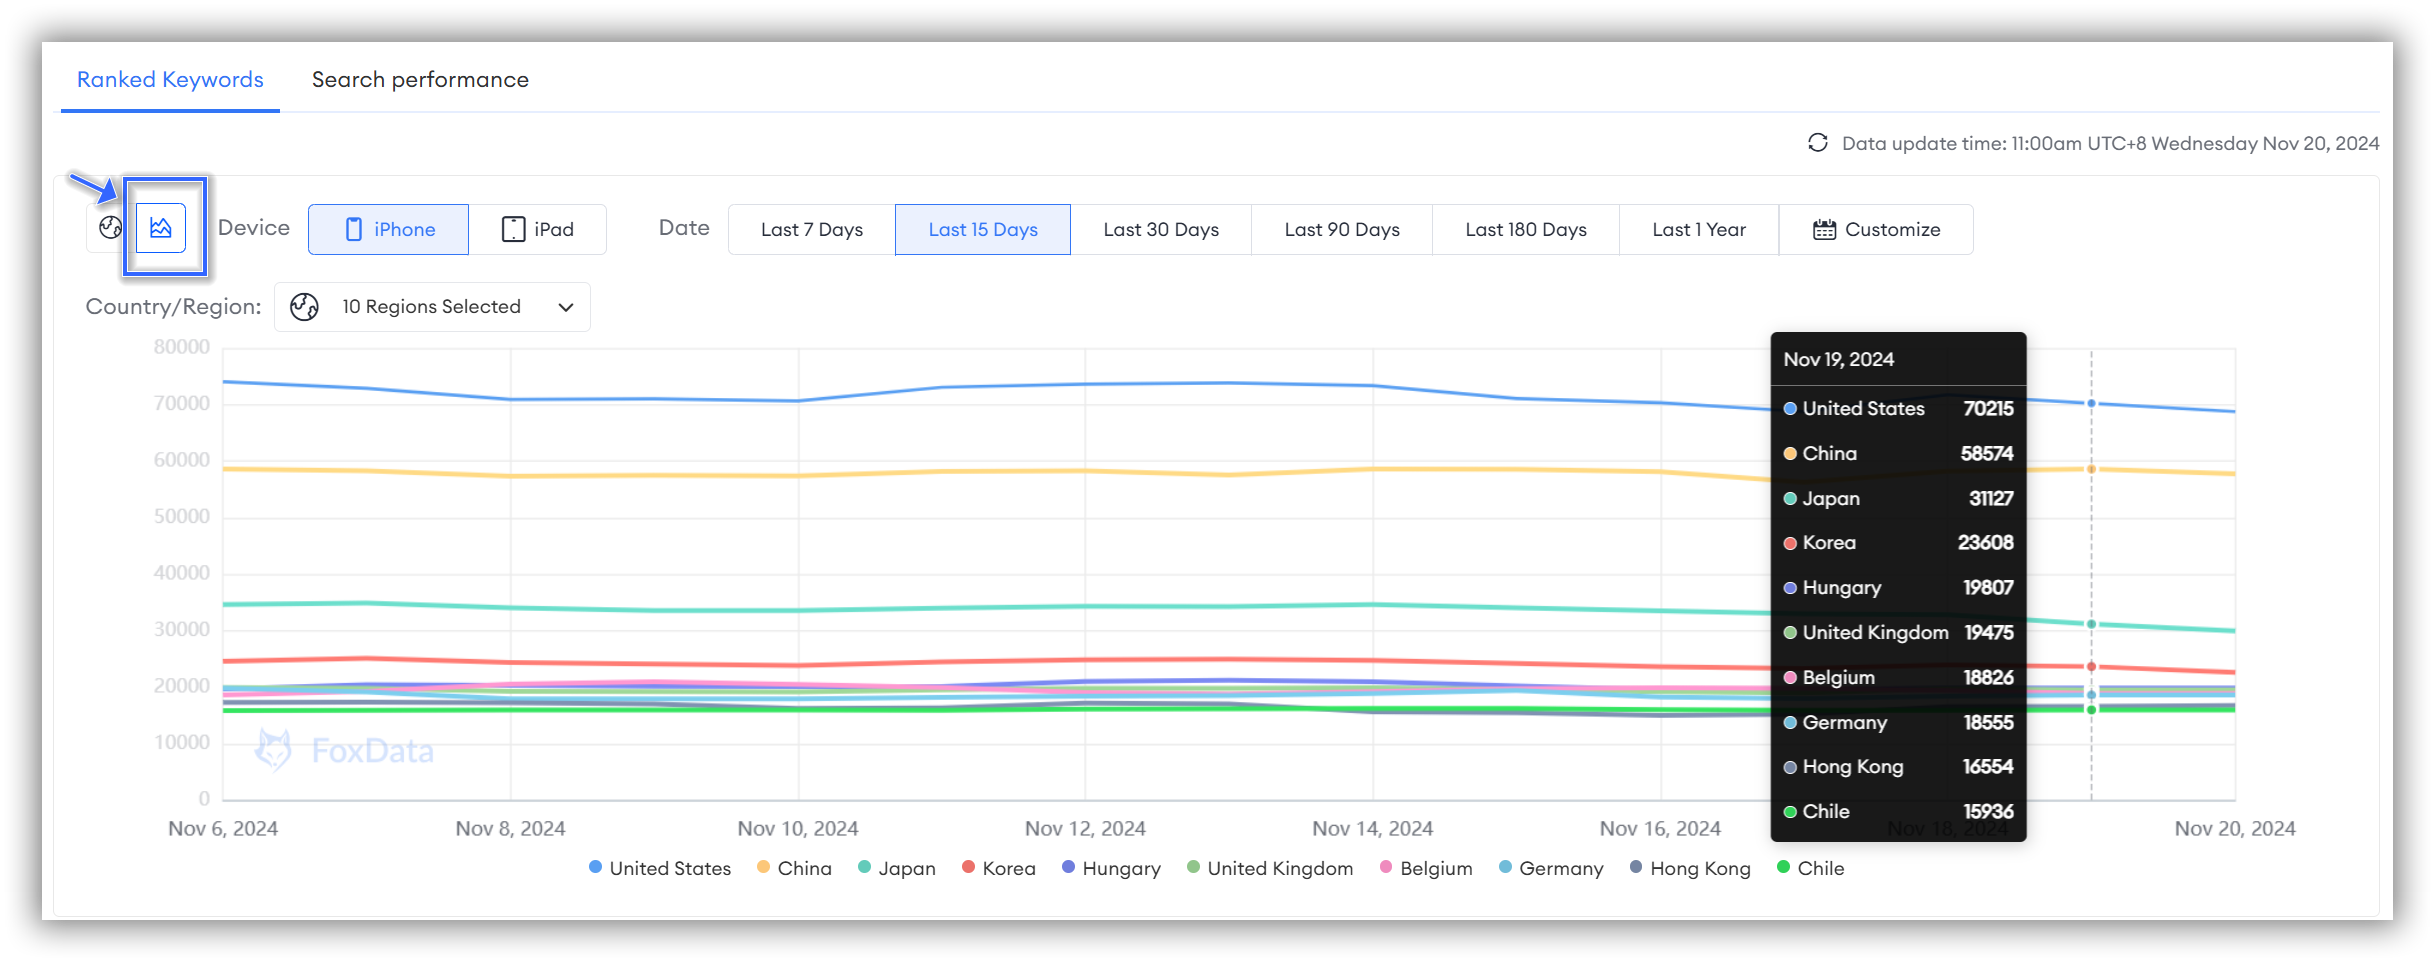
You can filter by device, time dimension, and country to conduct your personalized research.
🗒️ Note: Currently, FoxData supports selecting up to 10 countries for global keyword trend analysis.
Ranked Keywords Details
If you want to view specific keyword details, simply scroll down, where you'll find the global ranked keywords details for the app you are tracking.
In this section, FoxData has taken all your needs for operational convenience into account!
You can not only sort the data dimensions below in ascending or descending order according to your needs, but also enter the keywords you are interested in for direct search.
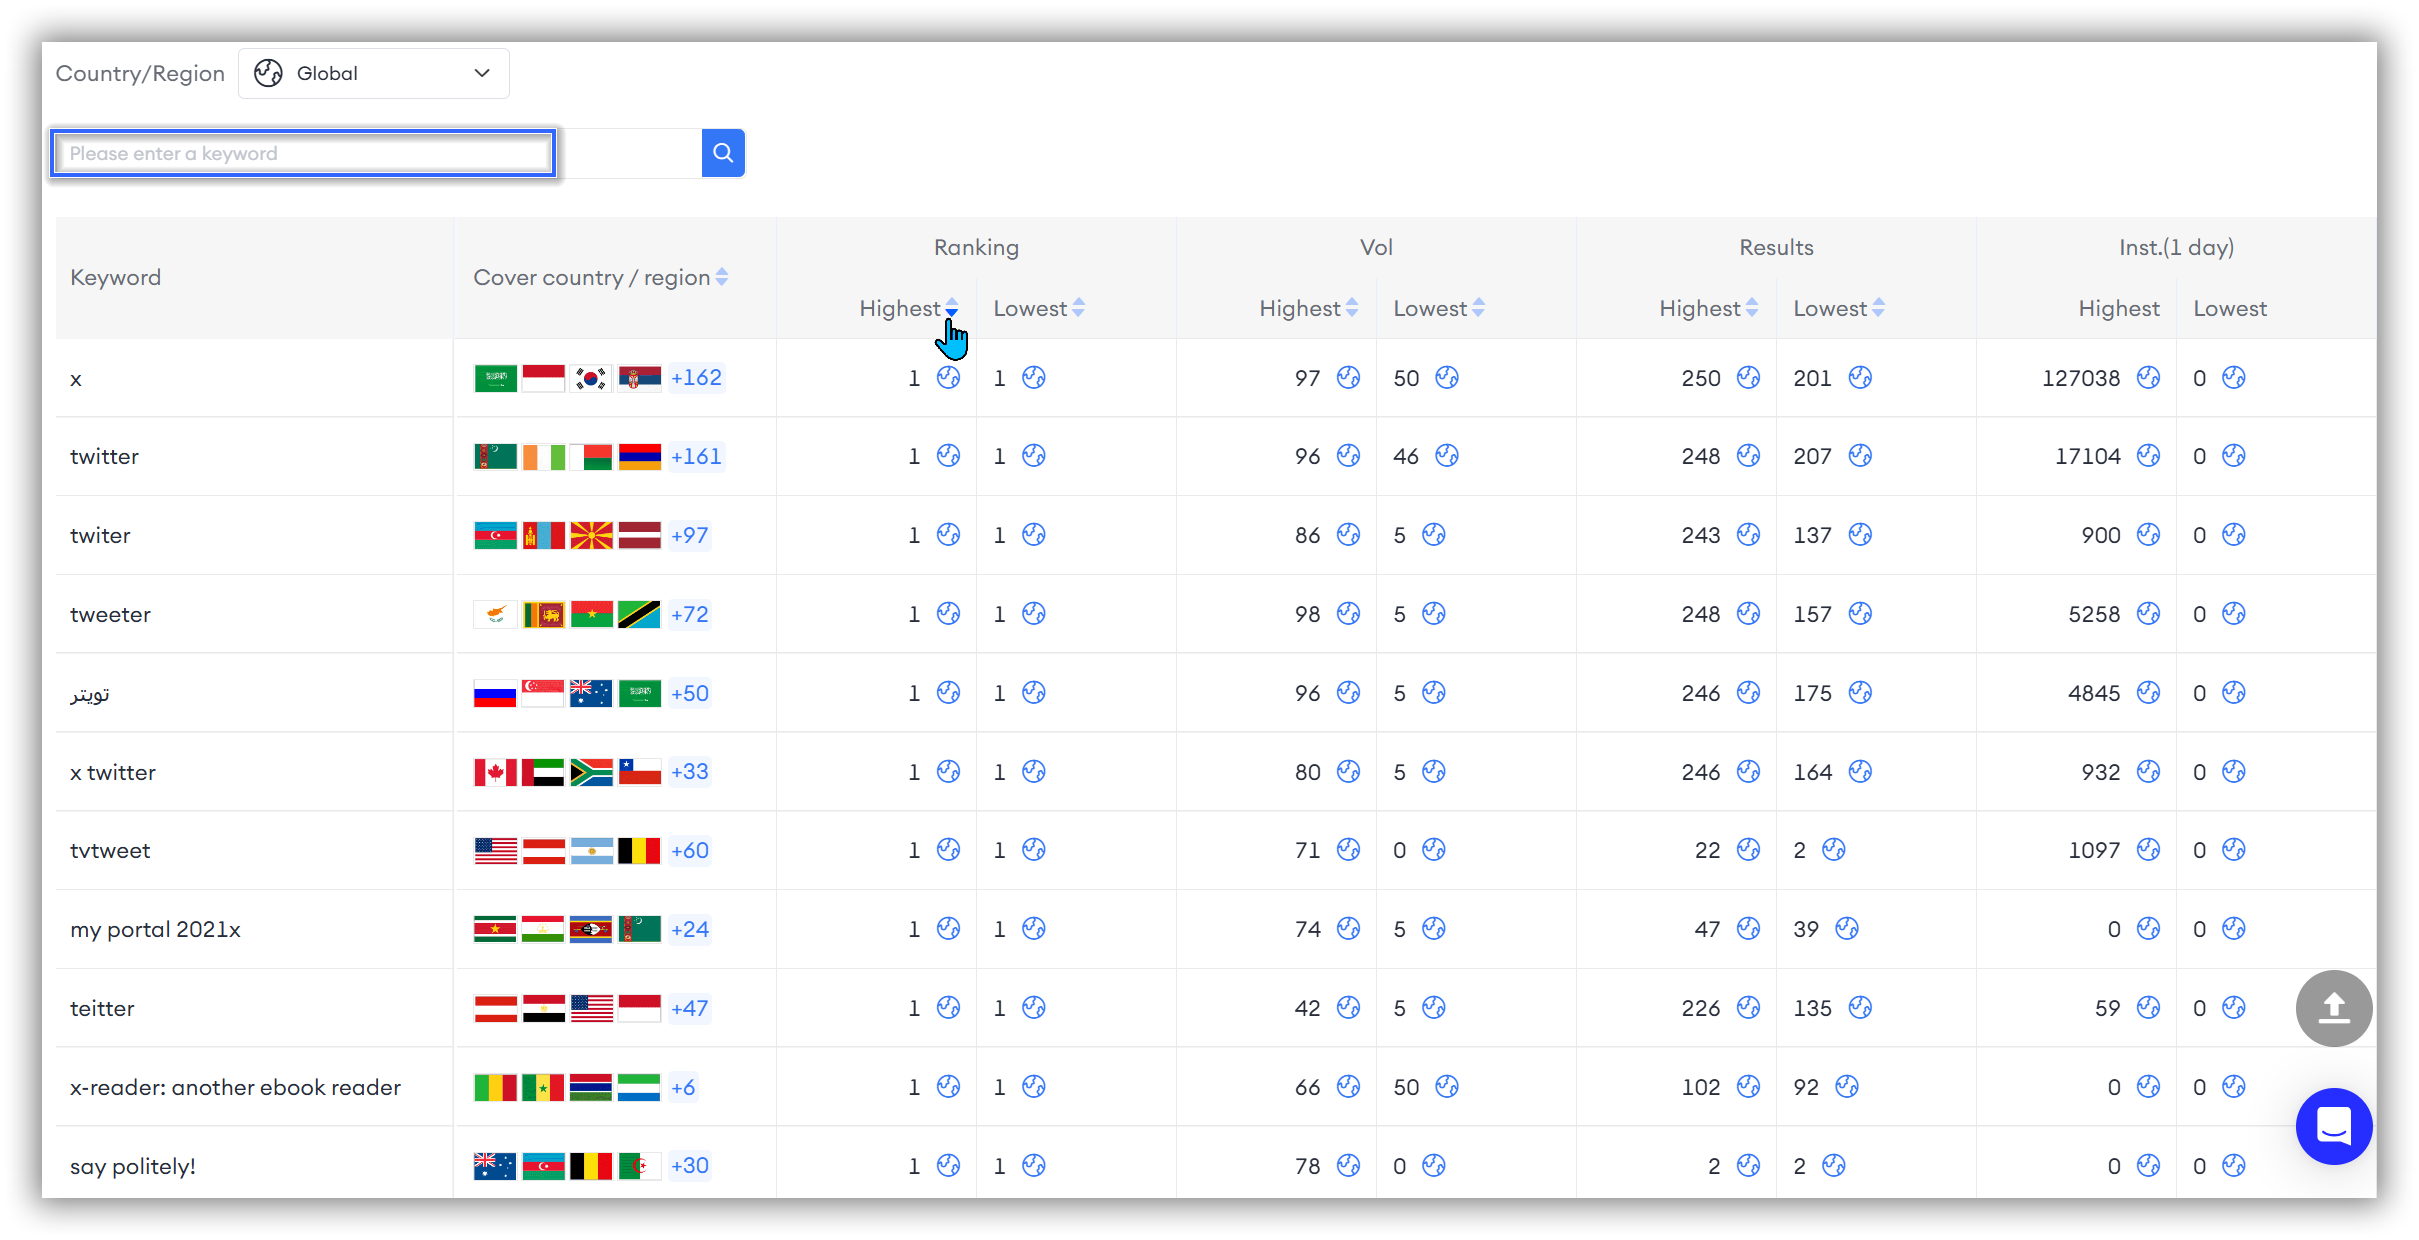
Have you noticed the small globe icon behind each column of numbers?
By clicking on this icon, you can directly view the specific dimension trends of the keyword in the top-performing countries!
For example, a window will pop up displaying the Top Performance countries by clicking the globe icon next to the keyword "x" under the Ranking dimension.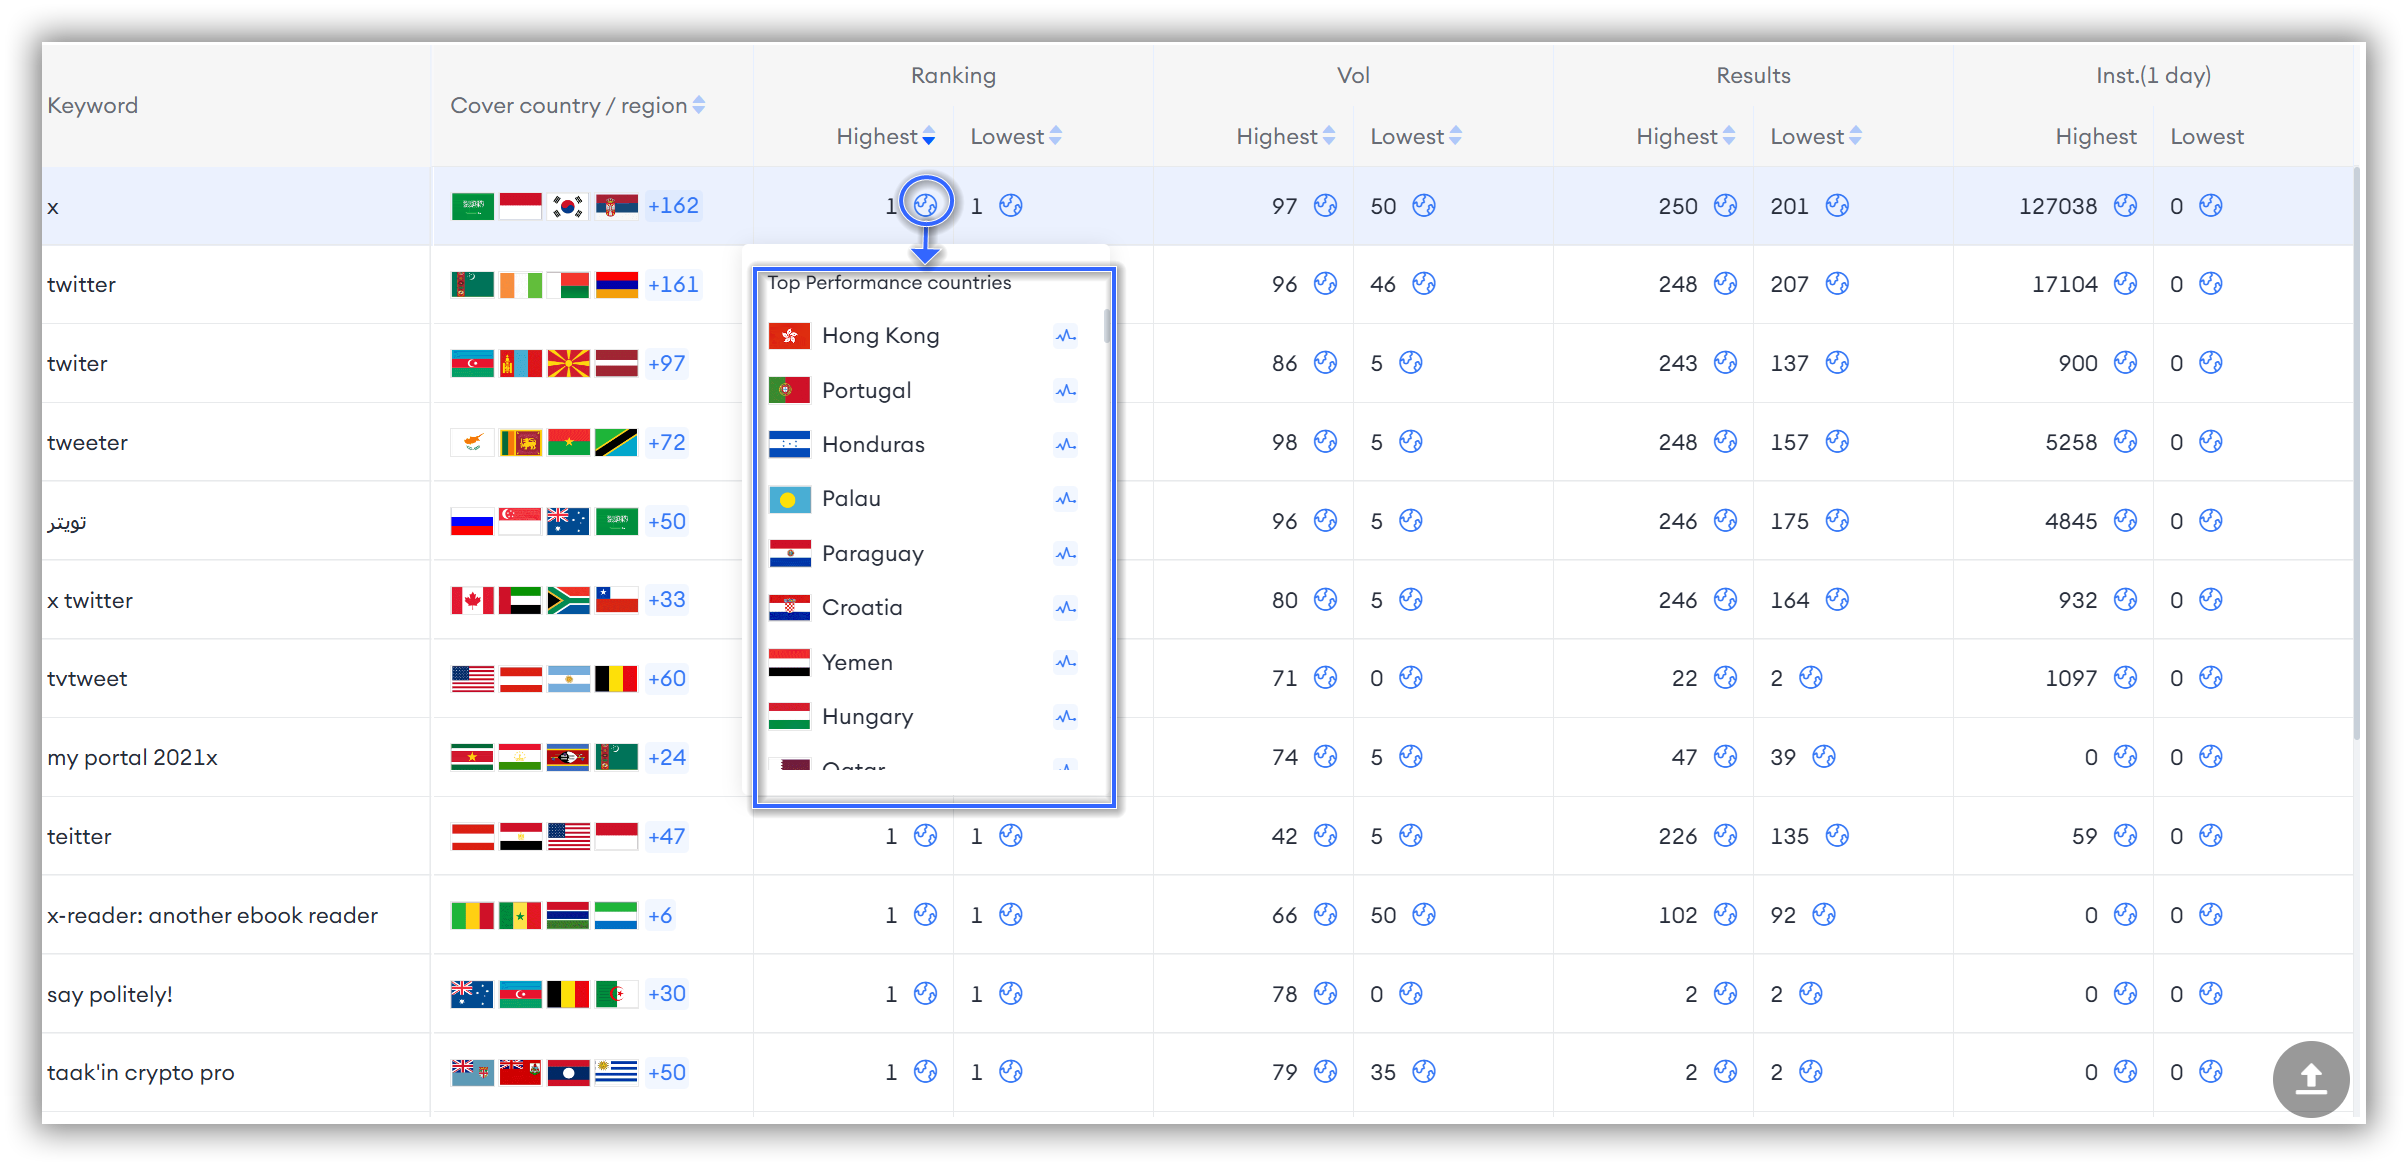
Simply click the line chart icon next to the country you want to study, and you'll be able to view the ranking trends of the keyword "x" in the search results for that country!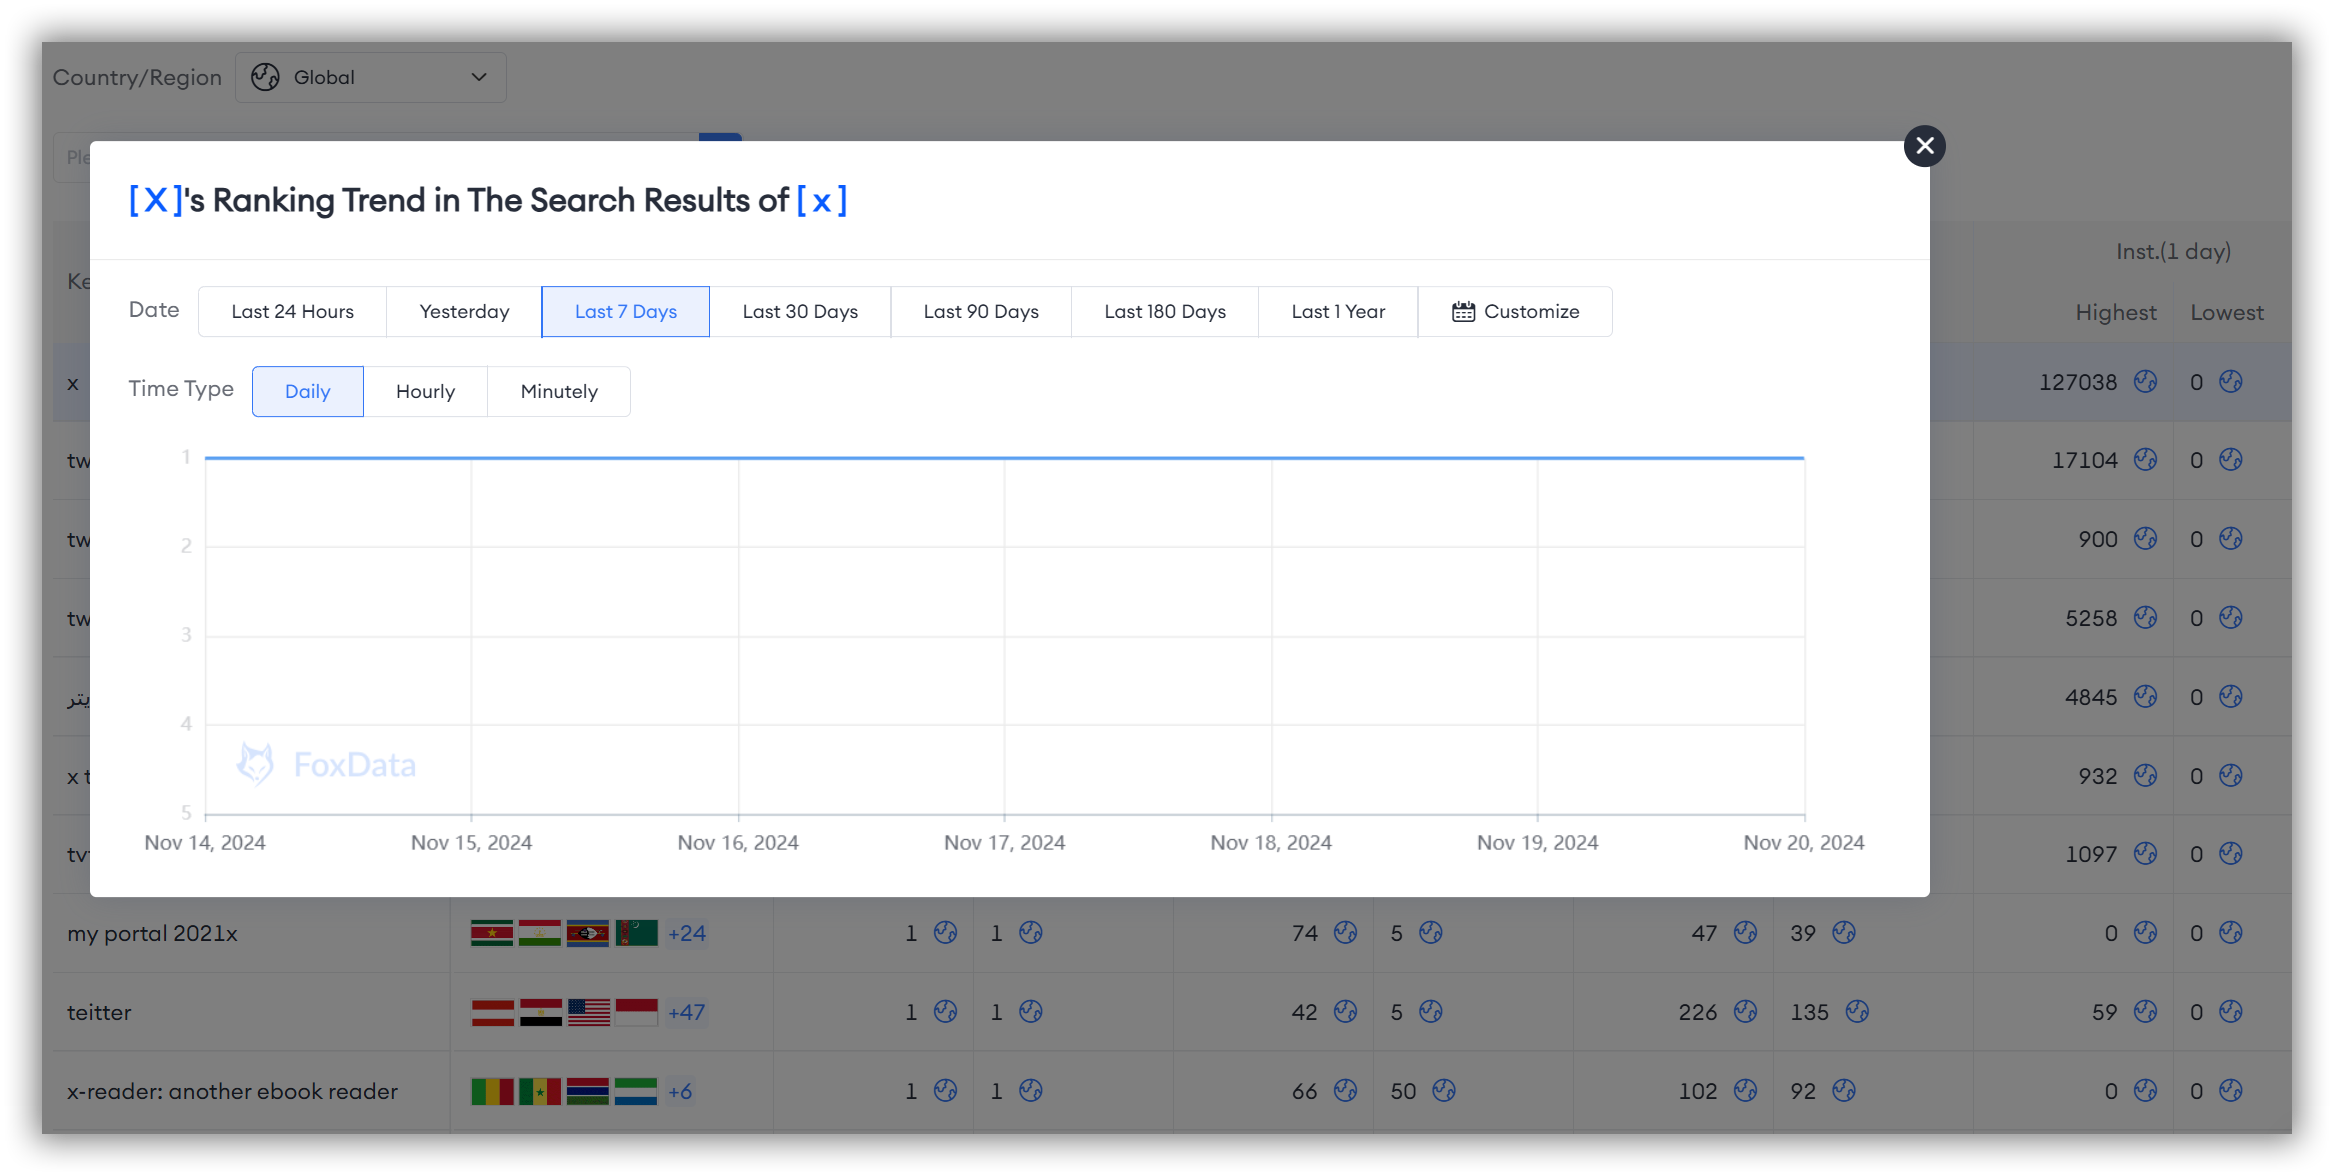
If you want to directly view the ranked keywords detail overview for the app you are tracking in a specific country, don't forget to use the filter box above to select the specific country you want to study.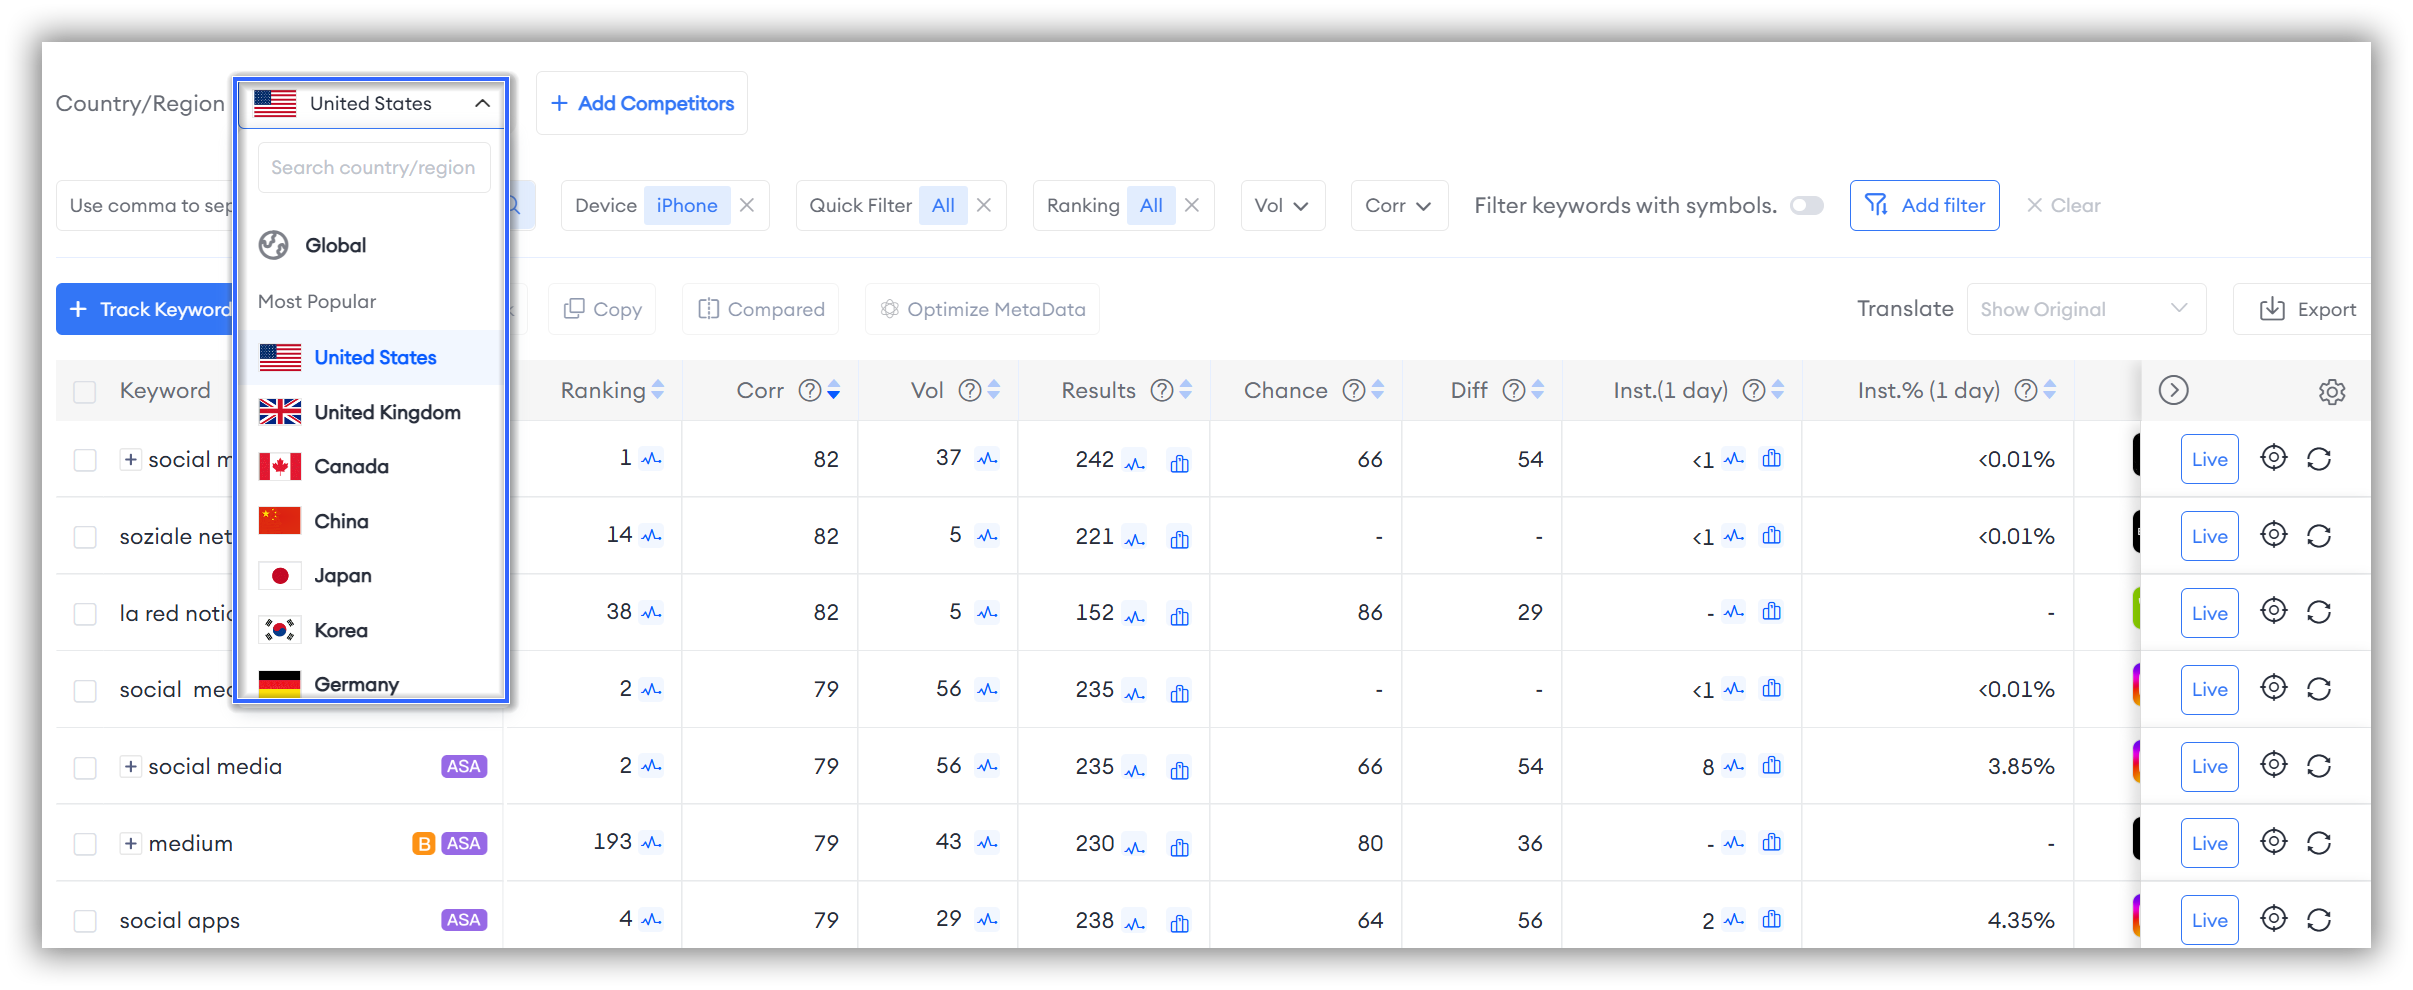
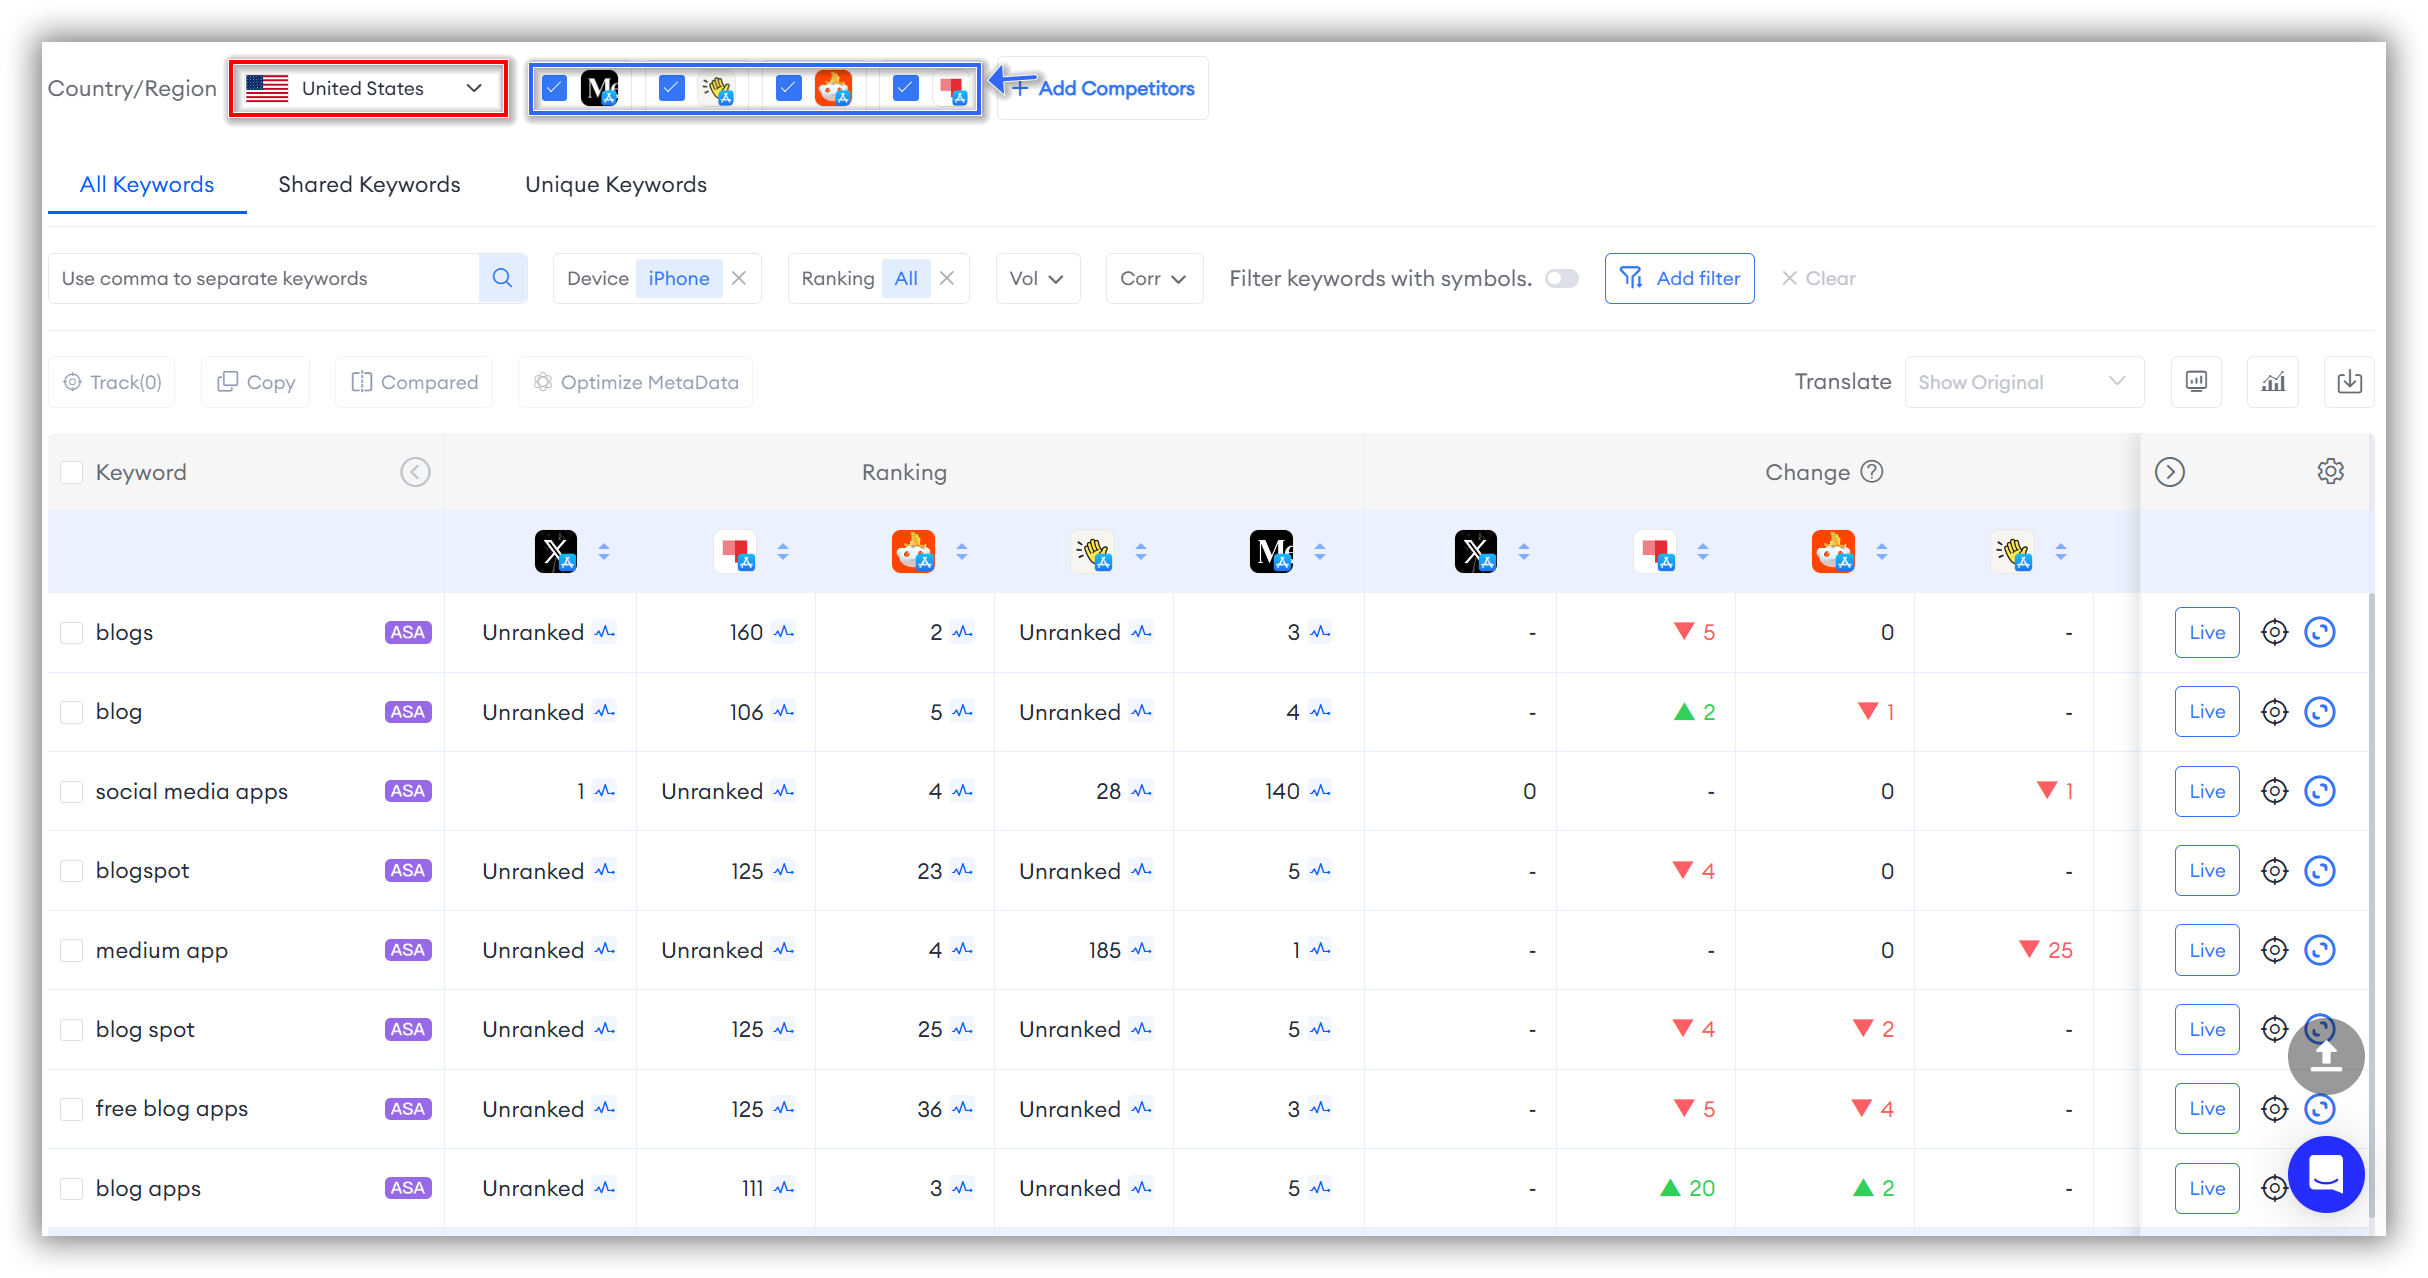
Remember, this feature currently only supports adding competitors for comparison after selecting a specific country. It cannot be used in the initial global dimension.
Search Performance
Search Performance Global Overview
In addition to Global Ranked Keywords, FoxData also supports further investigation of the Global Search Performance of specific keywords for the app you are tracking. Understanding how keywords perform differently across regions can help you identify changes in market demand and region-specific user preferences.
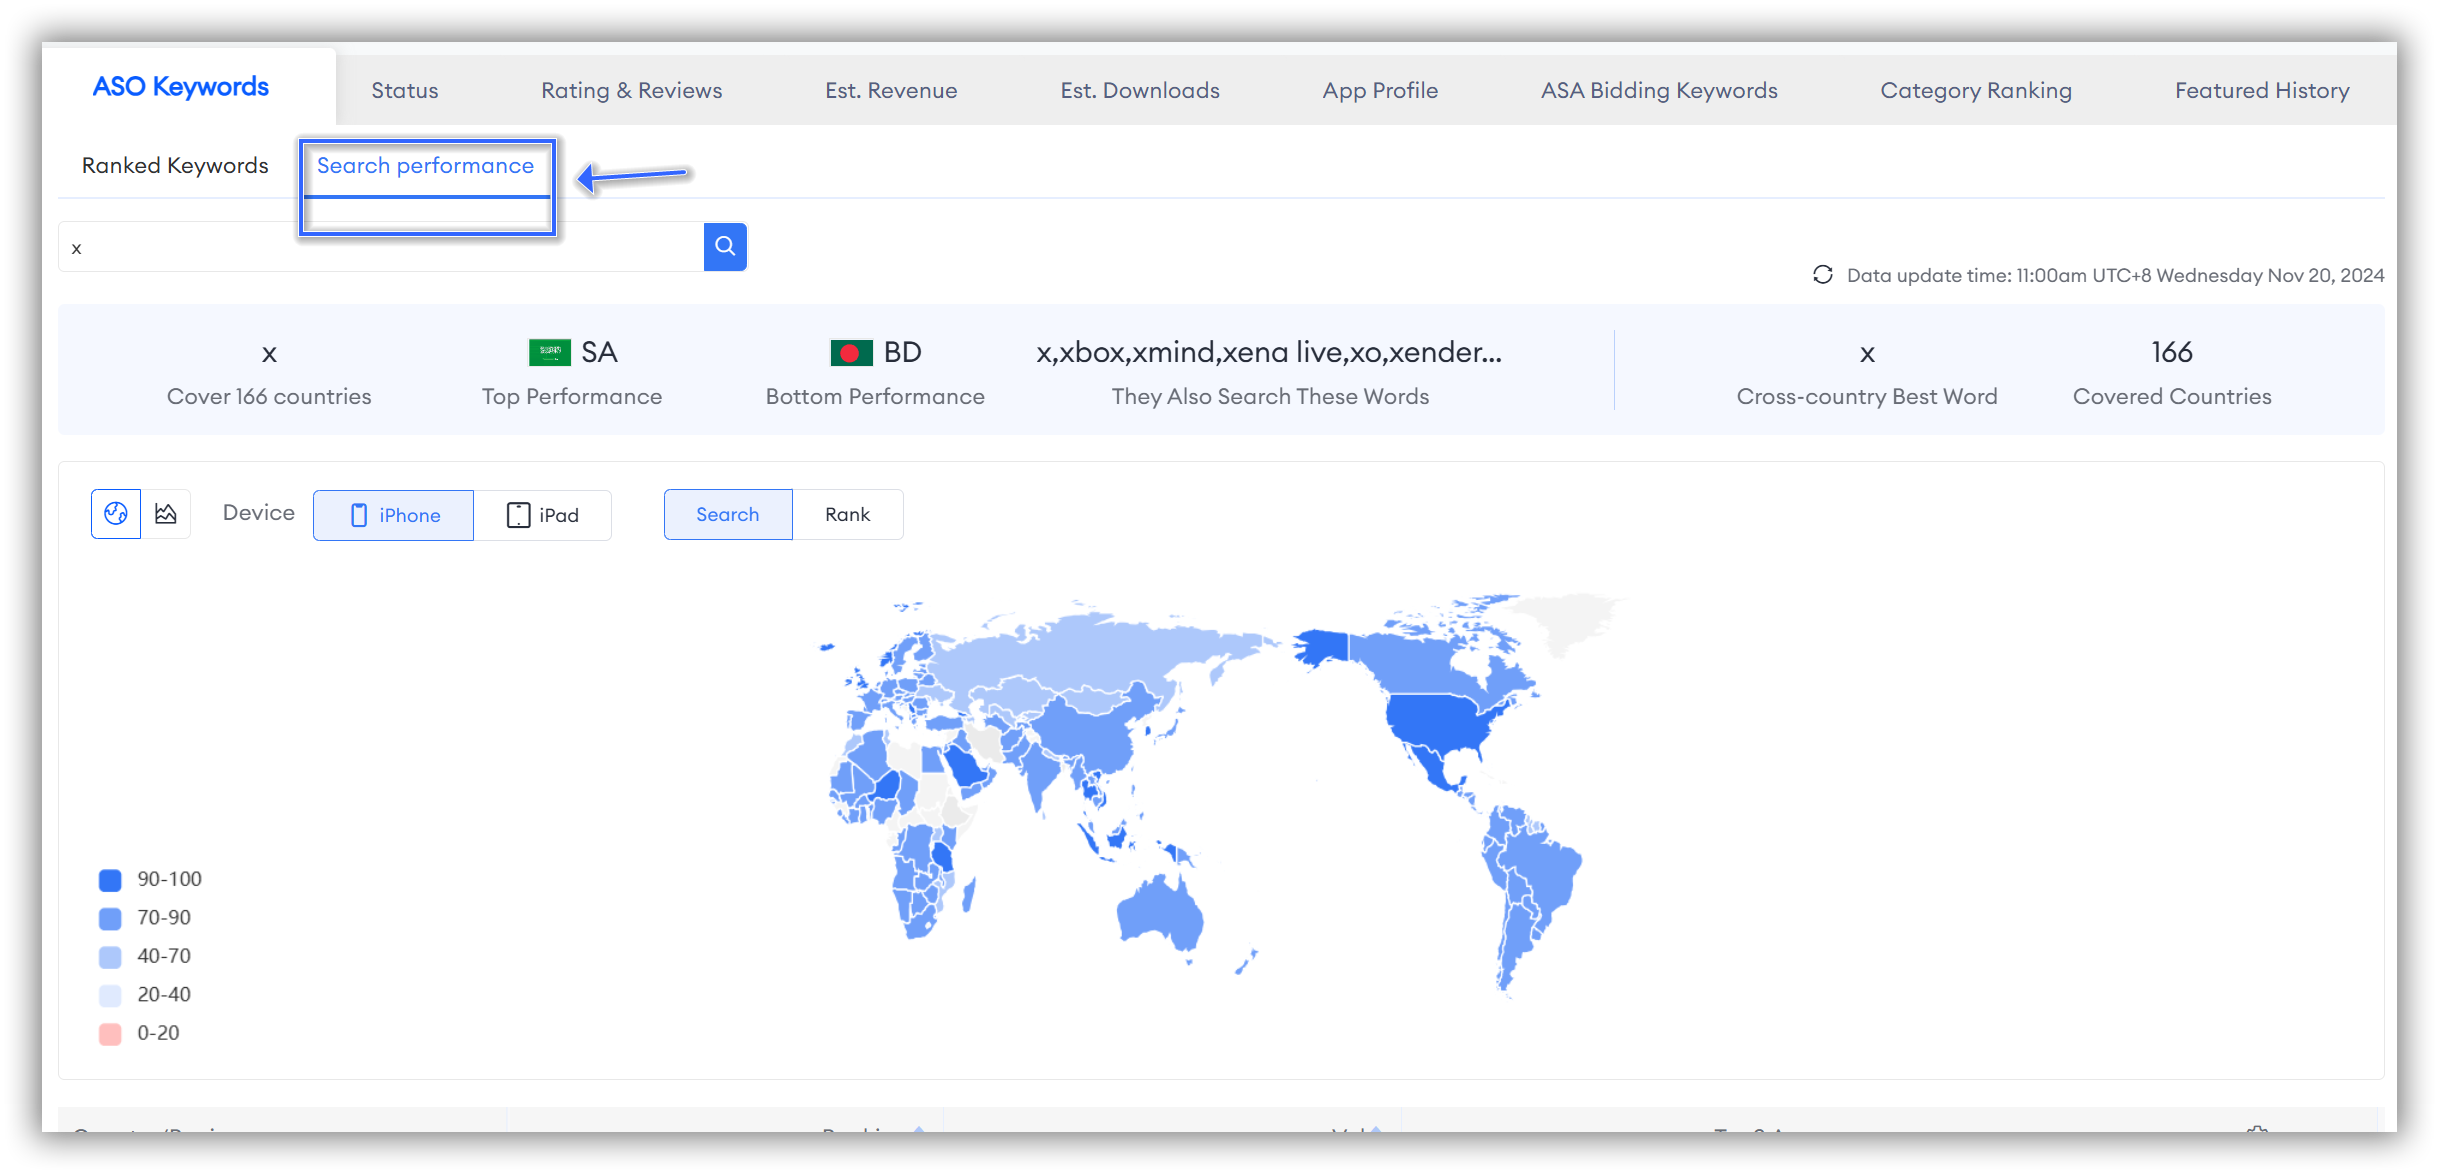
🗒️ Note 1: By default, the system searches for and displays the search performance of brand name keywords. For example, the default keyword for the "X" app shown in this blog is "x."
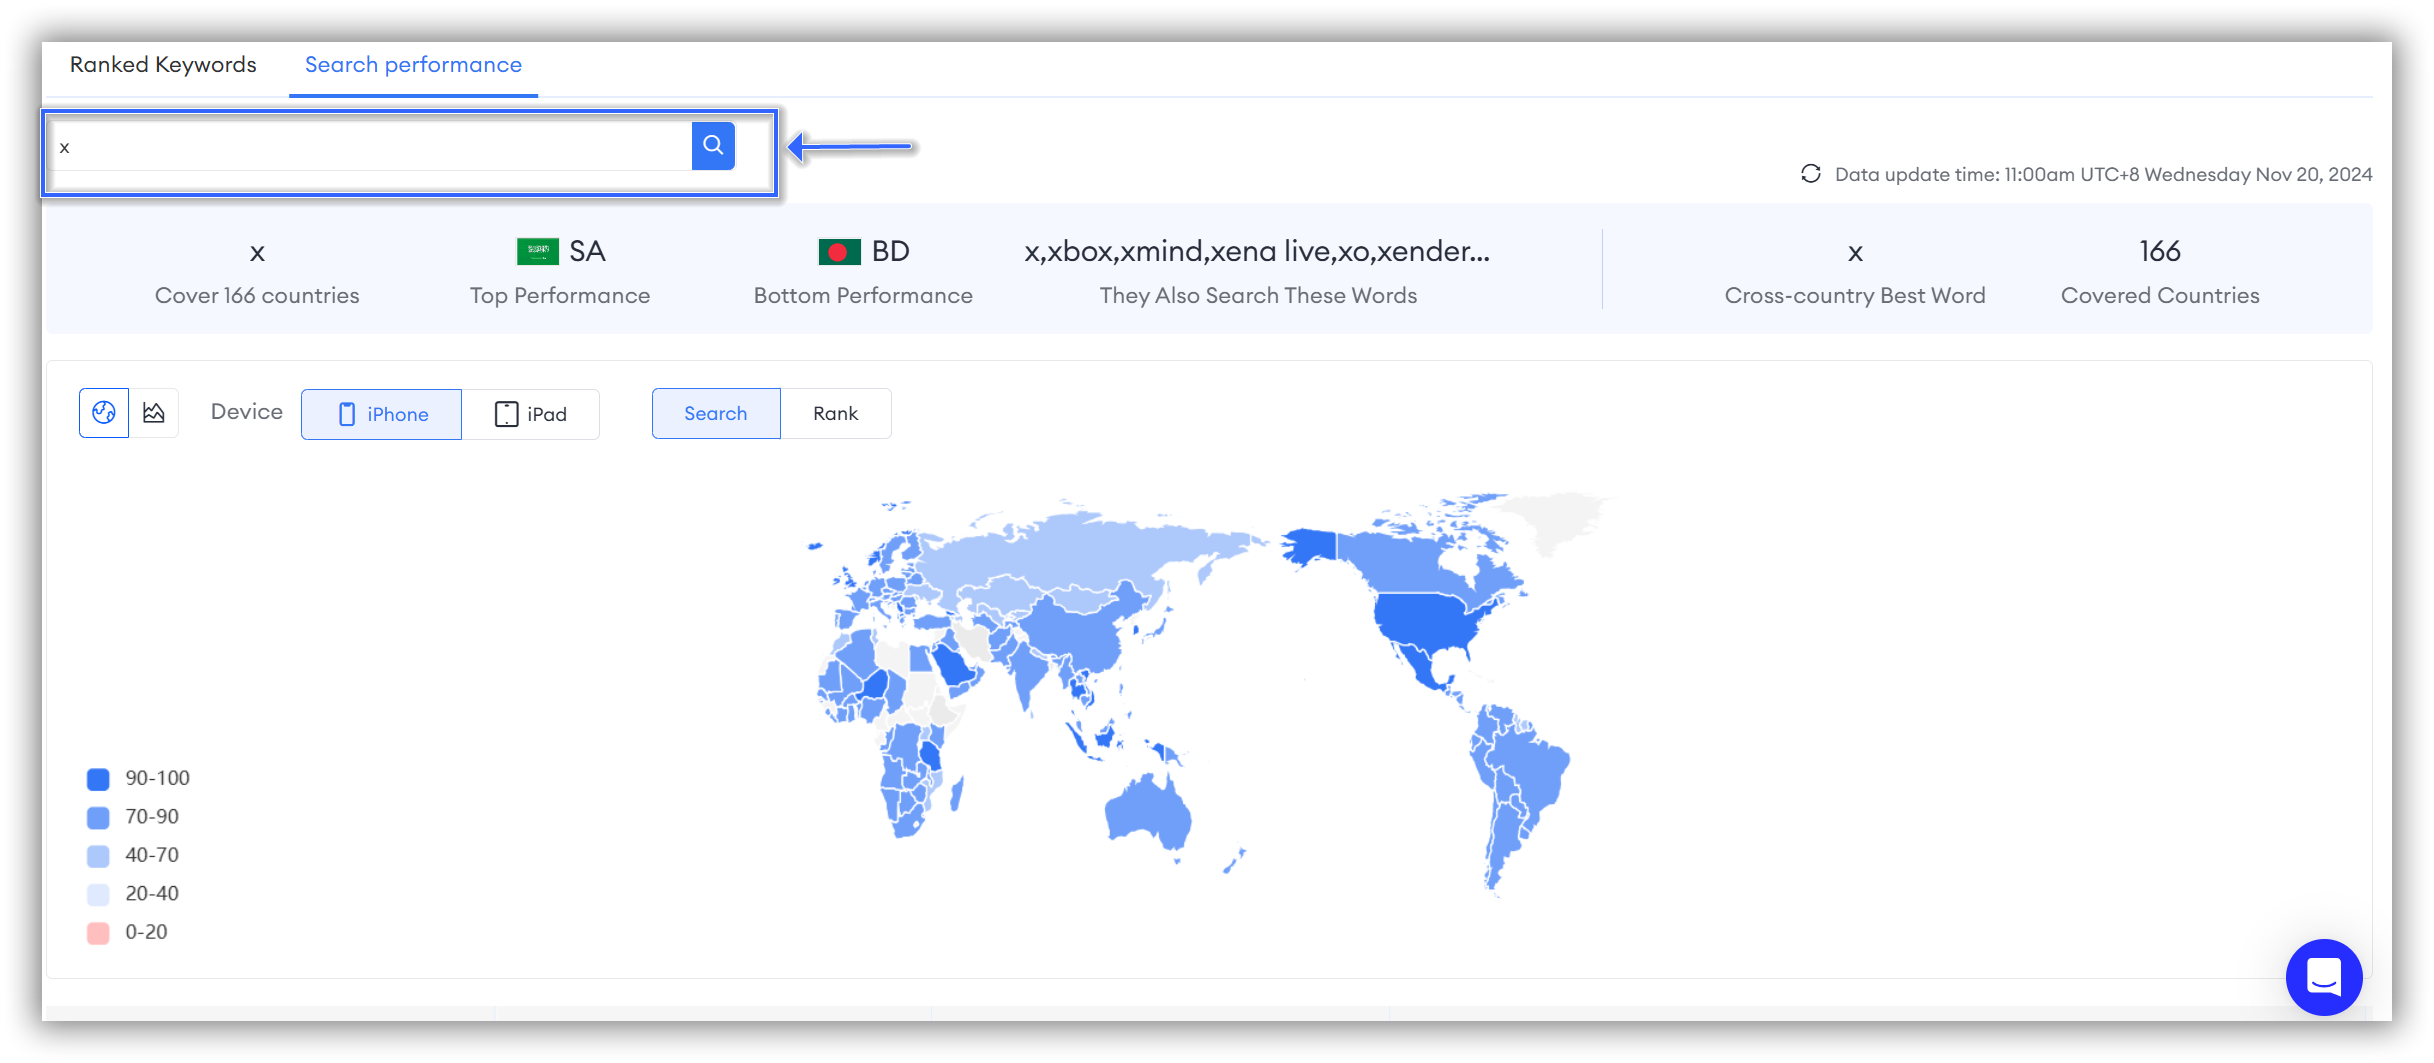
If you want to research other keywords, make sure to search for the specific keyword directly in the top left corner.
🗒️ Note 2: The research method for the visual data map described below is detailed under the "ASO Keywords" section in the aforementioned blog post. If needed, you can scroll up to view it. 👆
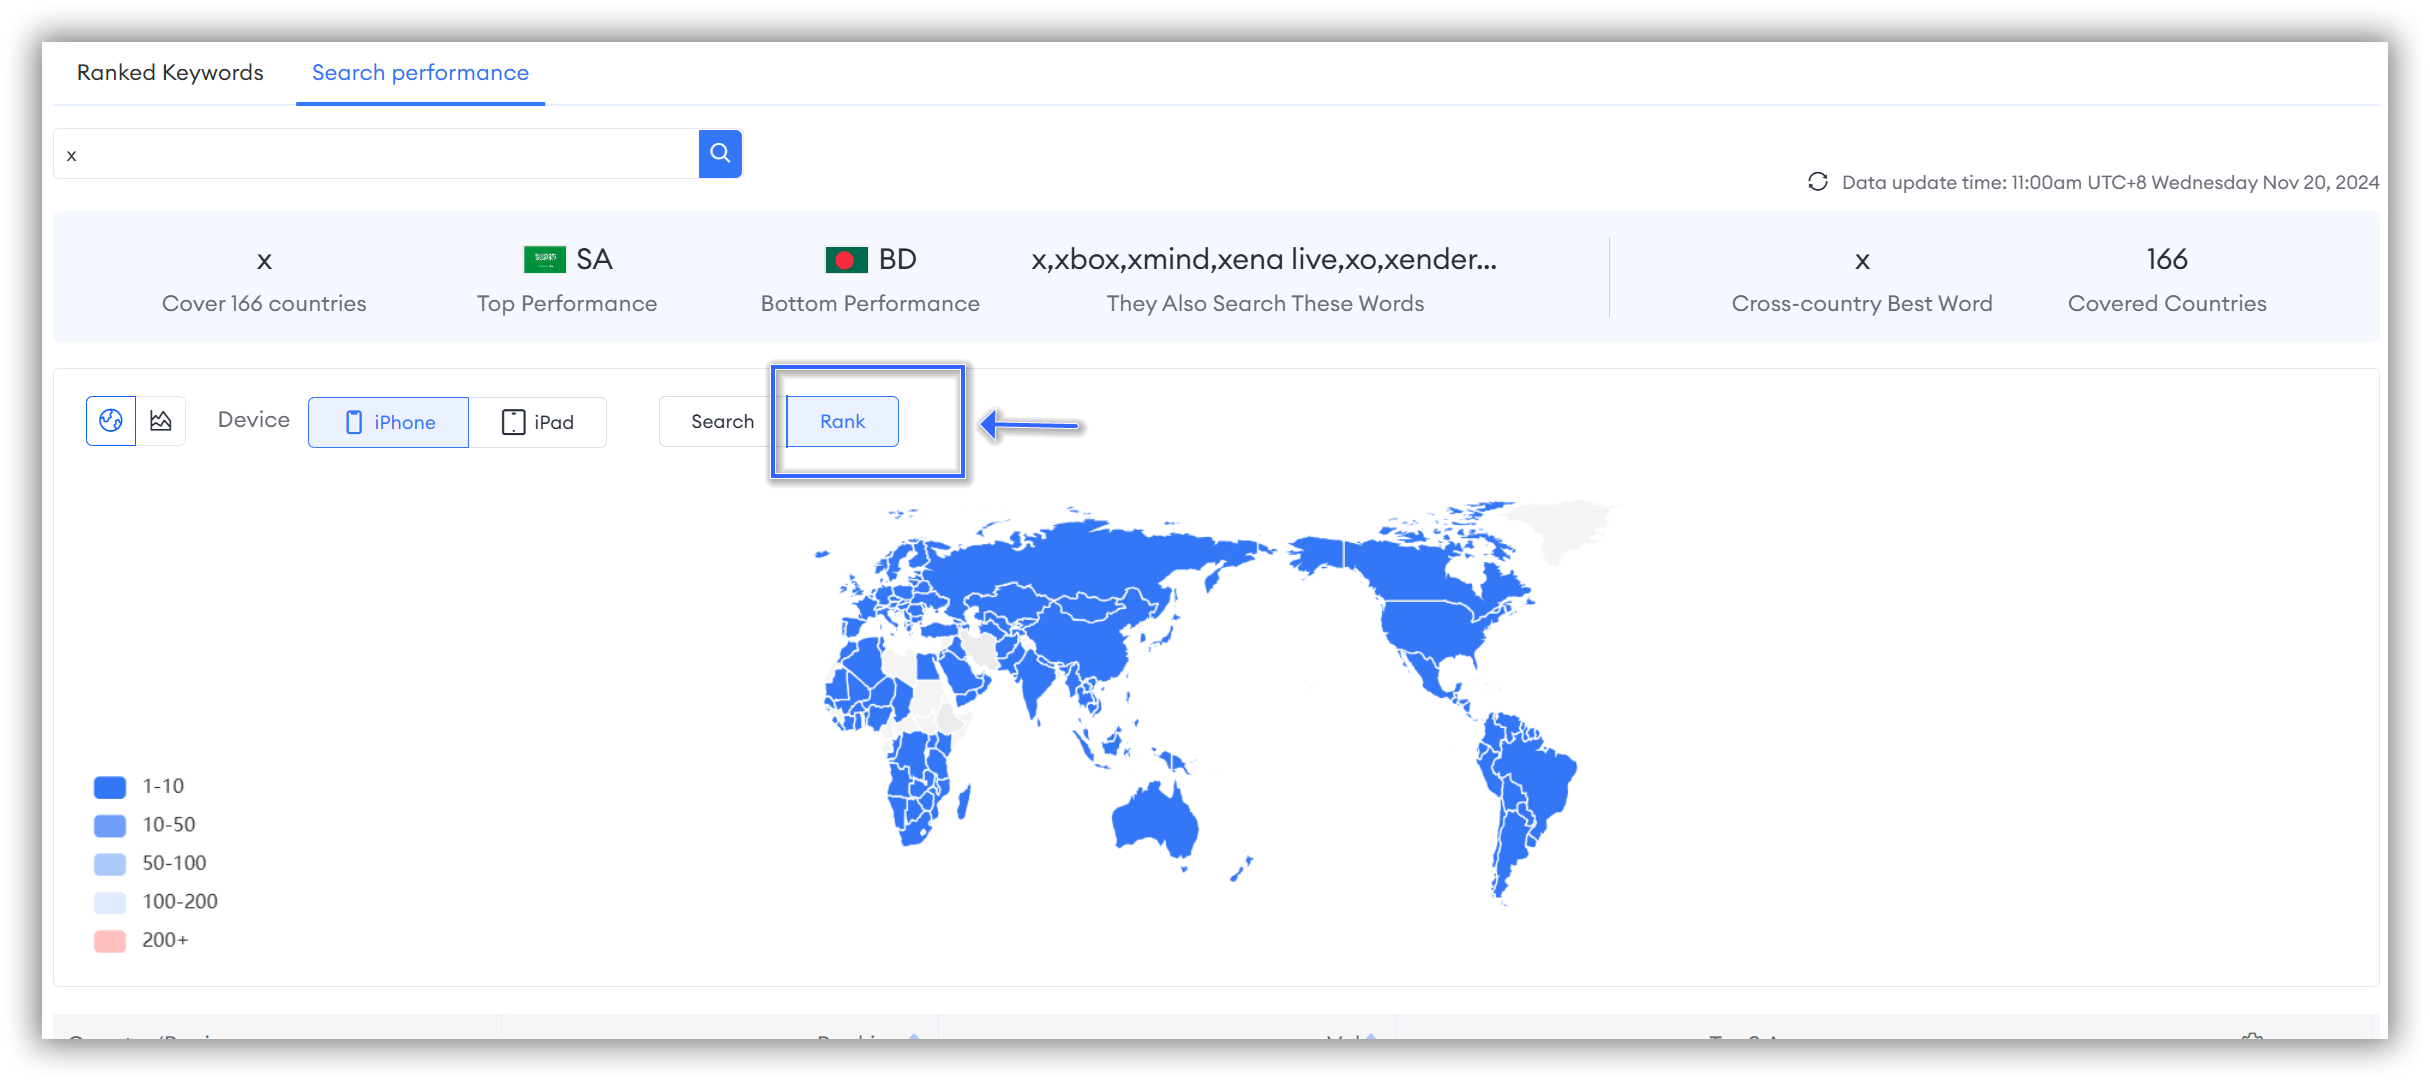
Whether you are viewing "Search" or "Rank," you can find an app overview under the "Search Performance" dimension at the top of the data visualization map.
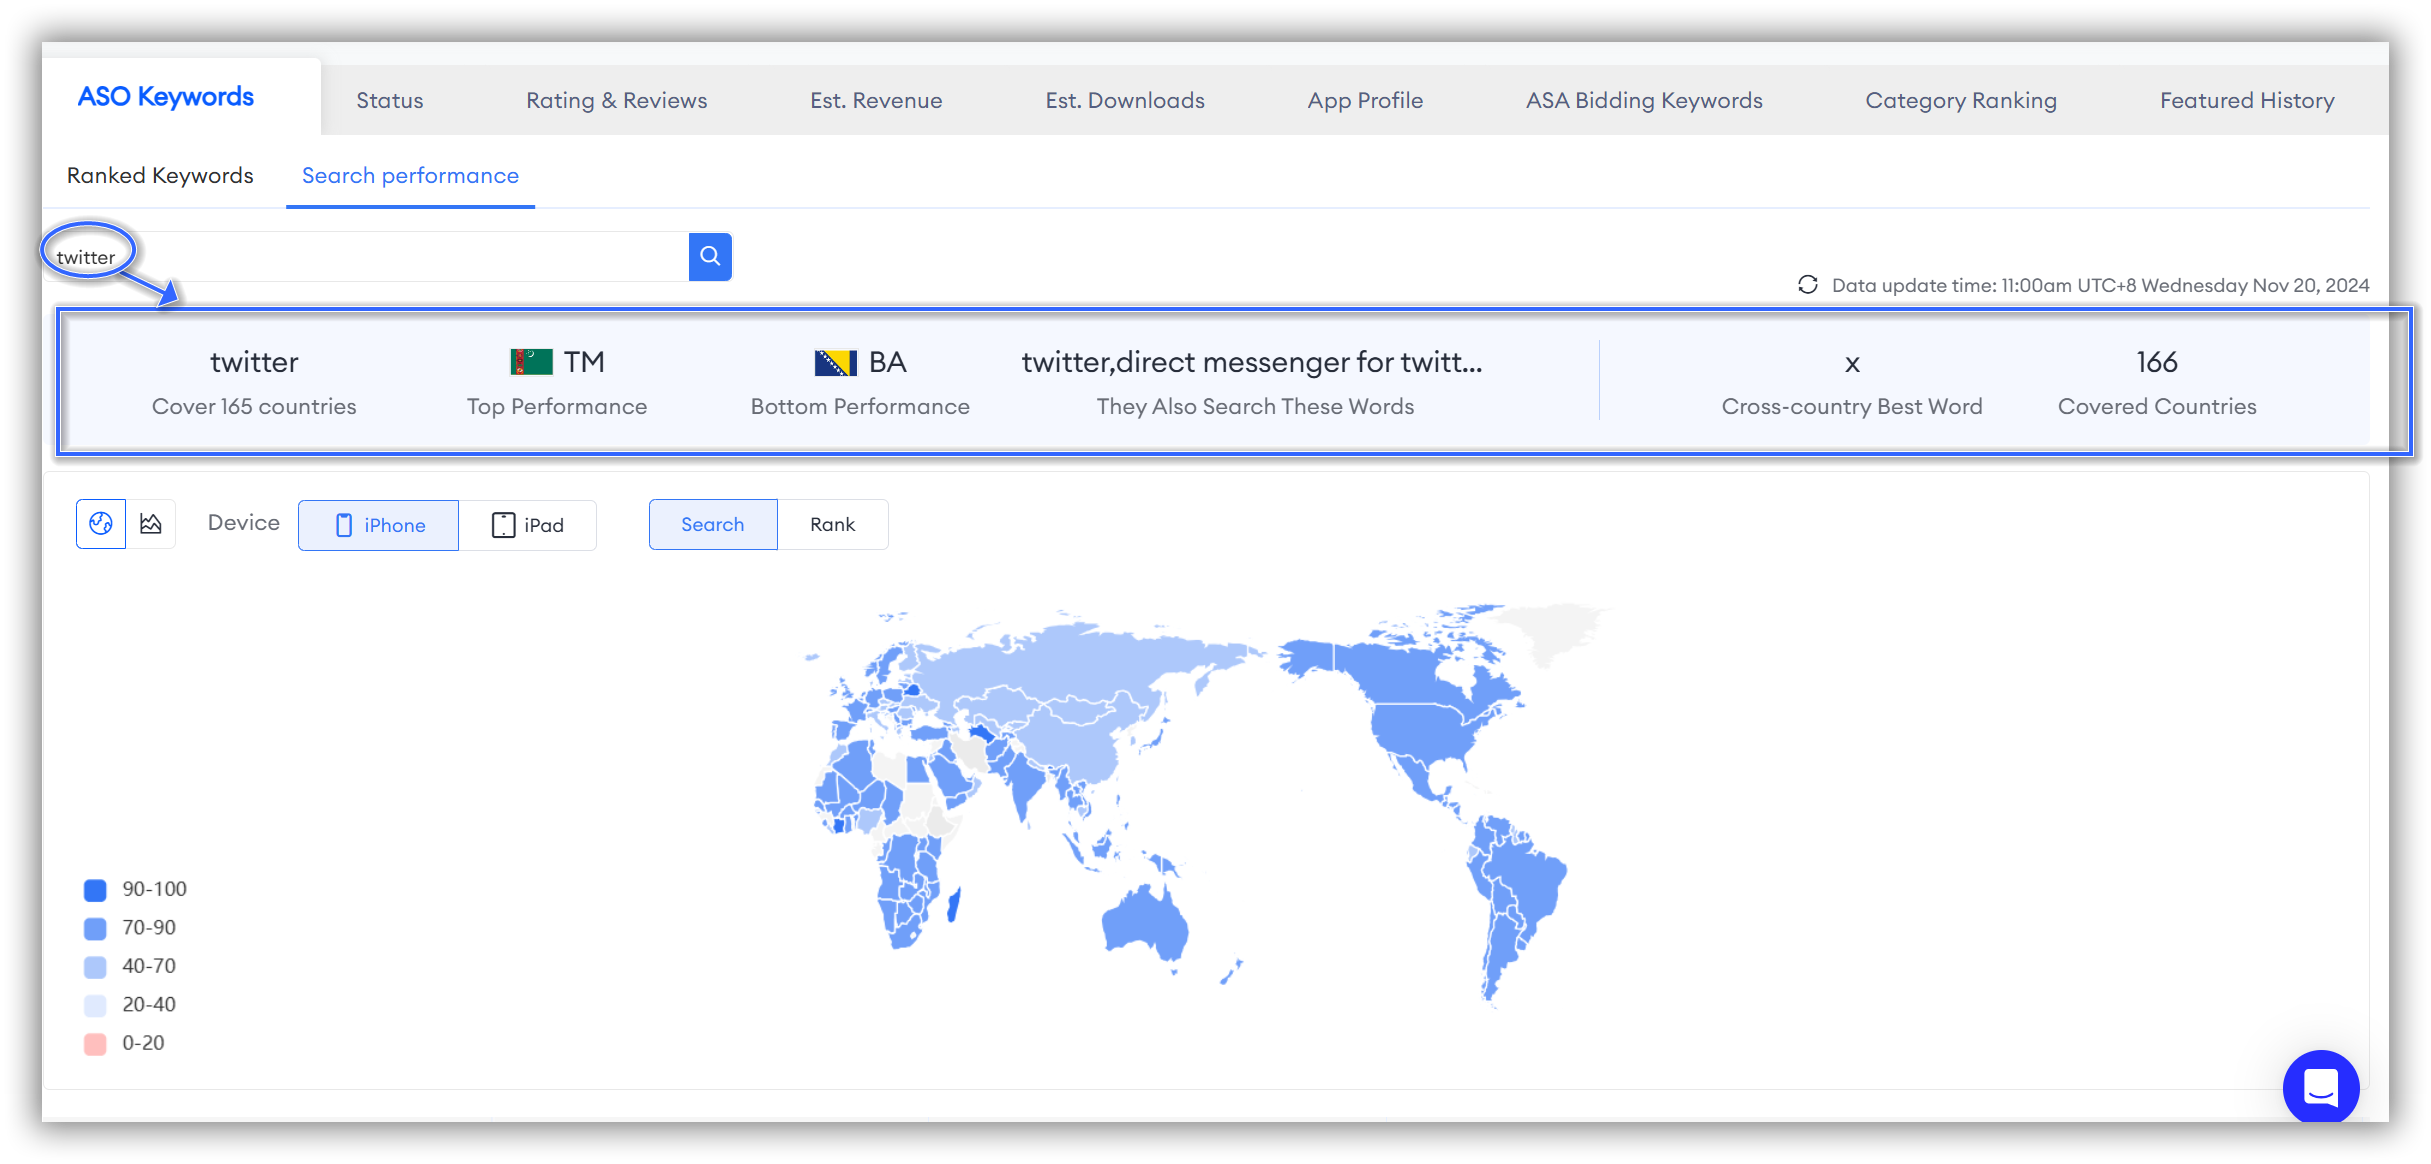
The app overview under the "Search Performance" dimension includes the following 6 aspects, helping you gain a more comprehensive and intuitive understanding of the search performance for specific keywords of the app you are tracking.
Search Performance Trends
Whether you are exploring "Search" or "Rank," simply click the line chart icon in the top left corner to study the global trend charts for specific keywords in these two dimensions. Based on the data from the trend charts, users can adjust keywords to enhance the app's search visibility and download rates in different regions.
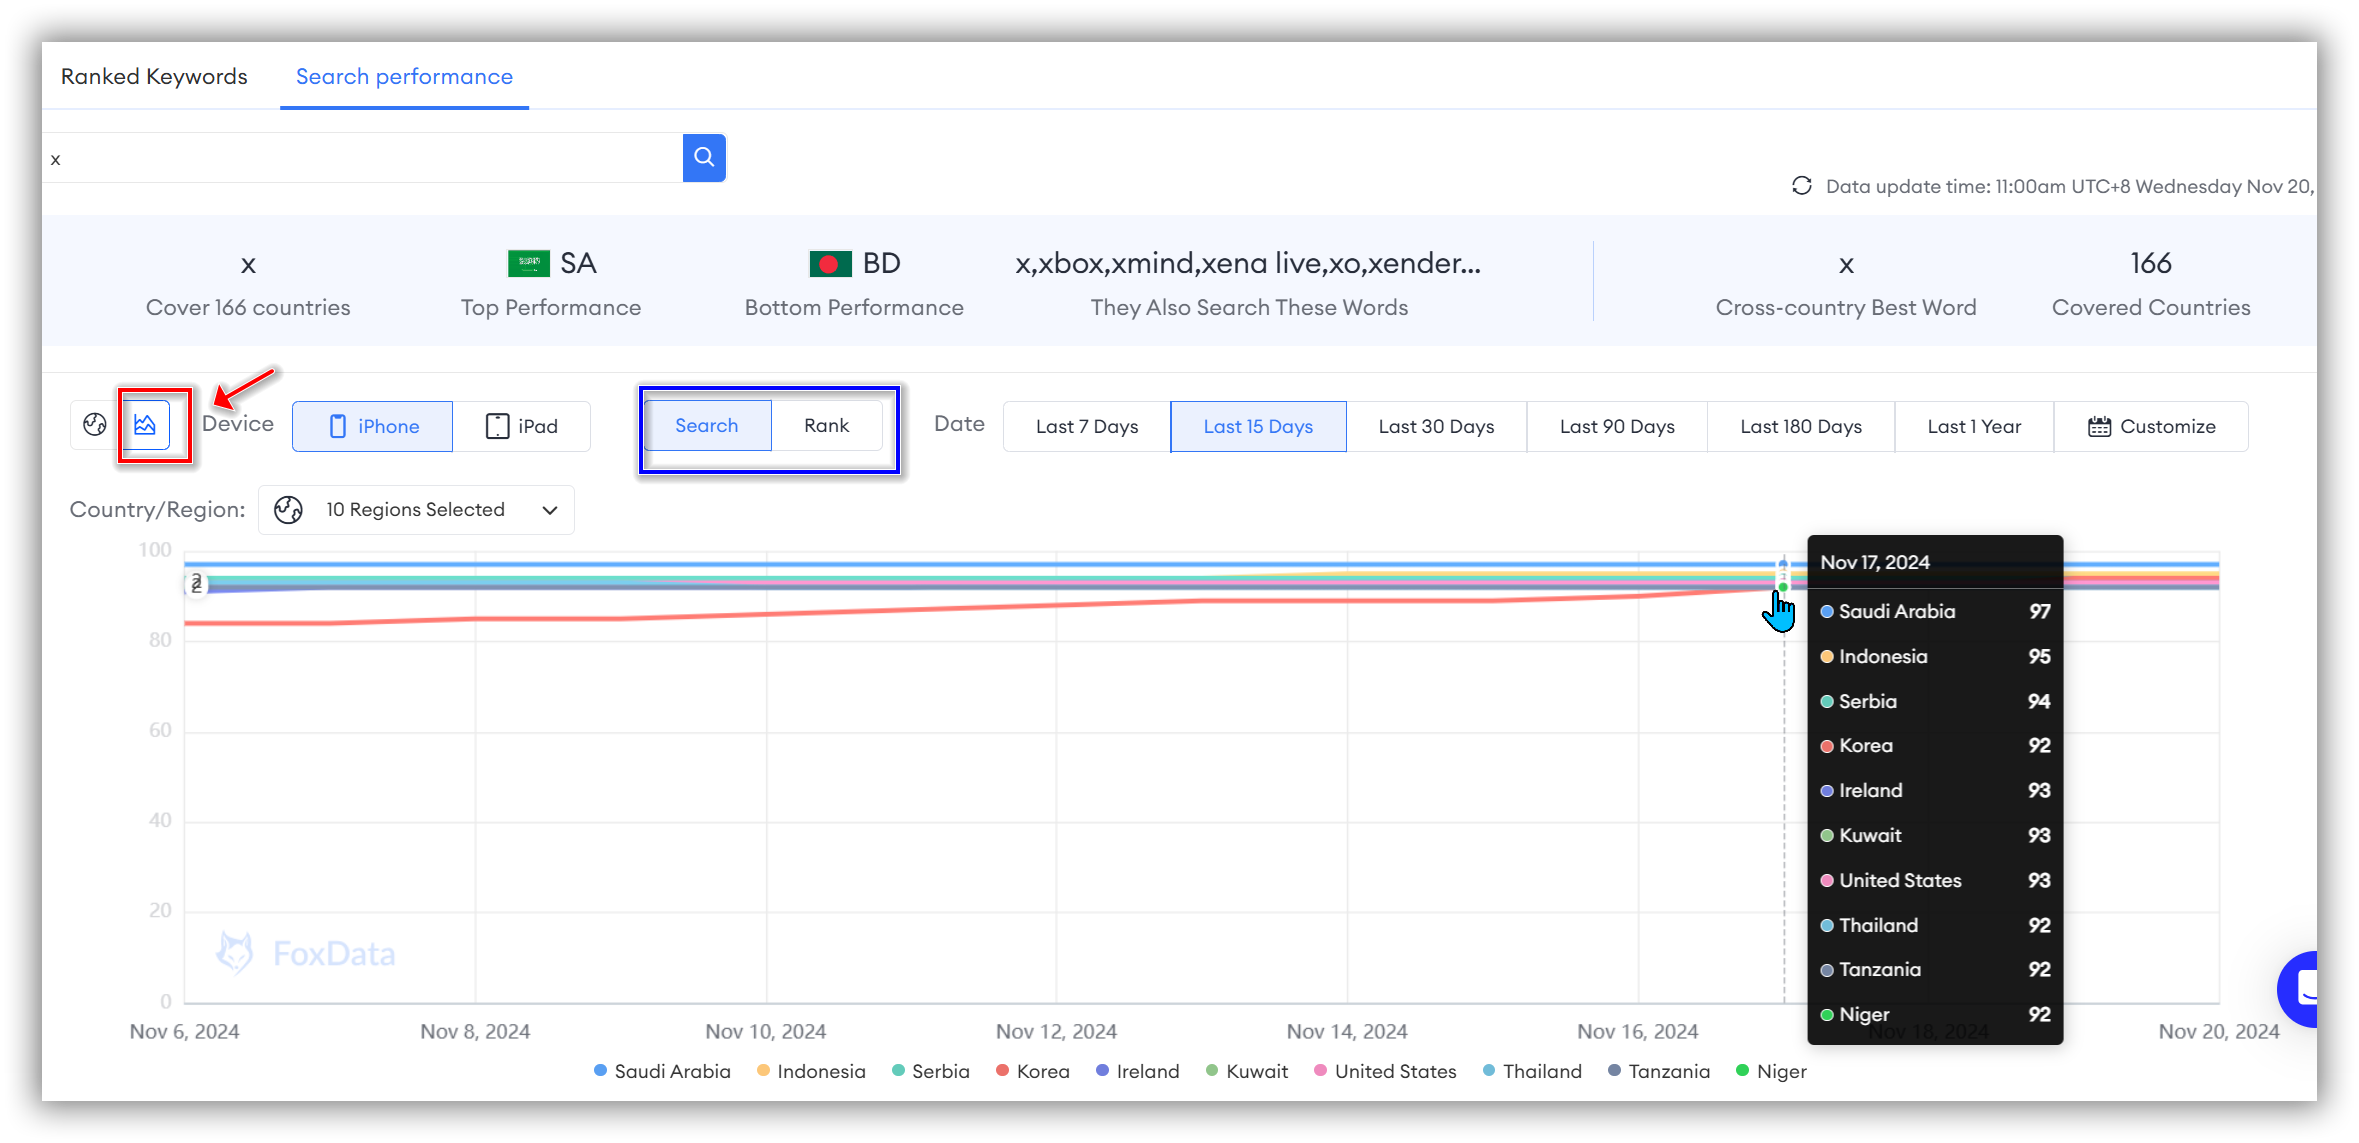
You can filter by device, time dimension, and country to conduct your personalized research.
🗒️ Note: Currently, FoxData allows you to select up to ten countries for global keyword trend analysis.
Search Performance Details
If you want to view specific detailed data for the keyword across various countries globally, please scroll down.
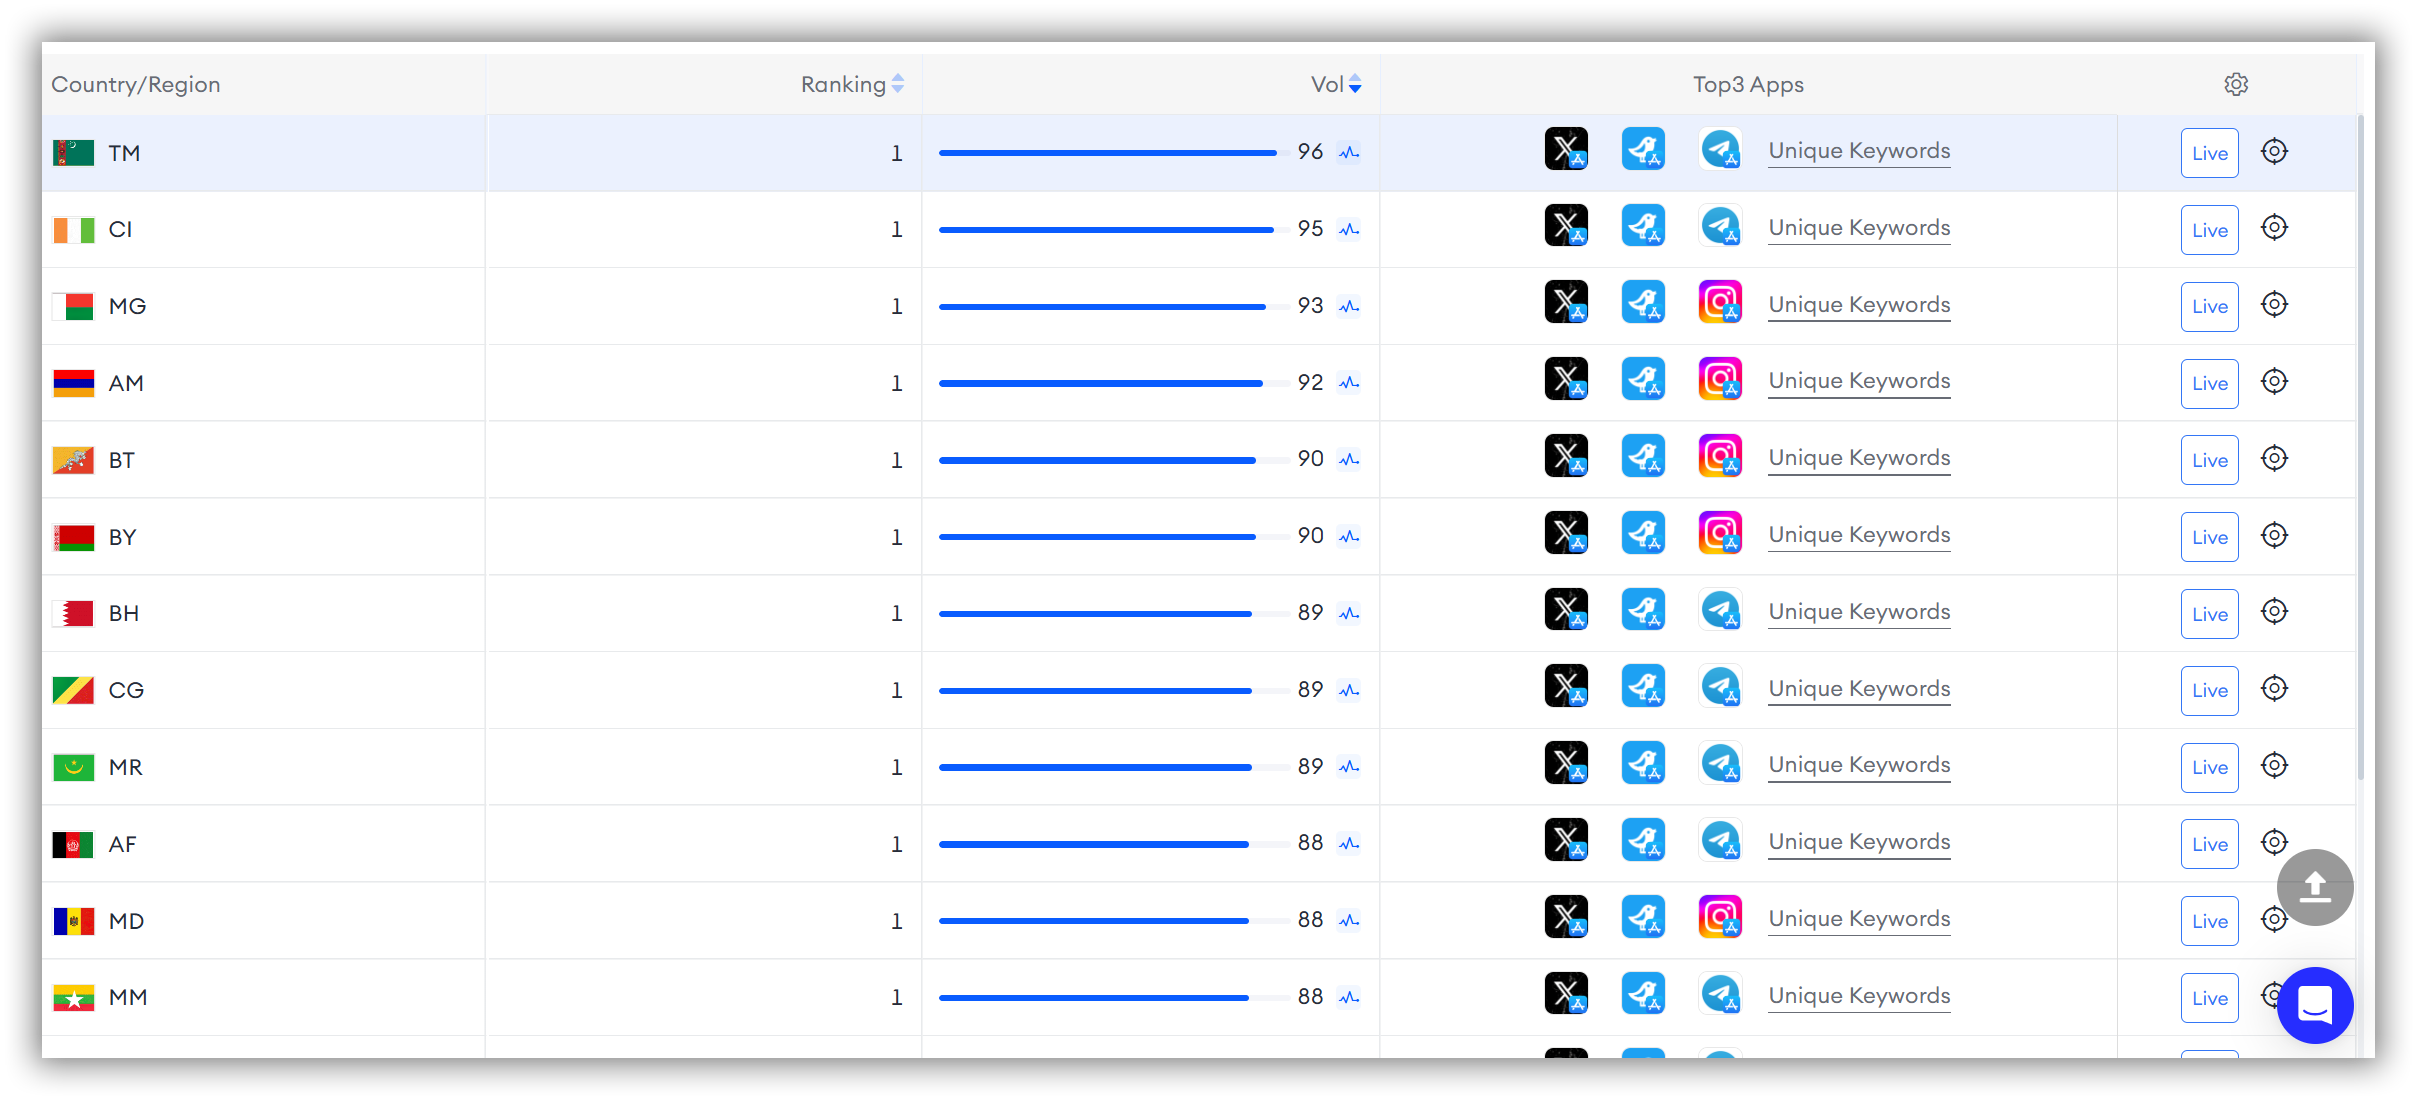
At the bottom, there is a detailed table that will assist you in conducting global research on the keyword from the dimensions of "Country/Region," "Ranking," "Volume," "Top 3 Apps," and "Live."
🗒️ Note: FoxData supports more in-depth research. You can click the line chart icon in the "Volume" column, the "Unique Keywords" under the "Top 3 Apps" column, and the "Live" icon in the "Live" column to obtain more intuitive related charts.
2. Status
App Status Global Overview
The Global Overview of Status allows you to view the global availability of the app you are tracking. This helps you assess market coverage to better allocate resources and marketing budgets, maximizing impact and return on investment in key markets.
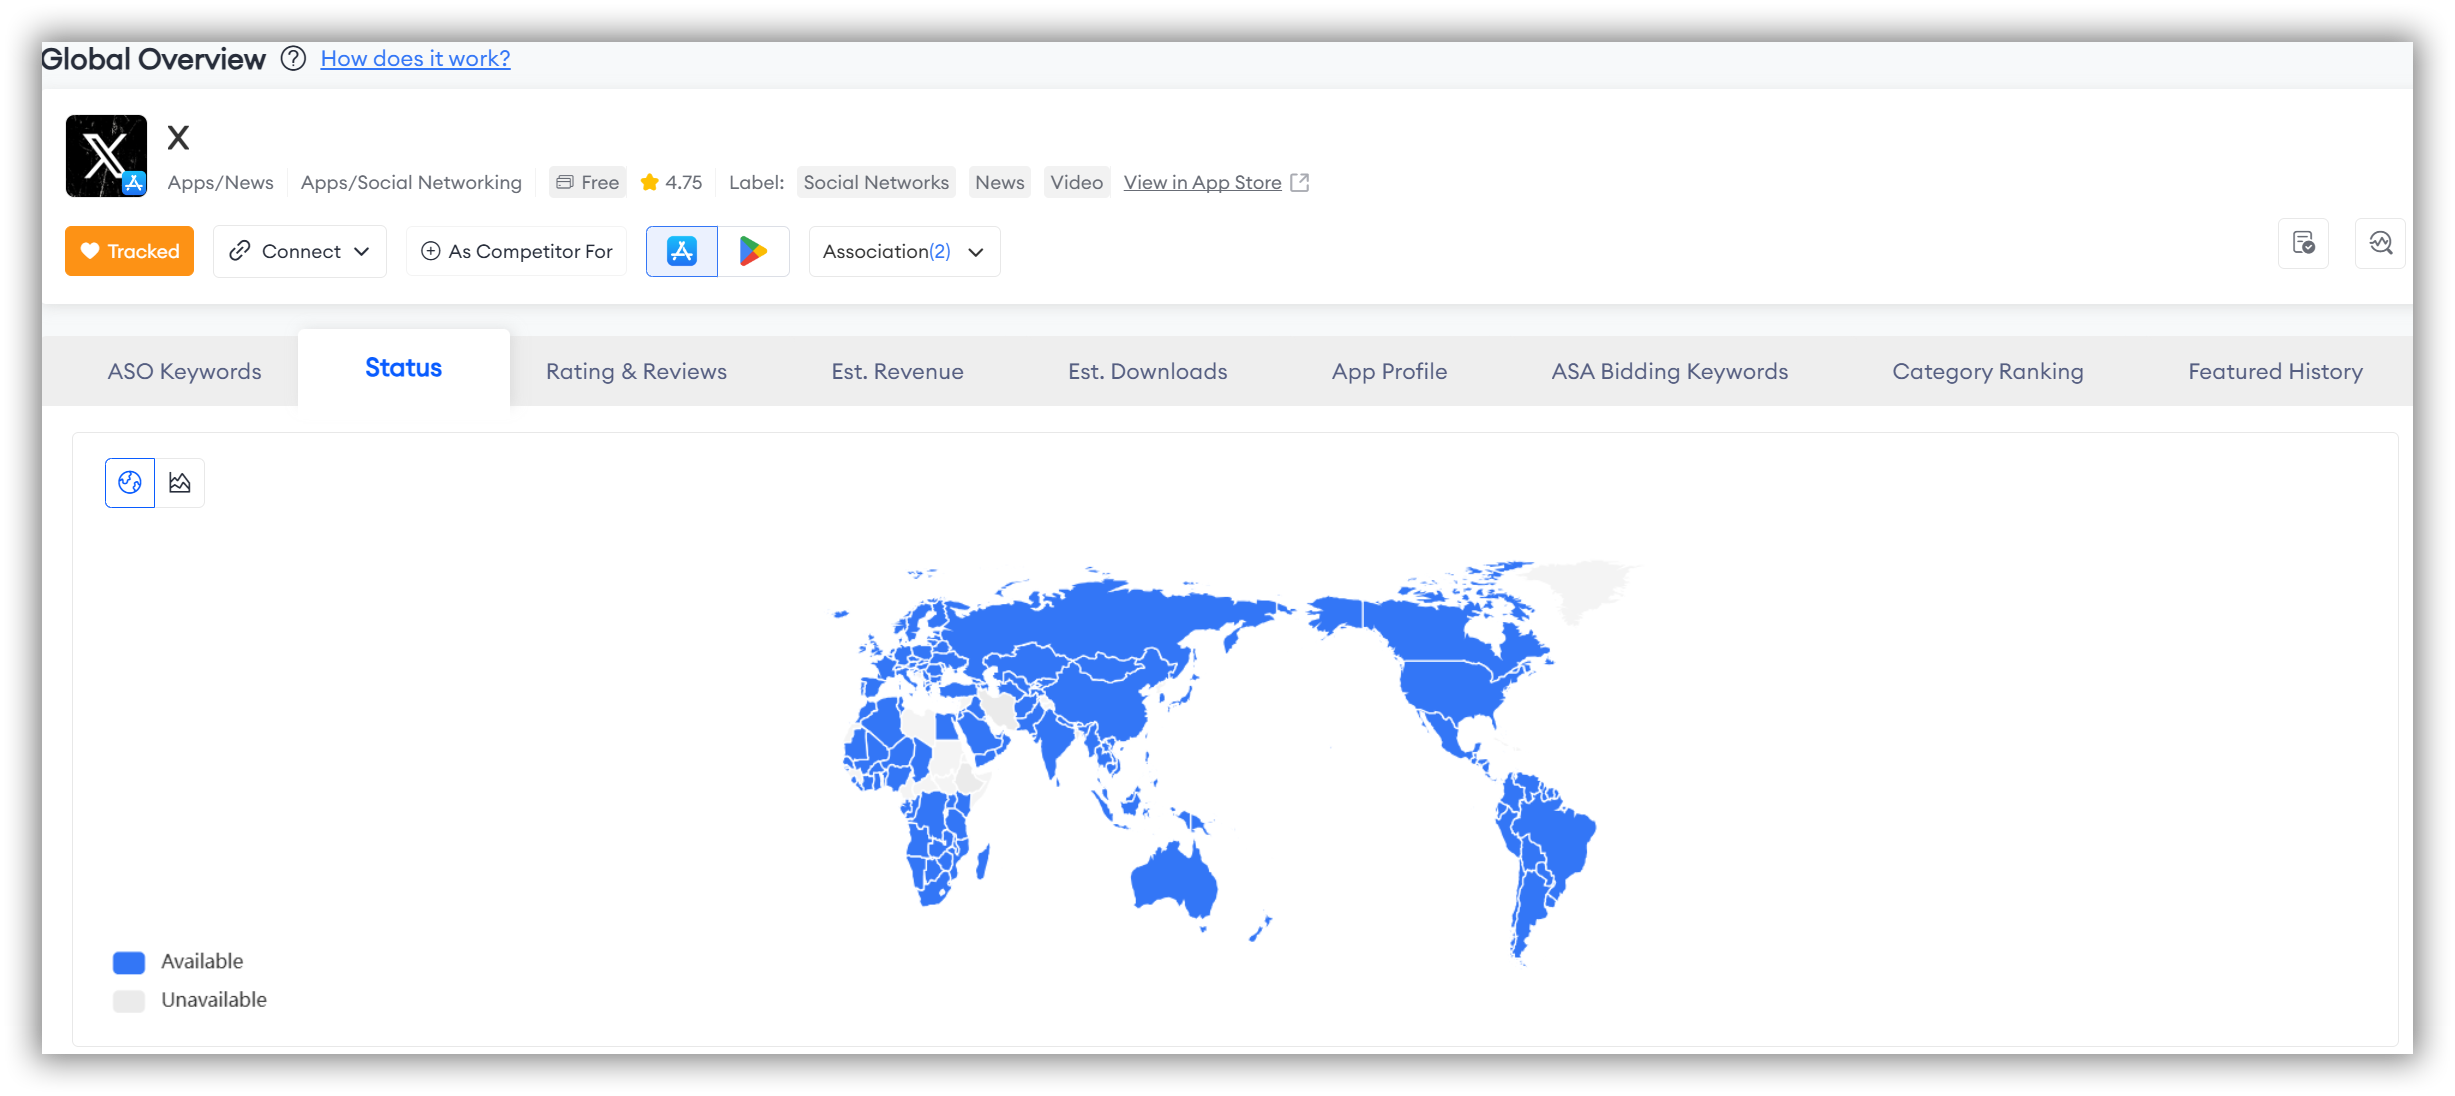
There are two ways to study the map data in this section. Specifically:
-
The first method allows you to view the global overview. Here's how it works:
As seen when you first open the page, blue represents "Available," and gray represents "Unavailable." The map on the right corresponds to the colors on the left, indicating different availability statuses.
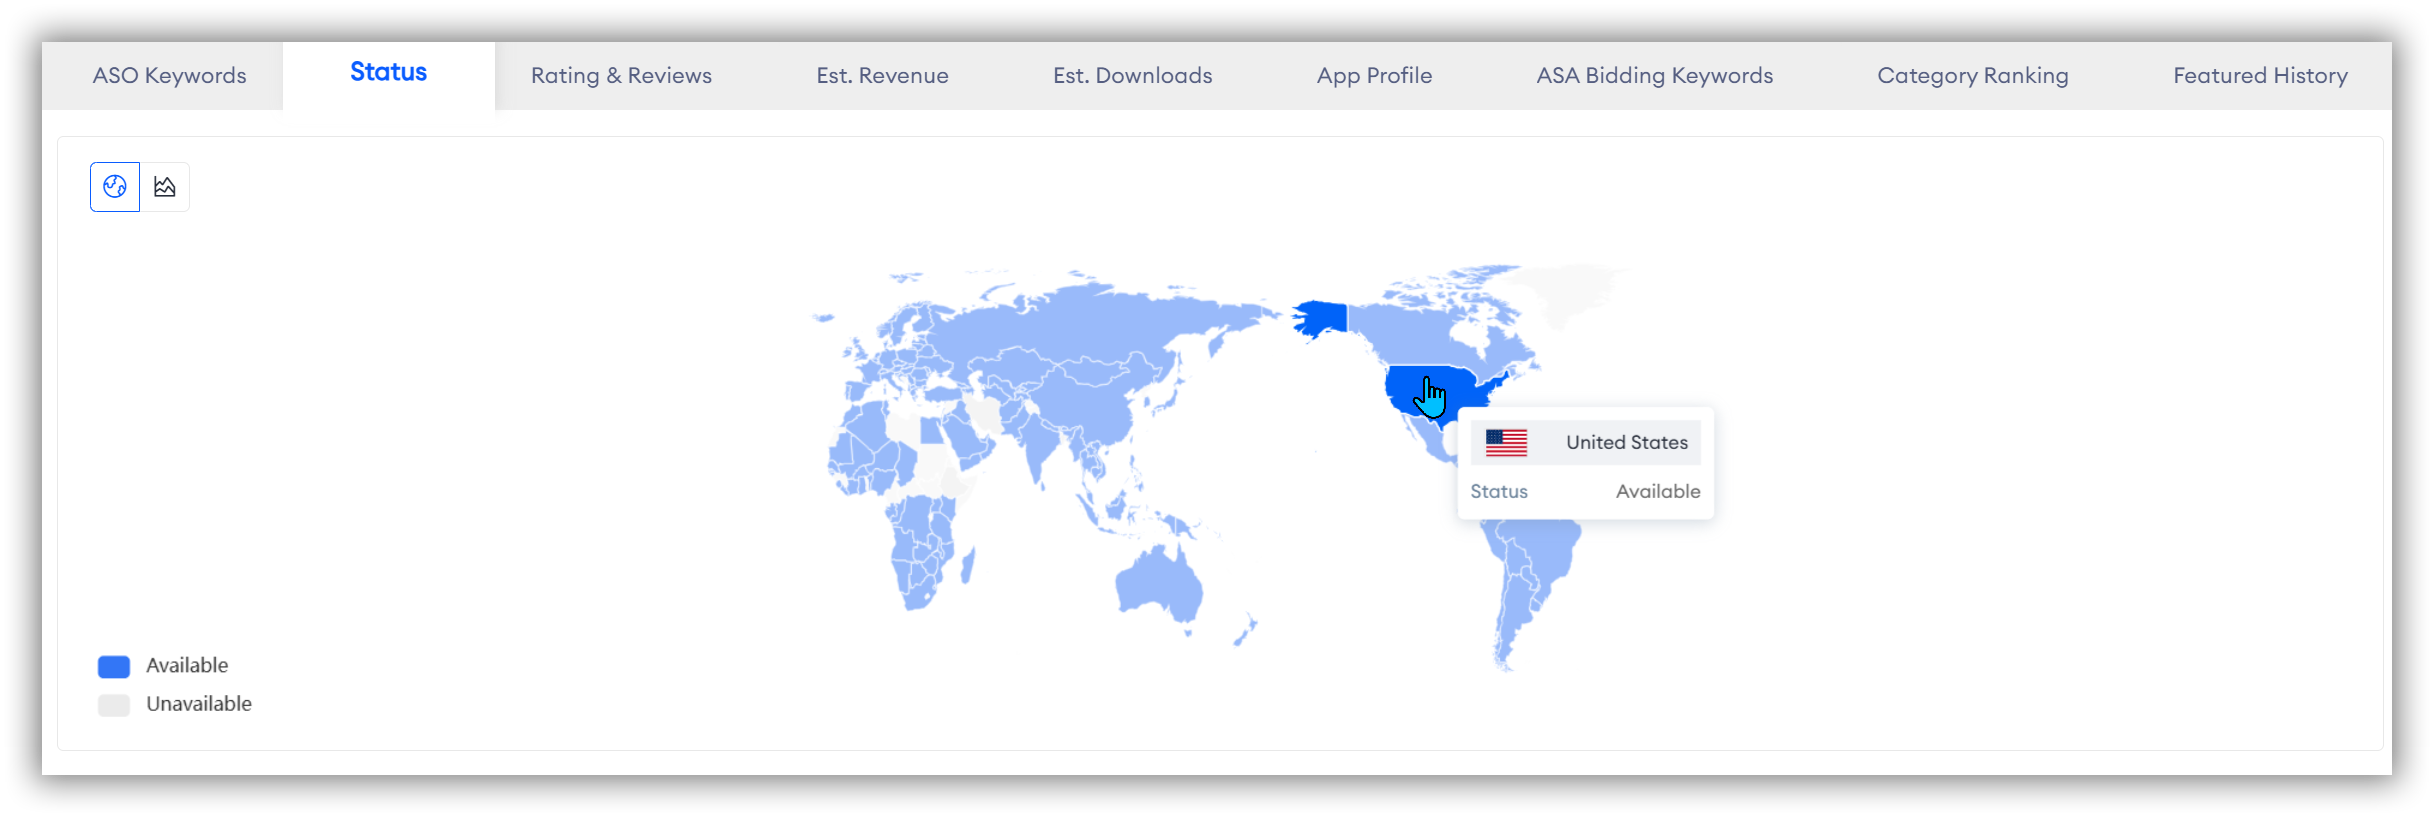
- The second method allows you to conduct a more precise and personalized study of the regions you are interested in. Here's how it works:
Simply hover your mouse over the ranking data axis on the left or the map on the right.
App Status Trends
If you want to understand the historical availability of the app you are tracking, simply click the line chart icon in the top left corner.
By analyzing the app's availability at different points in time, you can assess whether past market entry strategies were effective and identify which regions experienced success.
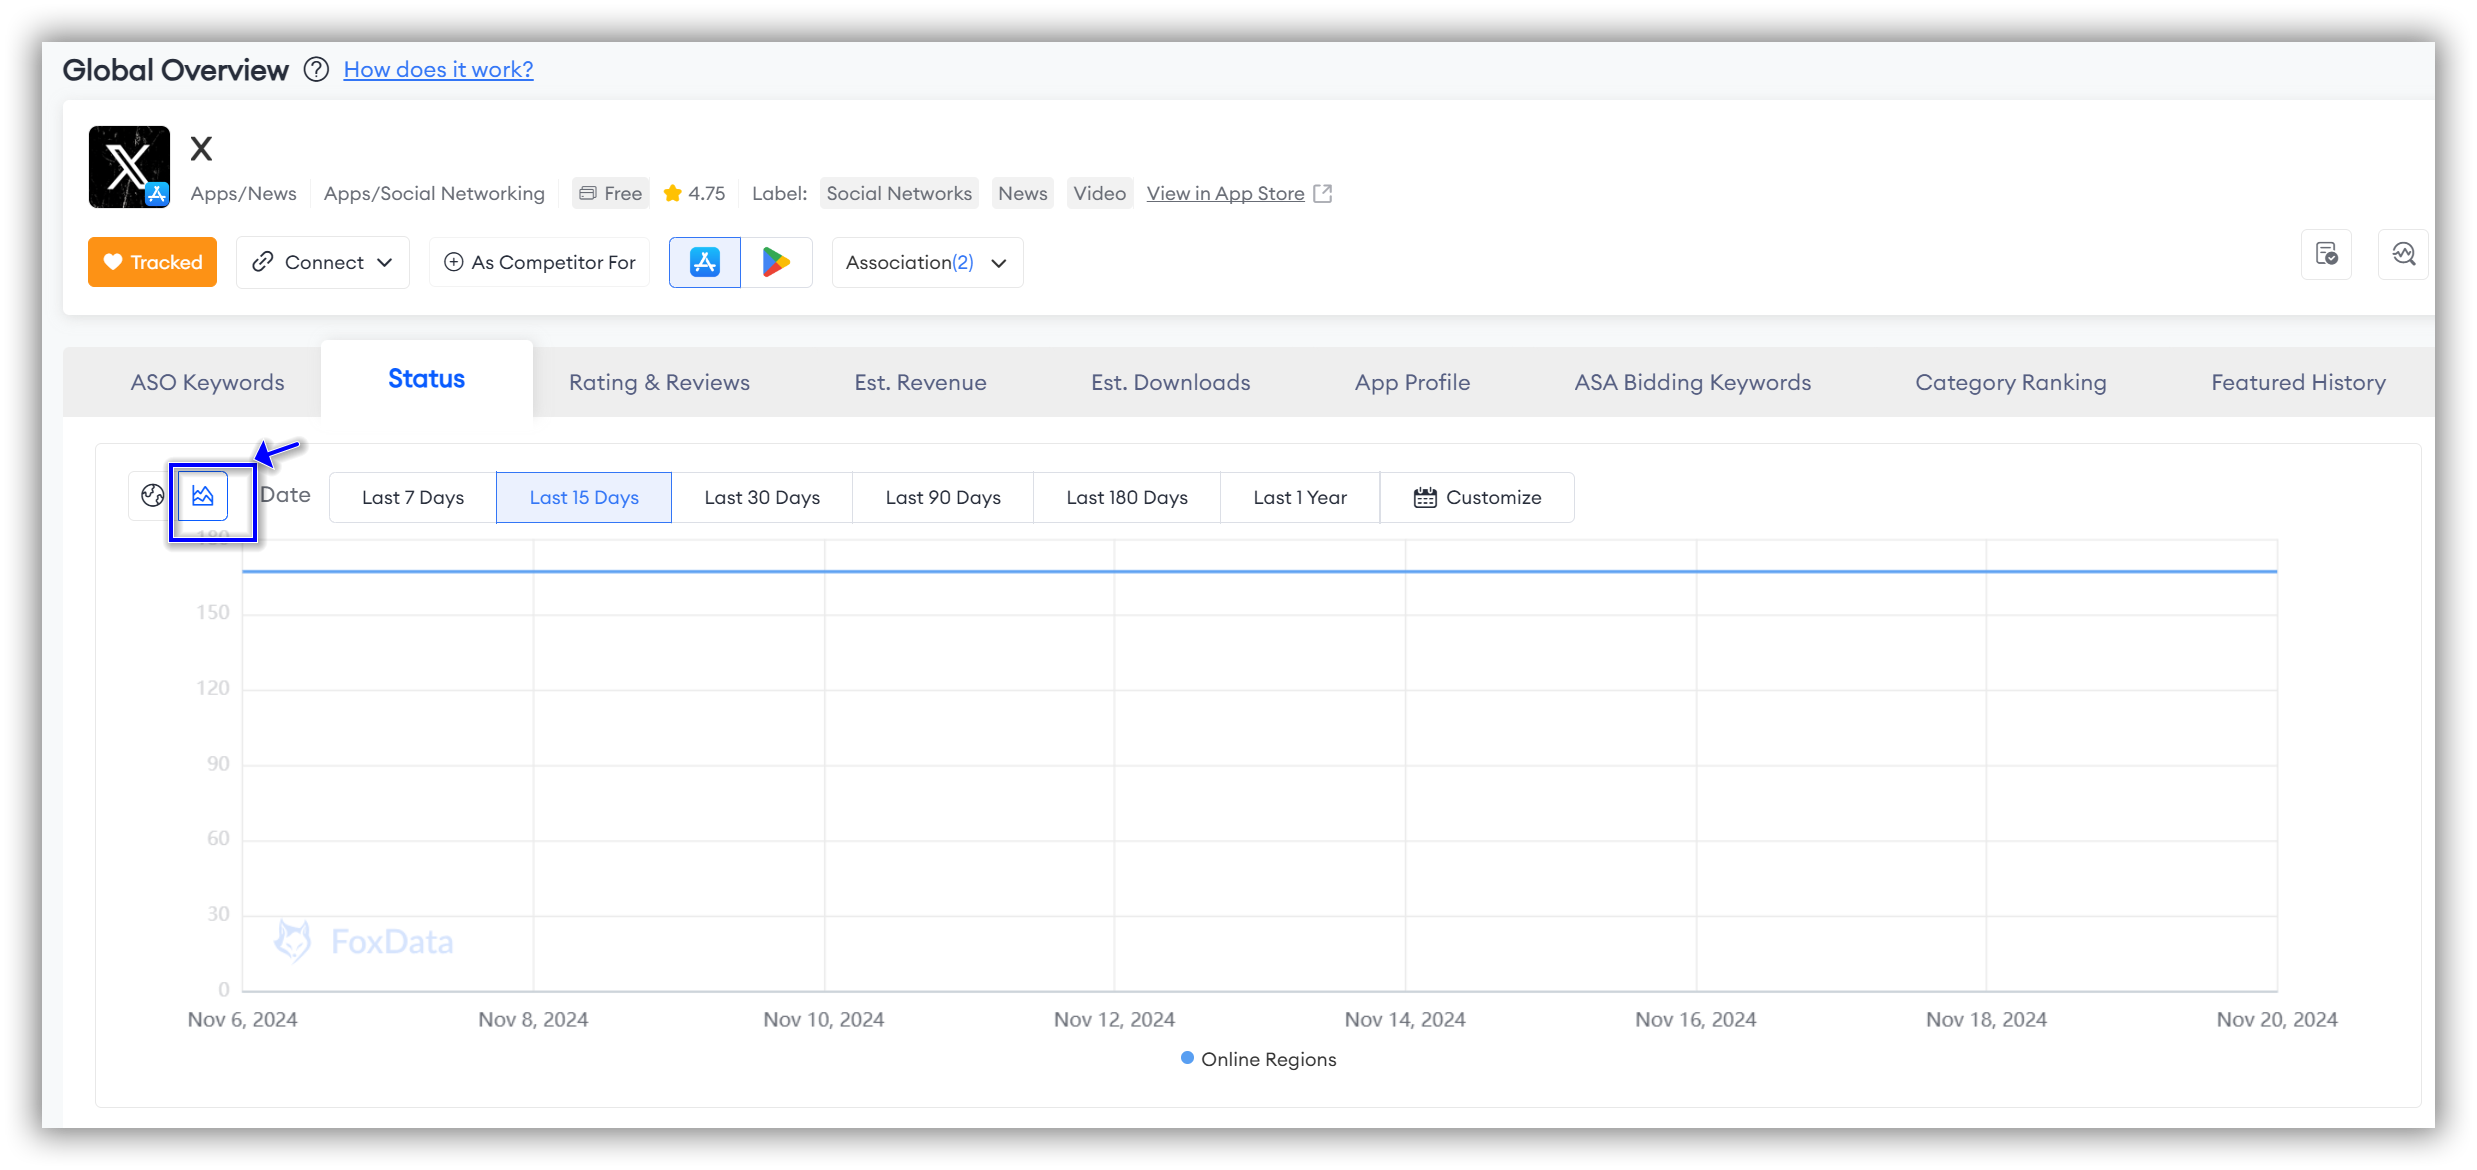
🗒️ Note: You can not only filter by the default time dimensions but also customize the time period you want to explore by selecting "Customize."
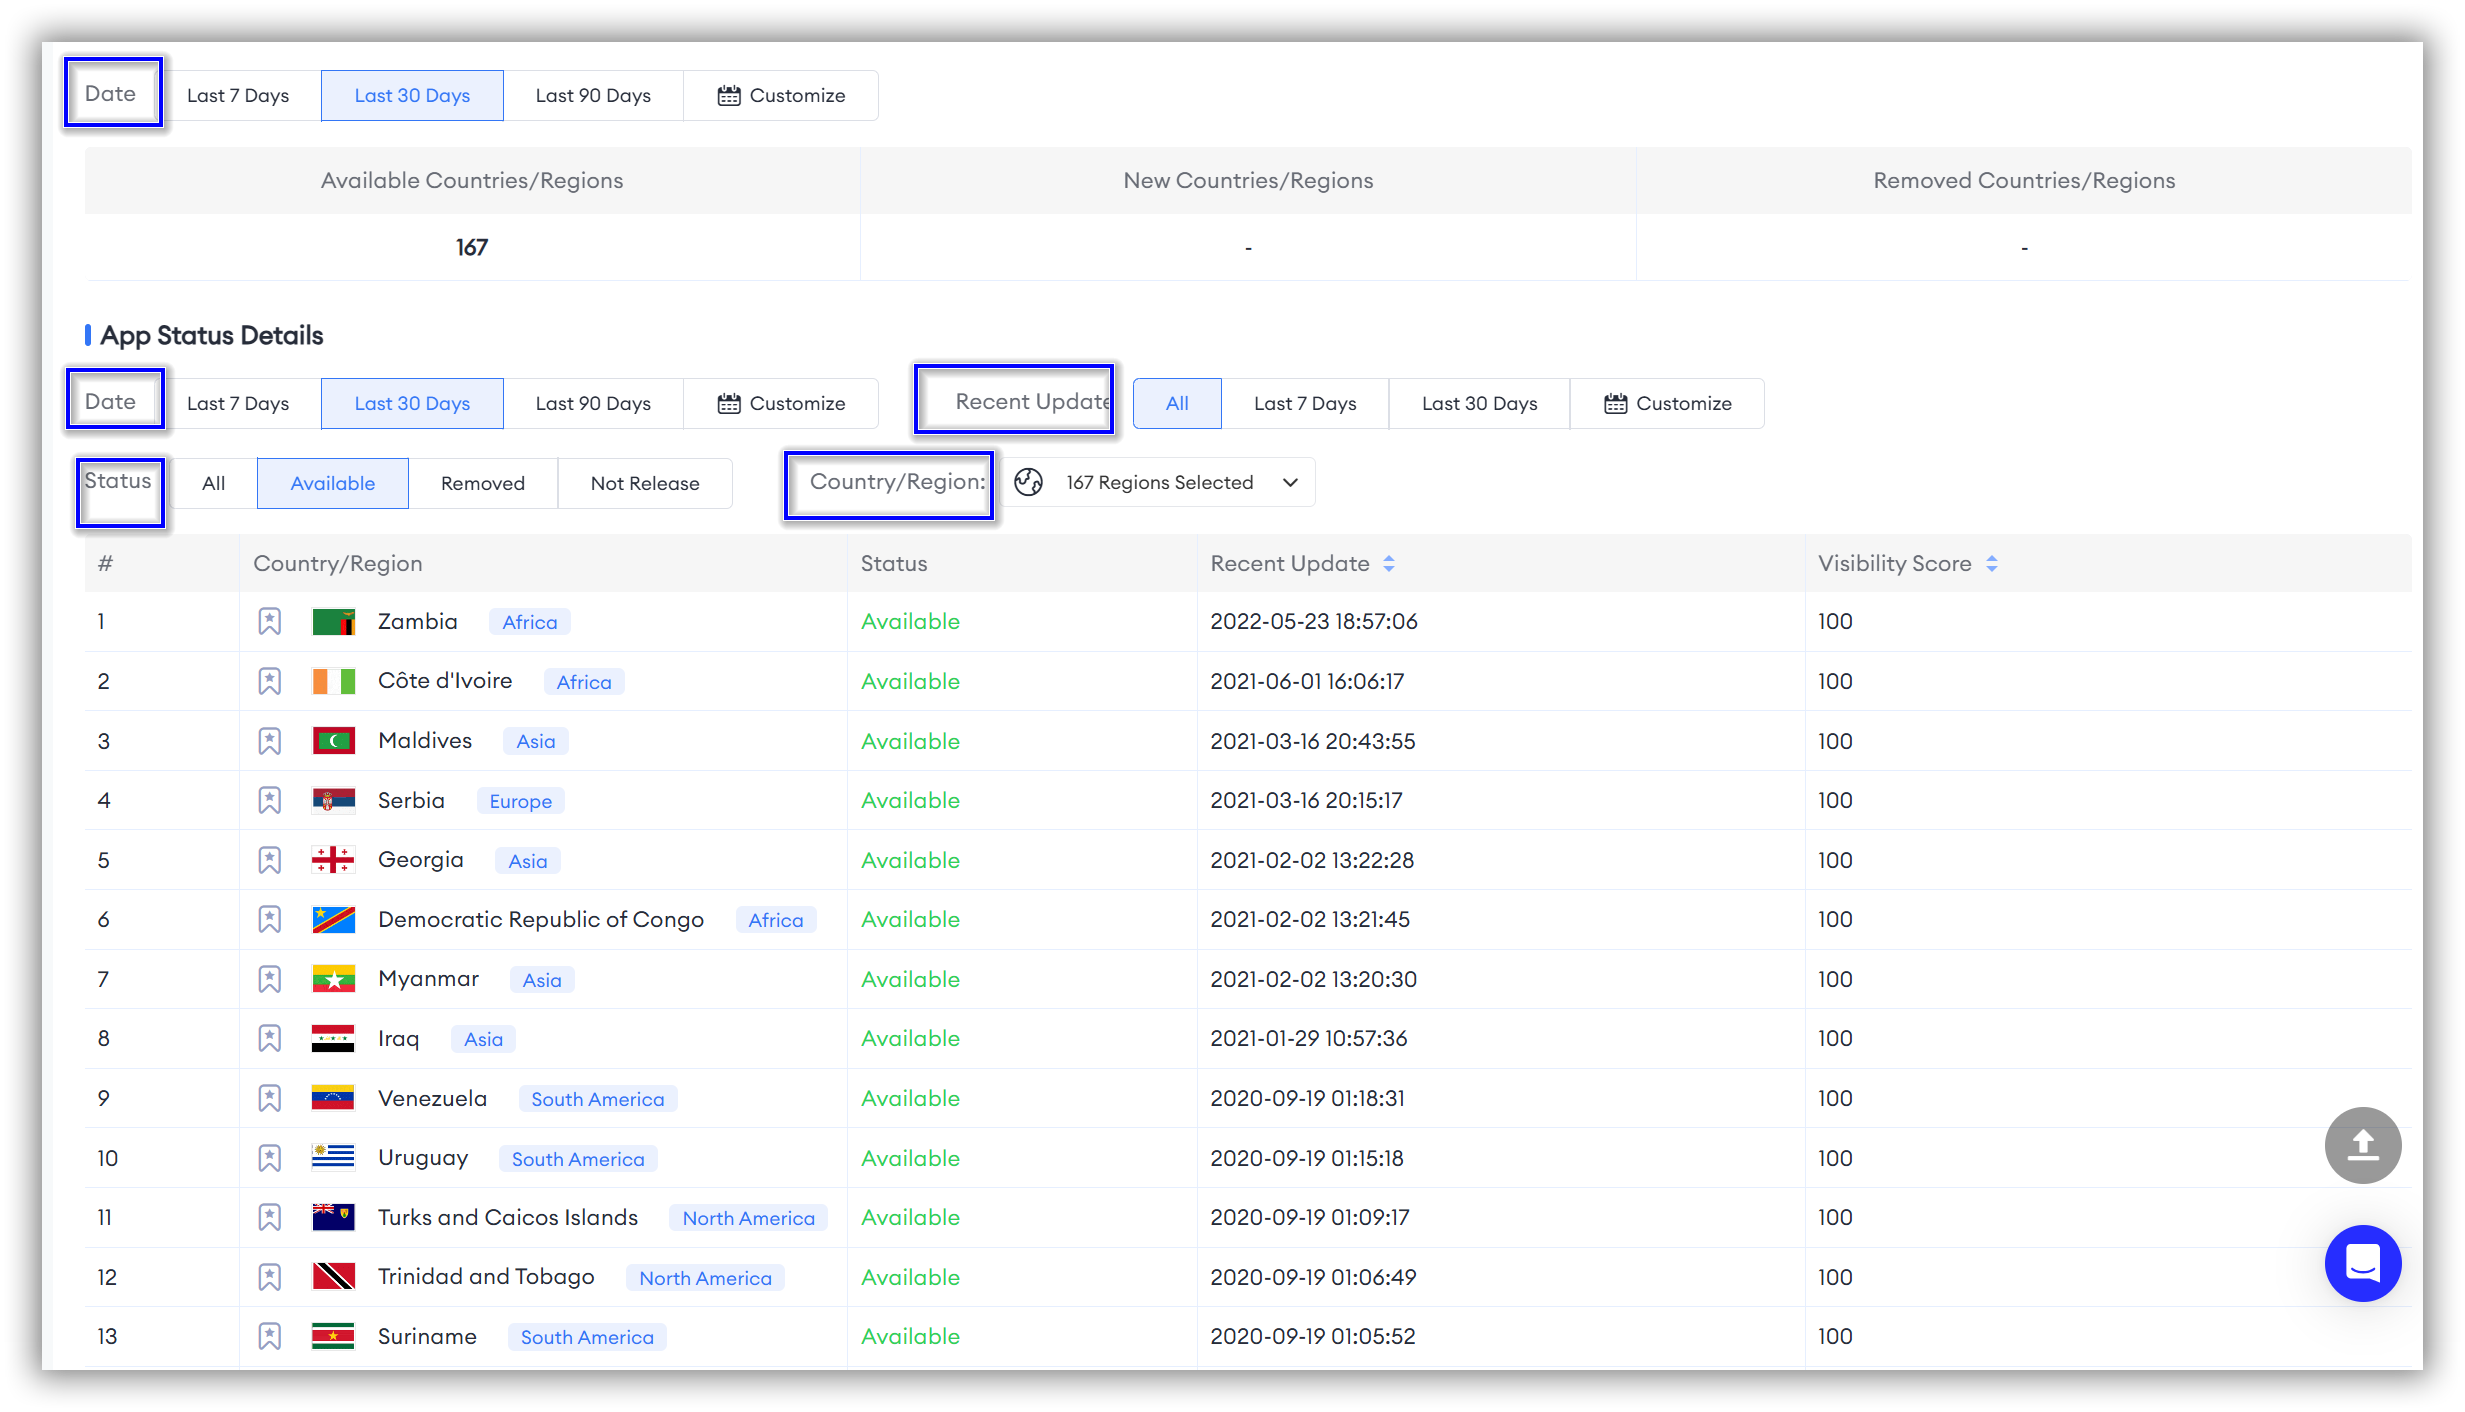
App Status Details
After getting a basic global overview, you might want to delve deeper into the Status Details of each country.
3. Ratings&Reviews
Ratings&Review Global Overview"Ratings & Review" allows you to view the Global Overview of Ratings & Review, which provides valuable insights and benefits for developers and marketers by offering a comprehensive view of user feedback across different regions.
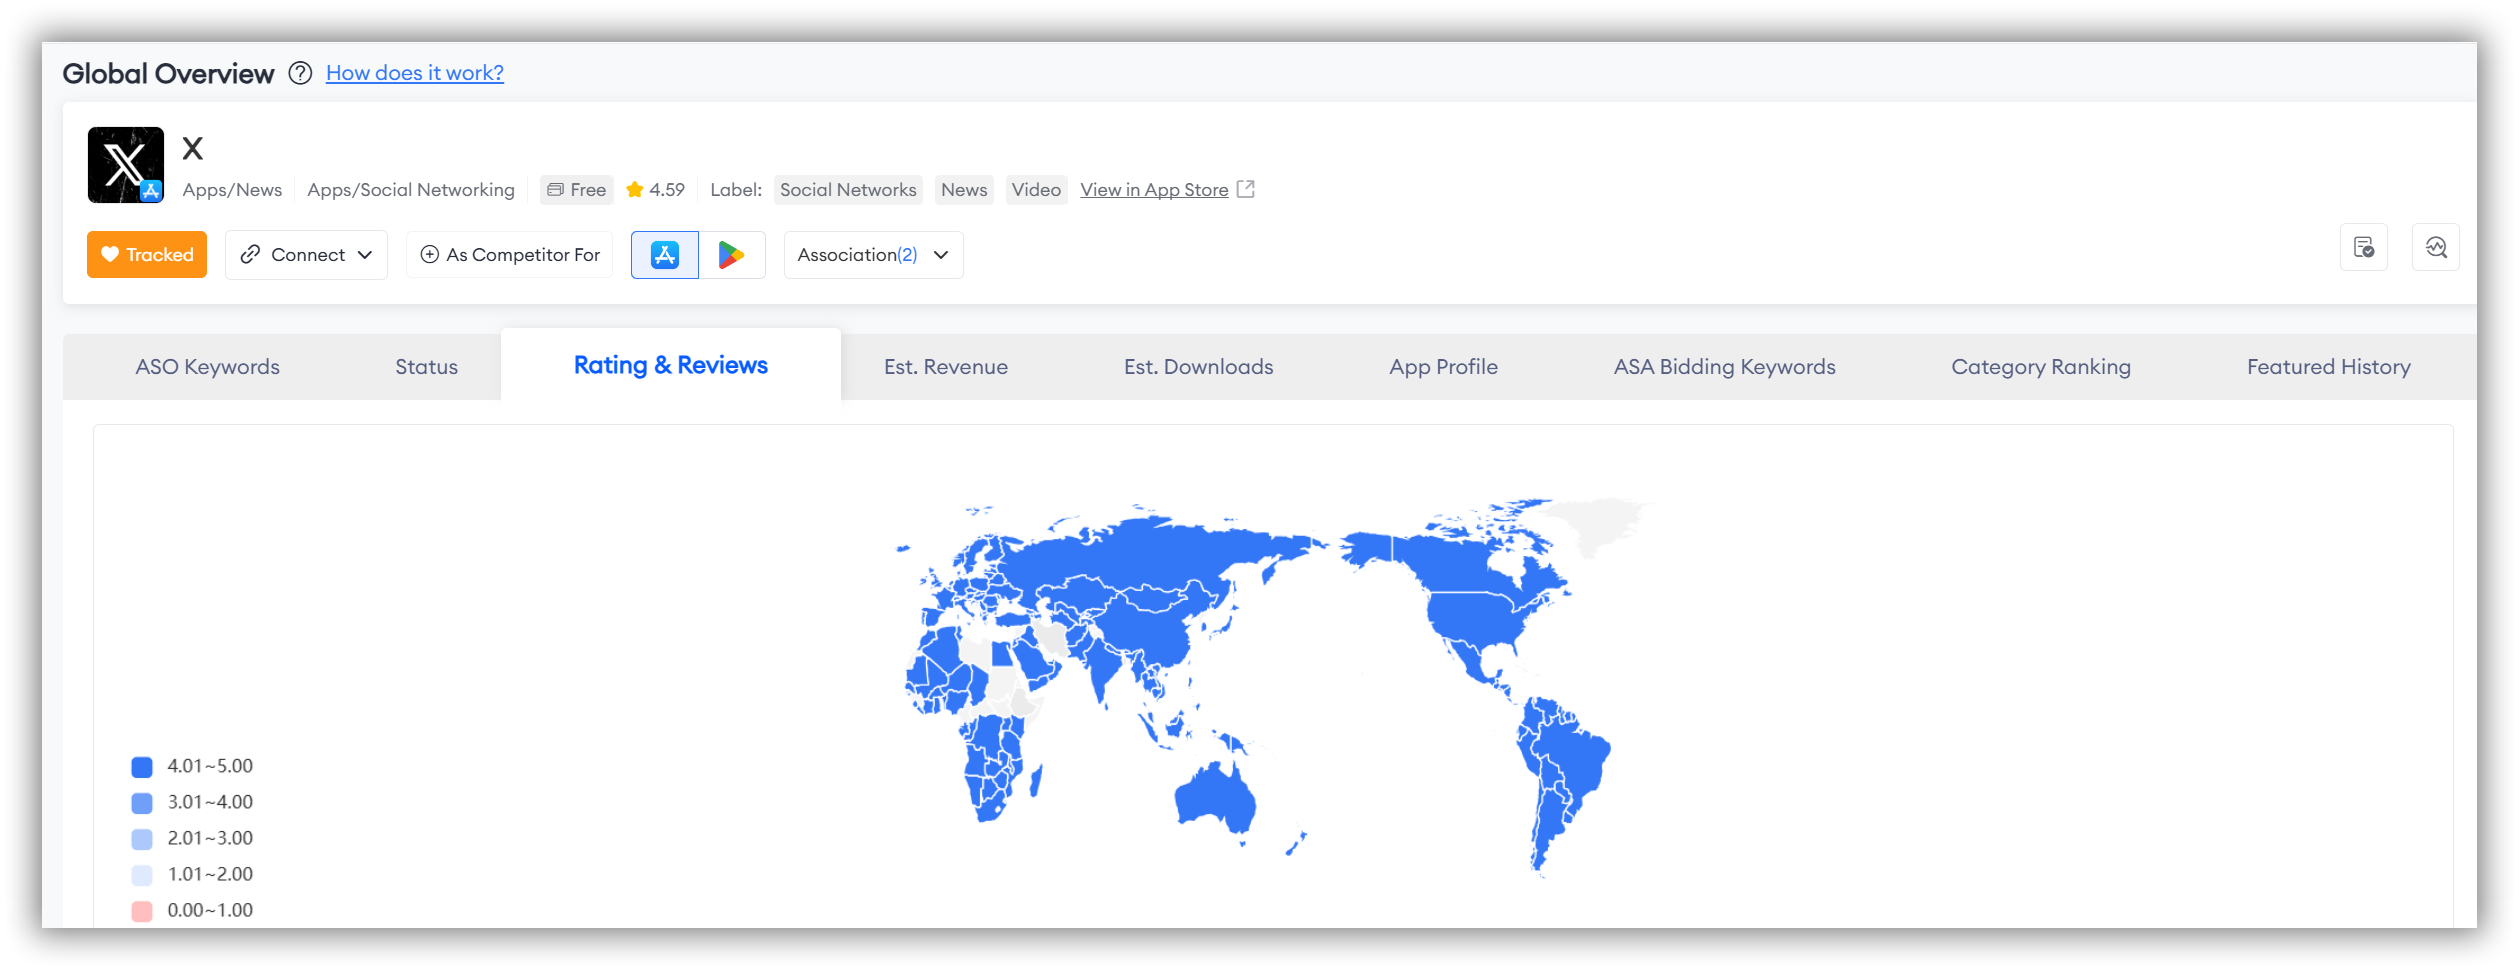
- The first method allows you to view the global overview. Here's how it works:
When you first open the page, you'll see different colors on the left side representing various data. The map on the right corresponds to these colors, representing different data points.
The deeper the shade of blue, the higher the ratings; conversely, lighter shades indicate lower ratings, with red representing the lowest ratings.
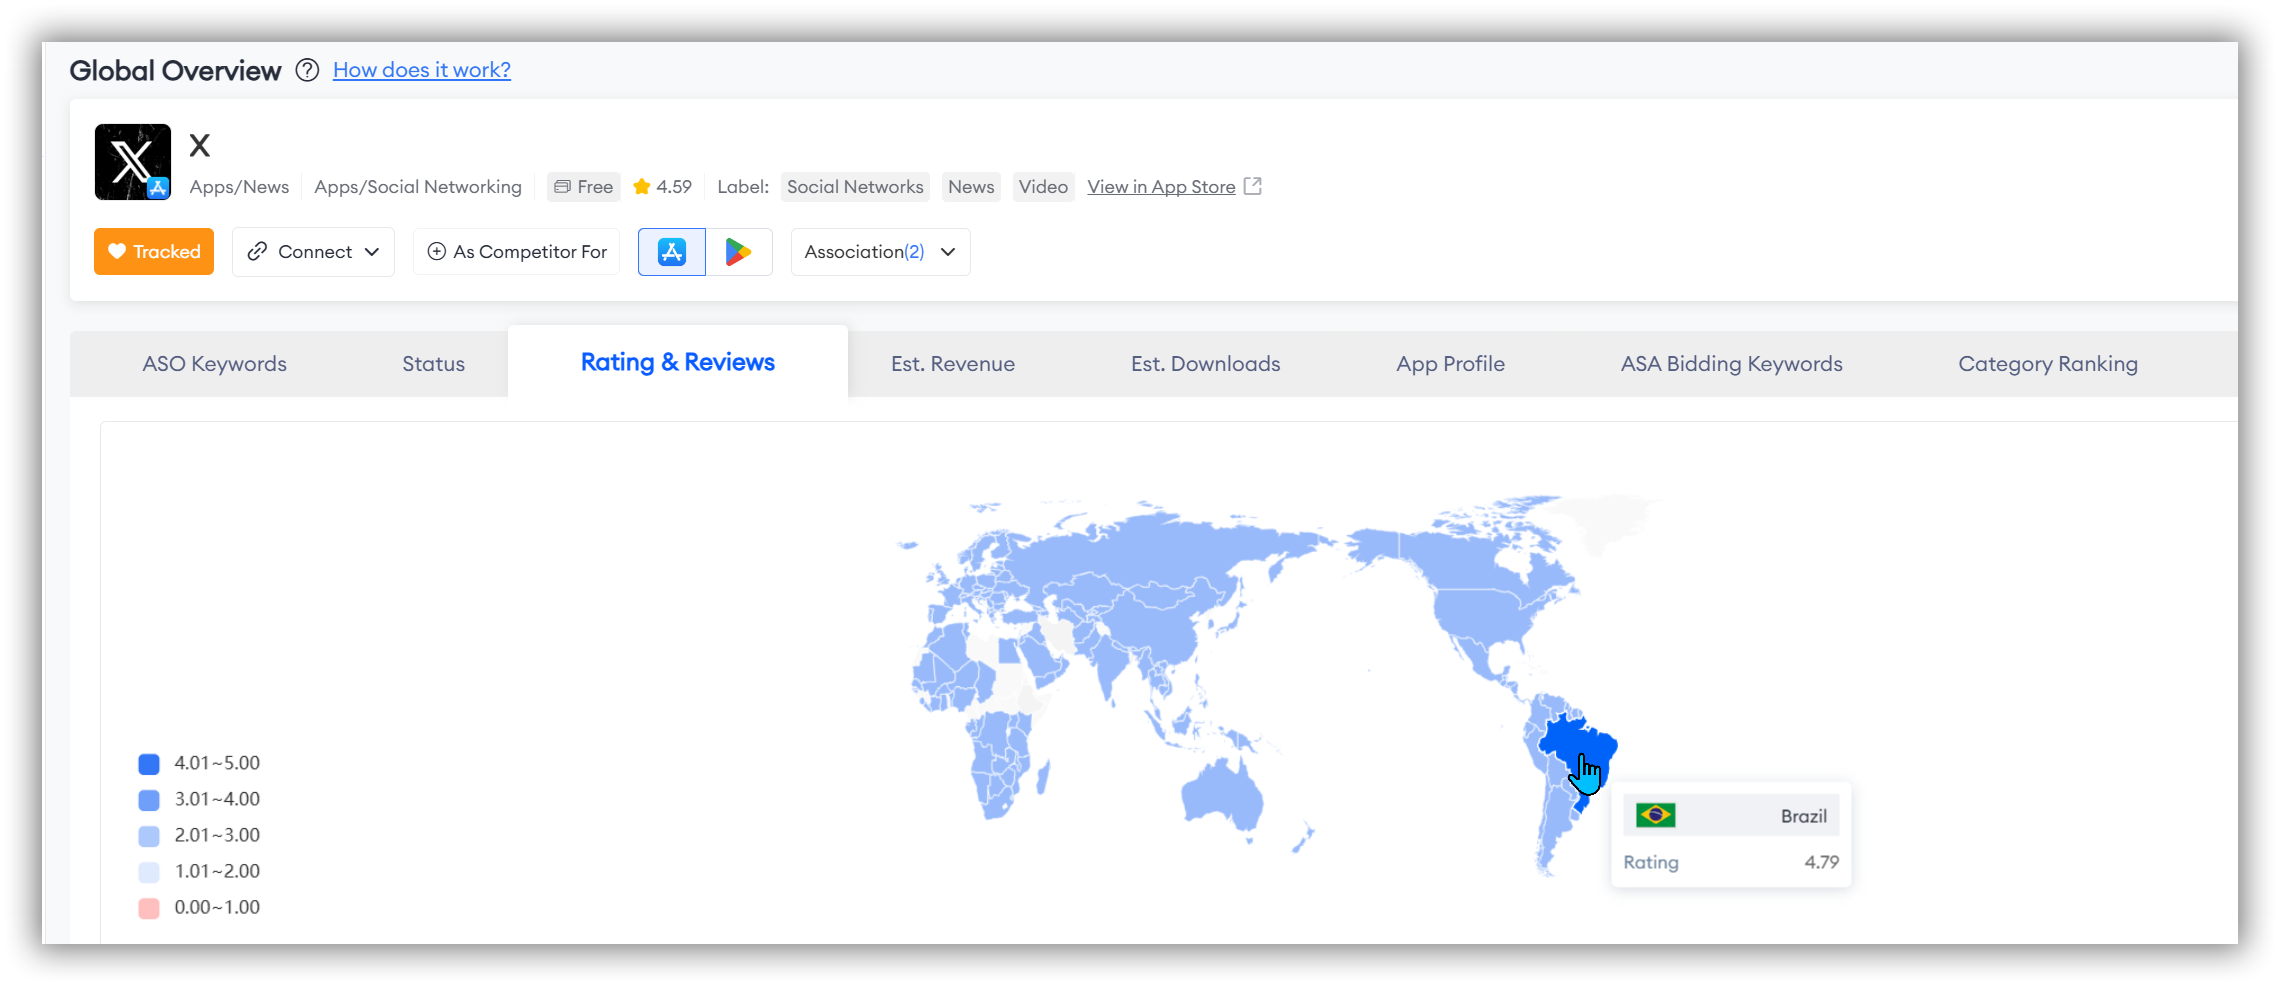
- The second method allows you to conduct a more precise and personalized study of the regions you are interested in. Here's how it works:
Simply hover your mouse over the ranking data axis on the left or the map on the right.
Ratings&Review Details
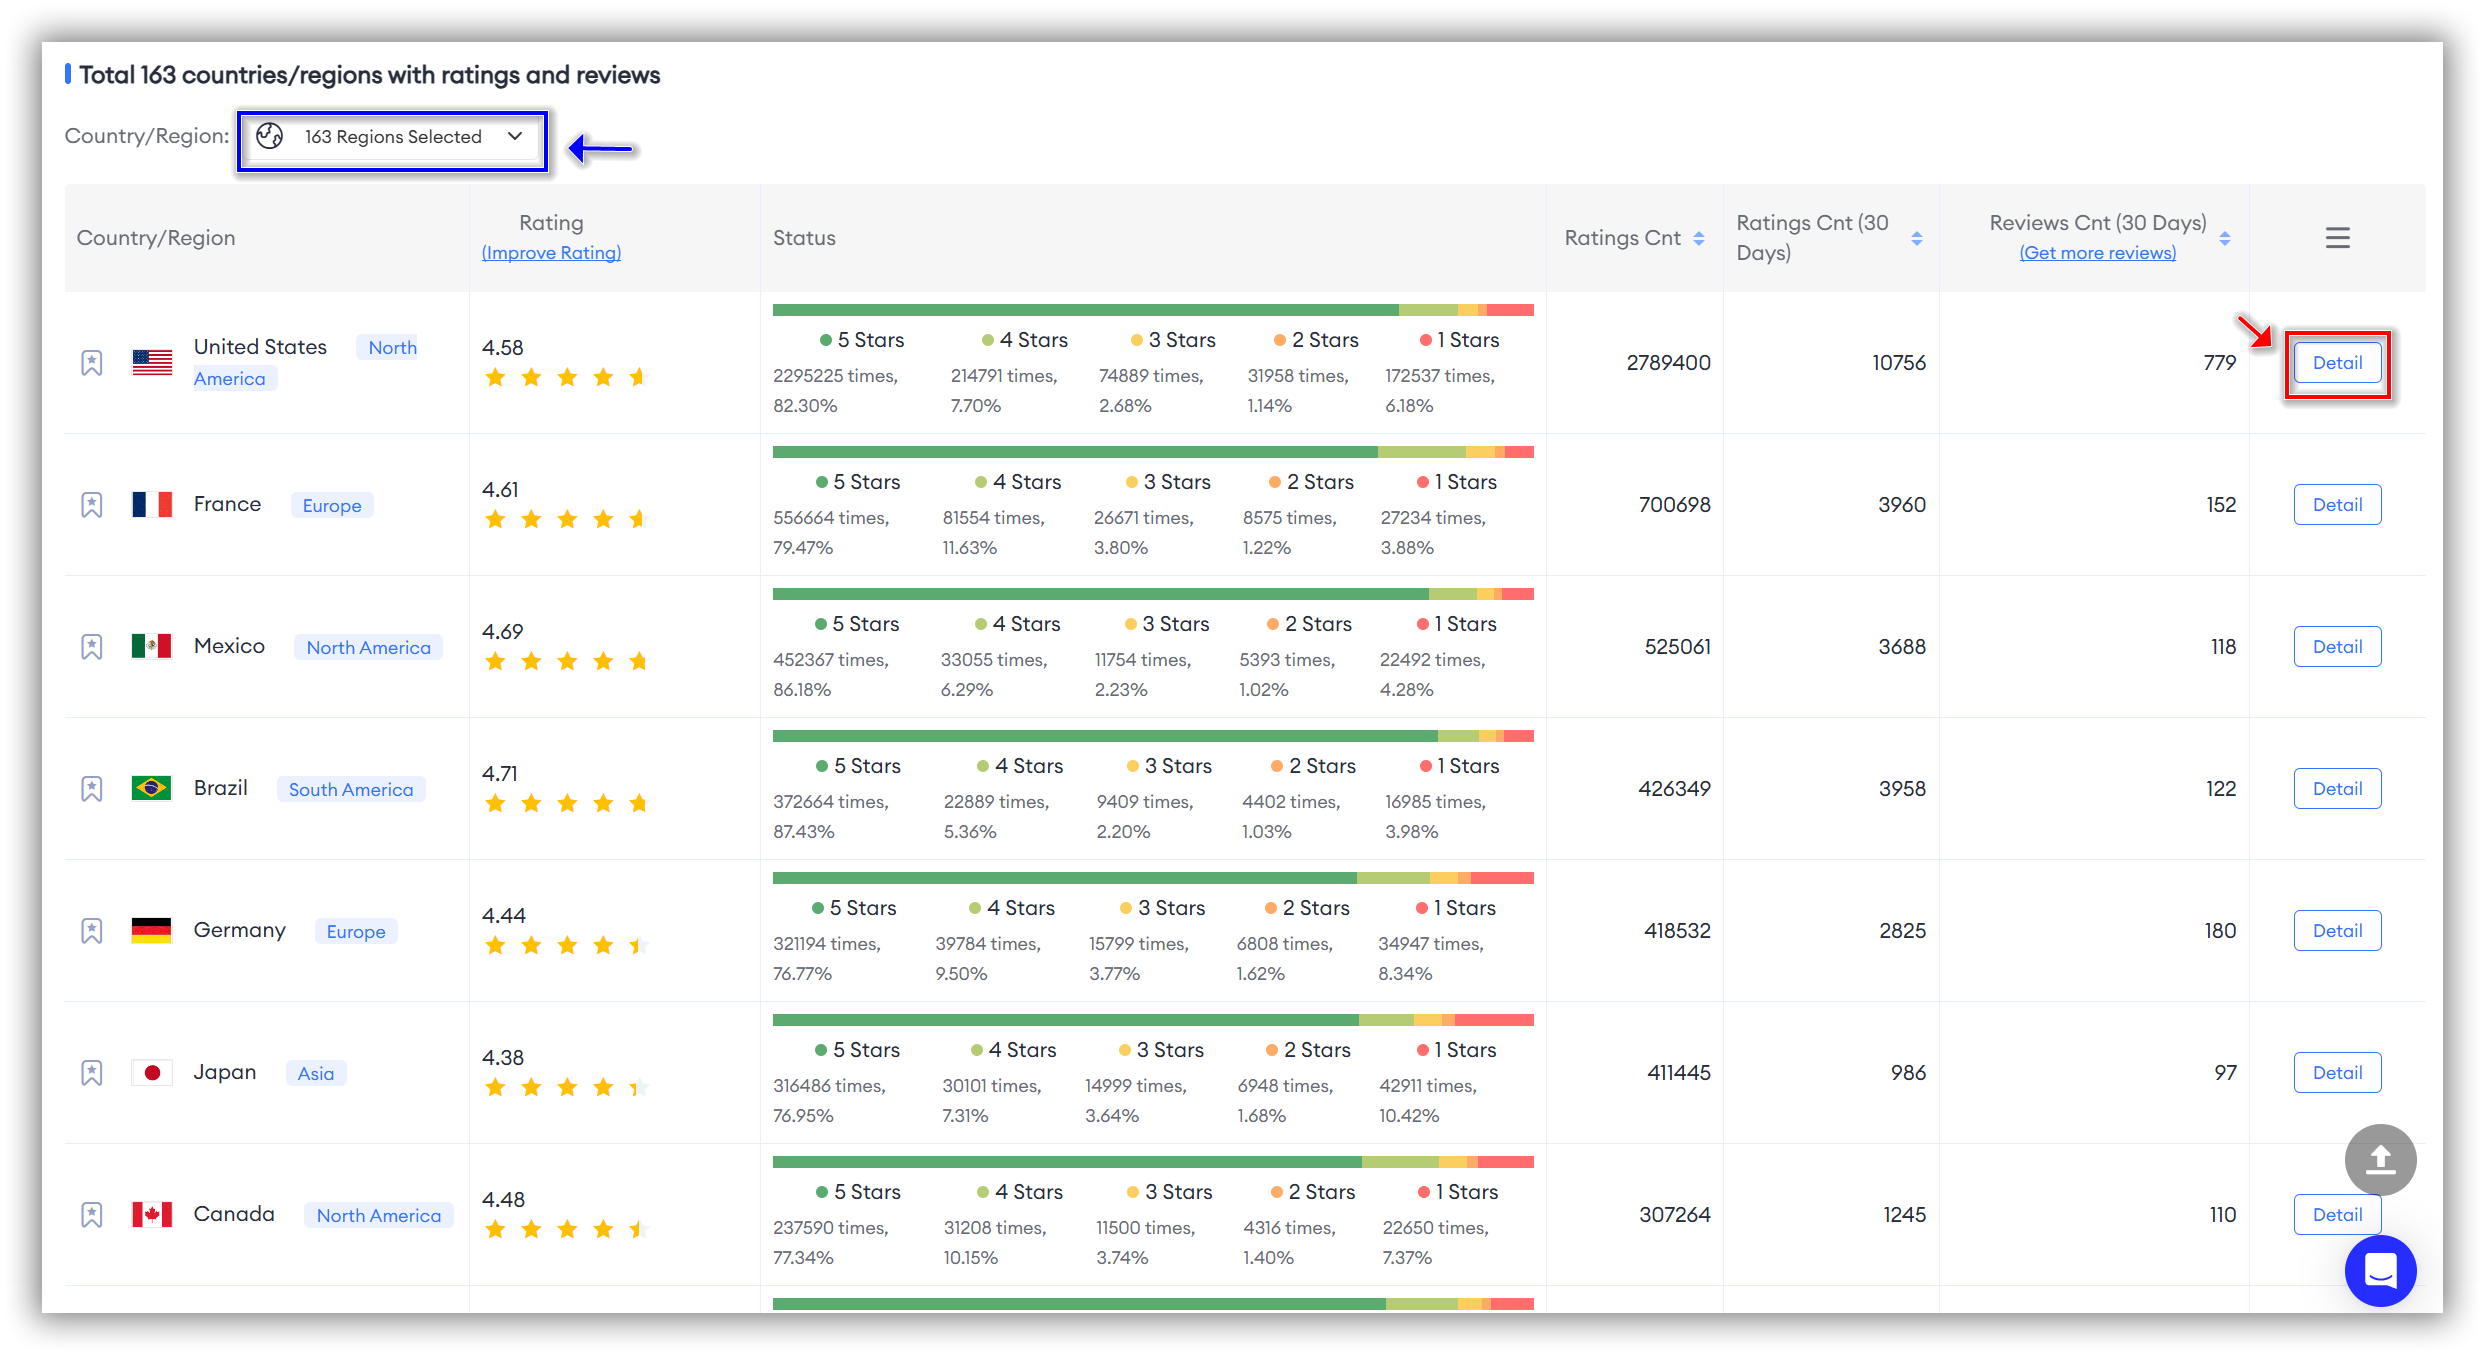
If you want to explore specific details for each country, simply scroll down to access data on "Rating," "Status," "Ratings Count," and "Ratings Count" (30 Days) for each country.
🗒️ Note: FoxData supports more personalized needs, allowing you to filter by country in the top left corner to view specific details of interest.
For more information, feel free to click on "Details" in the last column corresponding to each country to jump to the "Ratings & Reviews" feature for further insights.
💡 Read More: How to Craft a Targeted Marketing Strategy With the "Review & Ratings" Feature.
4. Est. Revenue
Global Revenue Overview
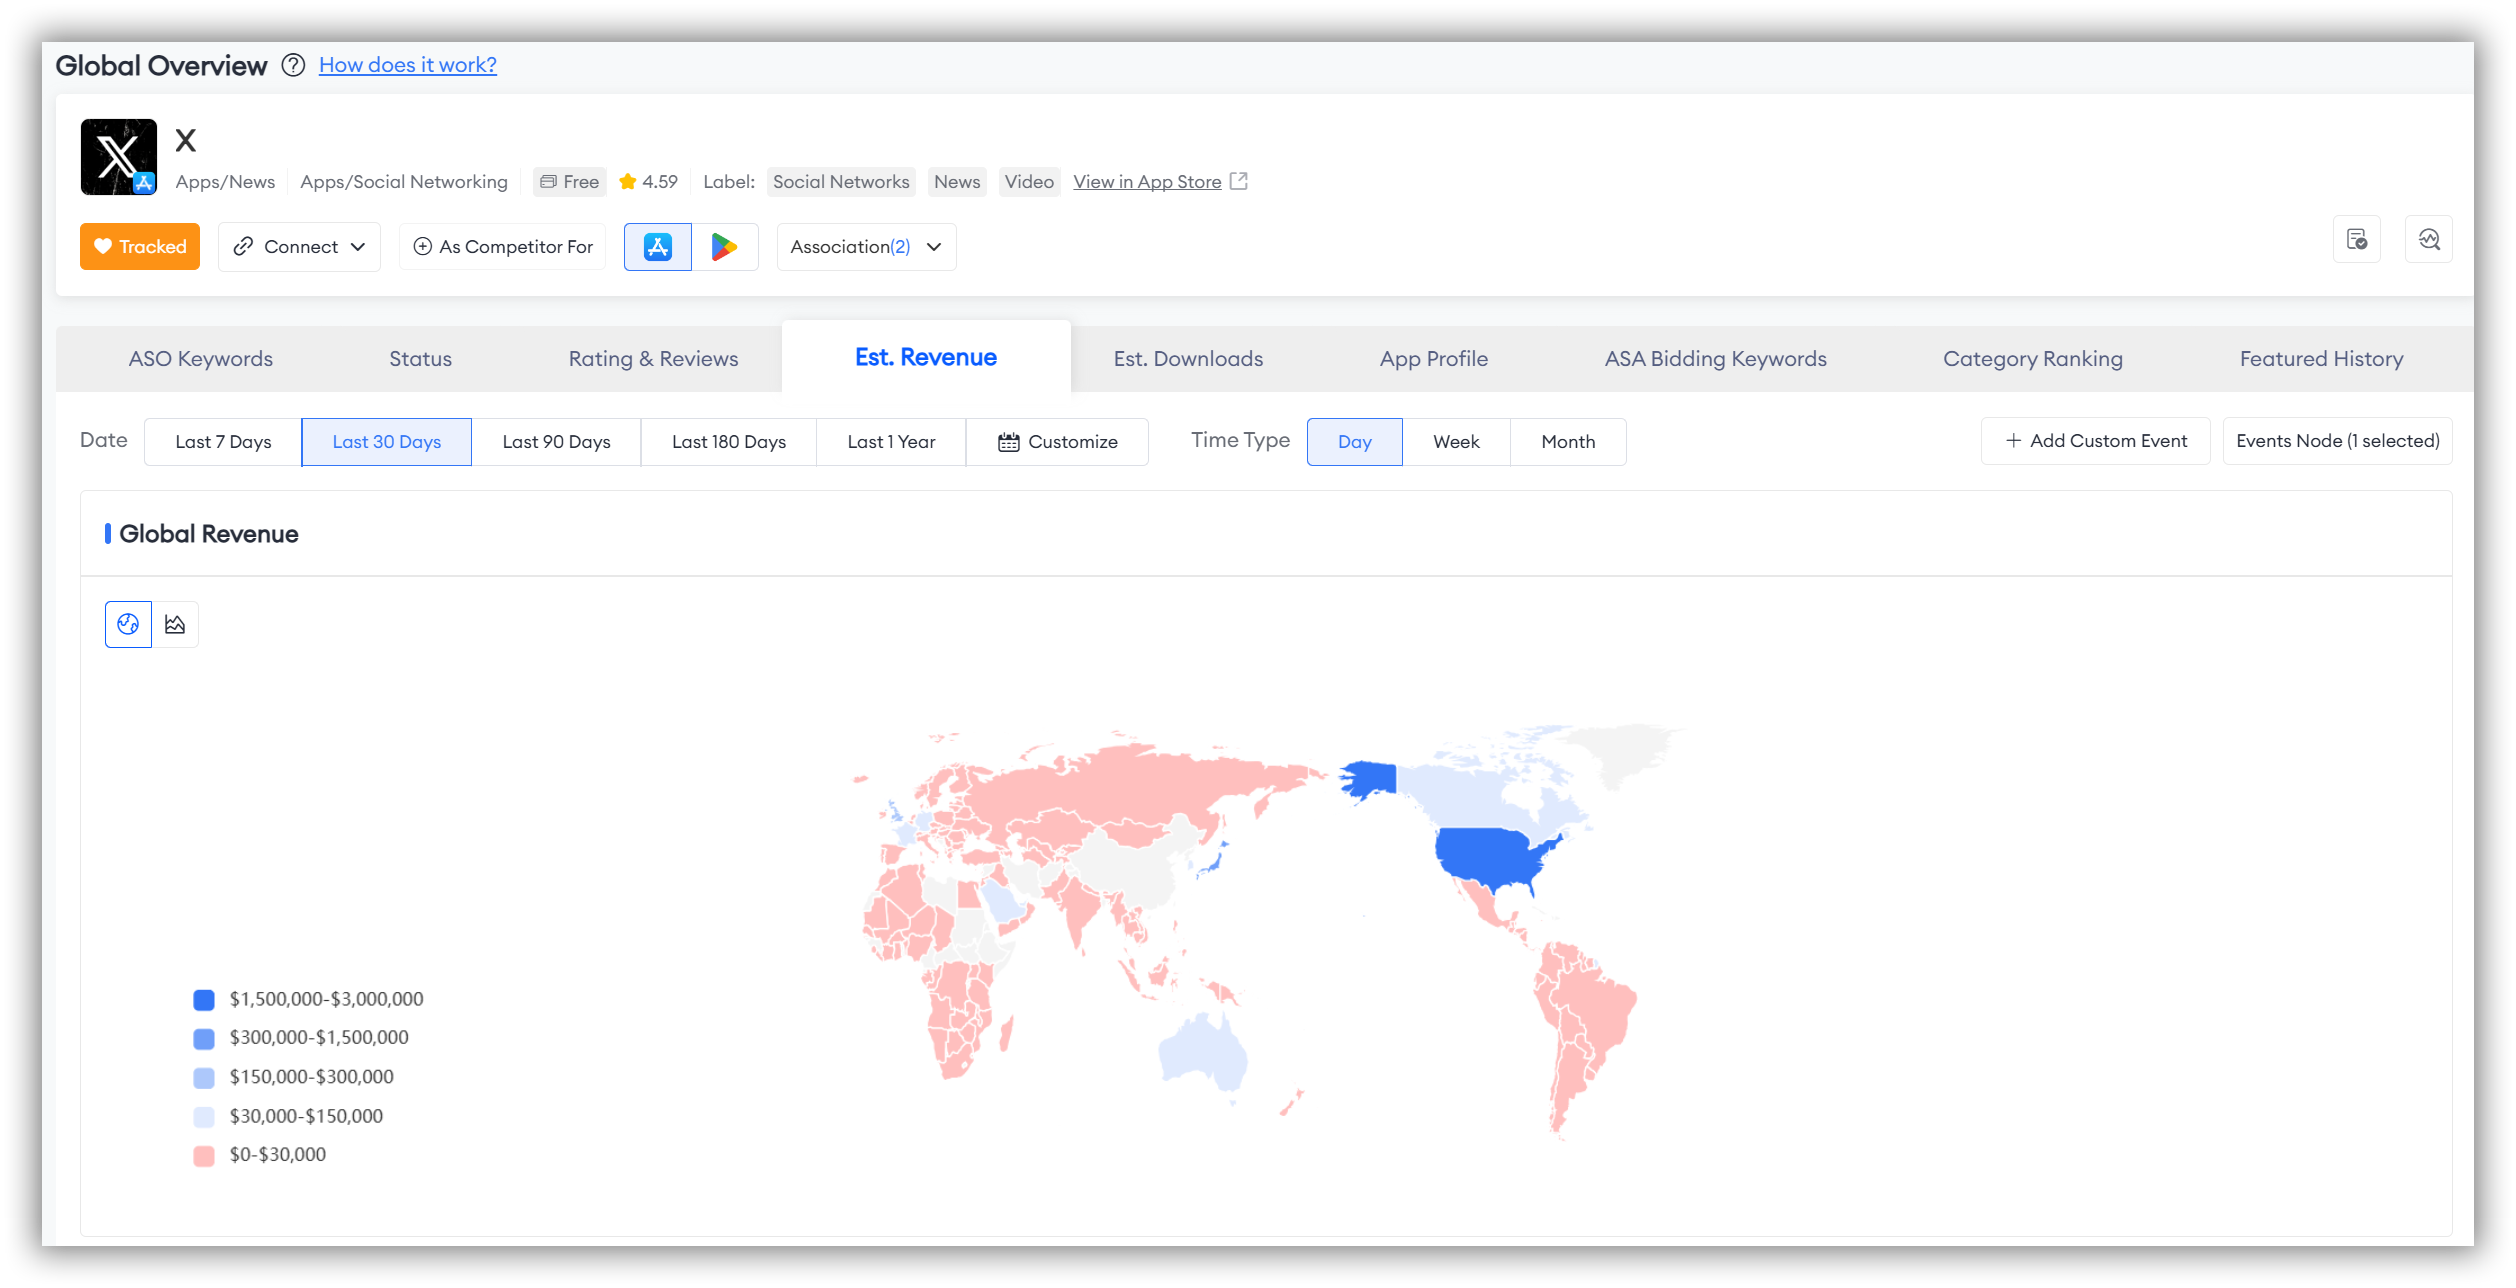
"Global Revenue" allows you to view the global overview of estimated revenue for the apps you are tracking. This helps you understand the revenue contributions from different regions, enabling you to identify which markets are major revenue sources and optimize your market strategies accordingly.
Additionally, by comparing estimated revenue across regions, you can identify markets with growth potential and develop corresponding market entry or expansion plans.
🗒️ Note: When analyzing data in the entire "Est. Revenue" section, don't forget to filter by the time dimension you wish to observe at the top of the "Global Revenue" section.
Once filtered, the entire "Est. Revenue" section, including "Global Revenue" and "Comparison by Country/Region," will reflect the selected time dimension.
- The first method allows you to view the global overview. Here's how it works:
When you first open the page, you'll see different colors on the left side representing various data. The map on the right corresponds to these colors, representing different data points.
The deeper the shade of blue, the higher the revenue; conversely, lighter shades indicate less revenue, with red representing the lowest revenue.
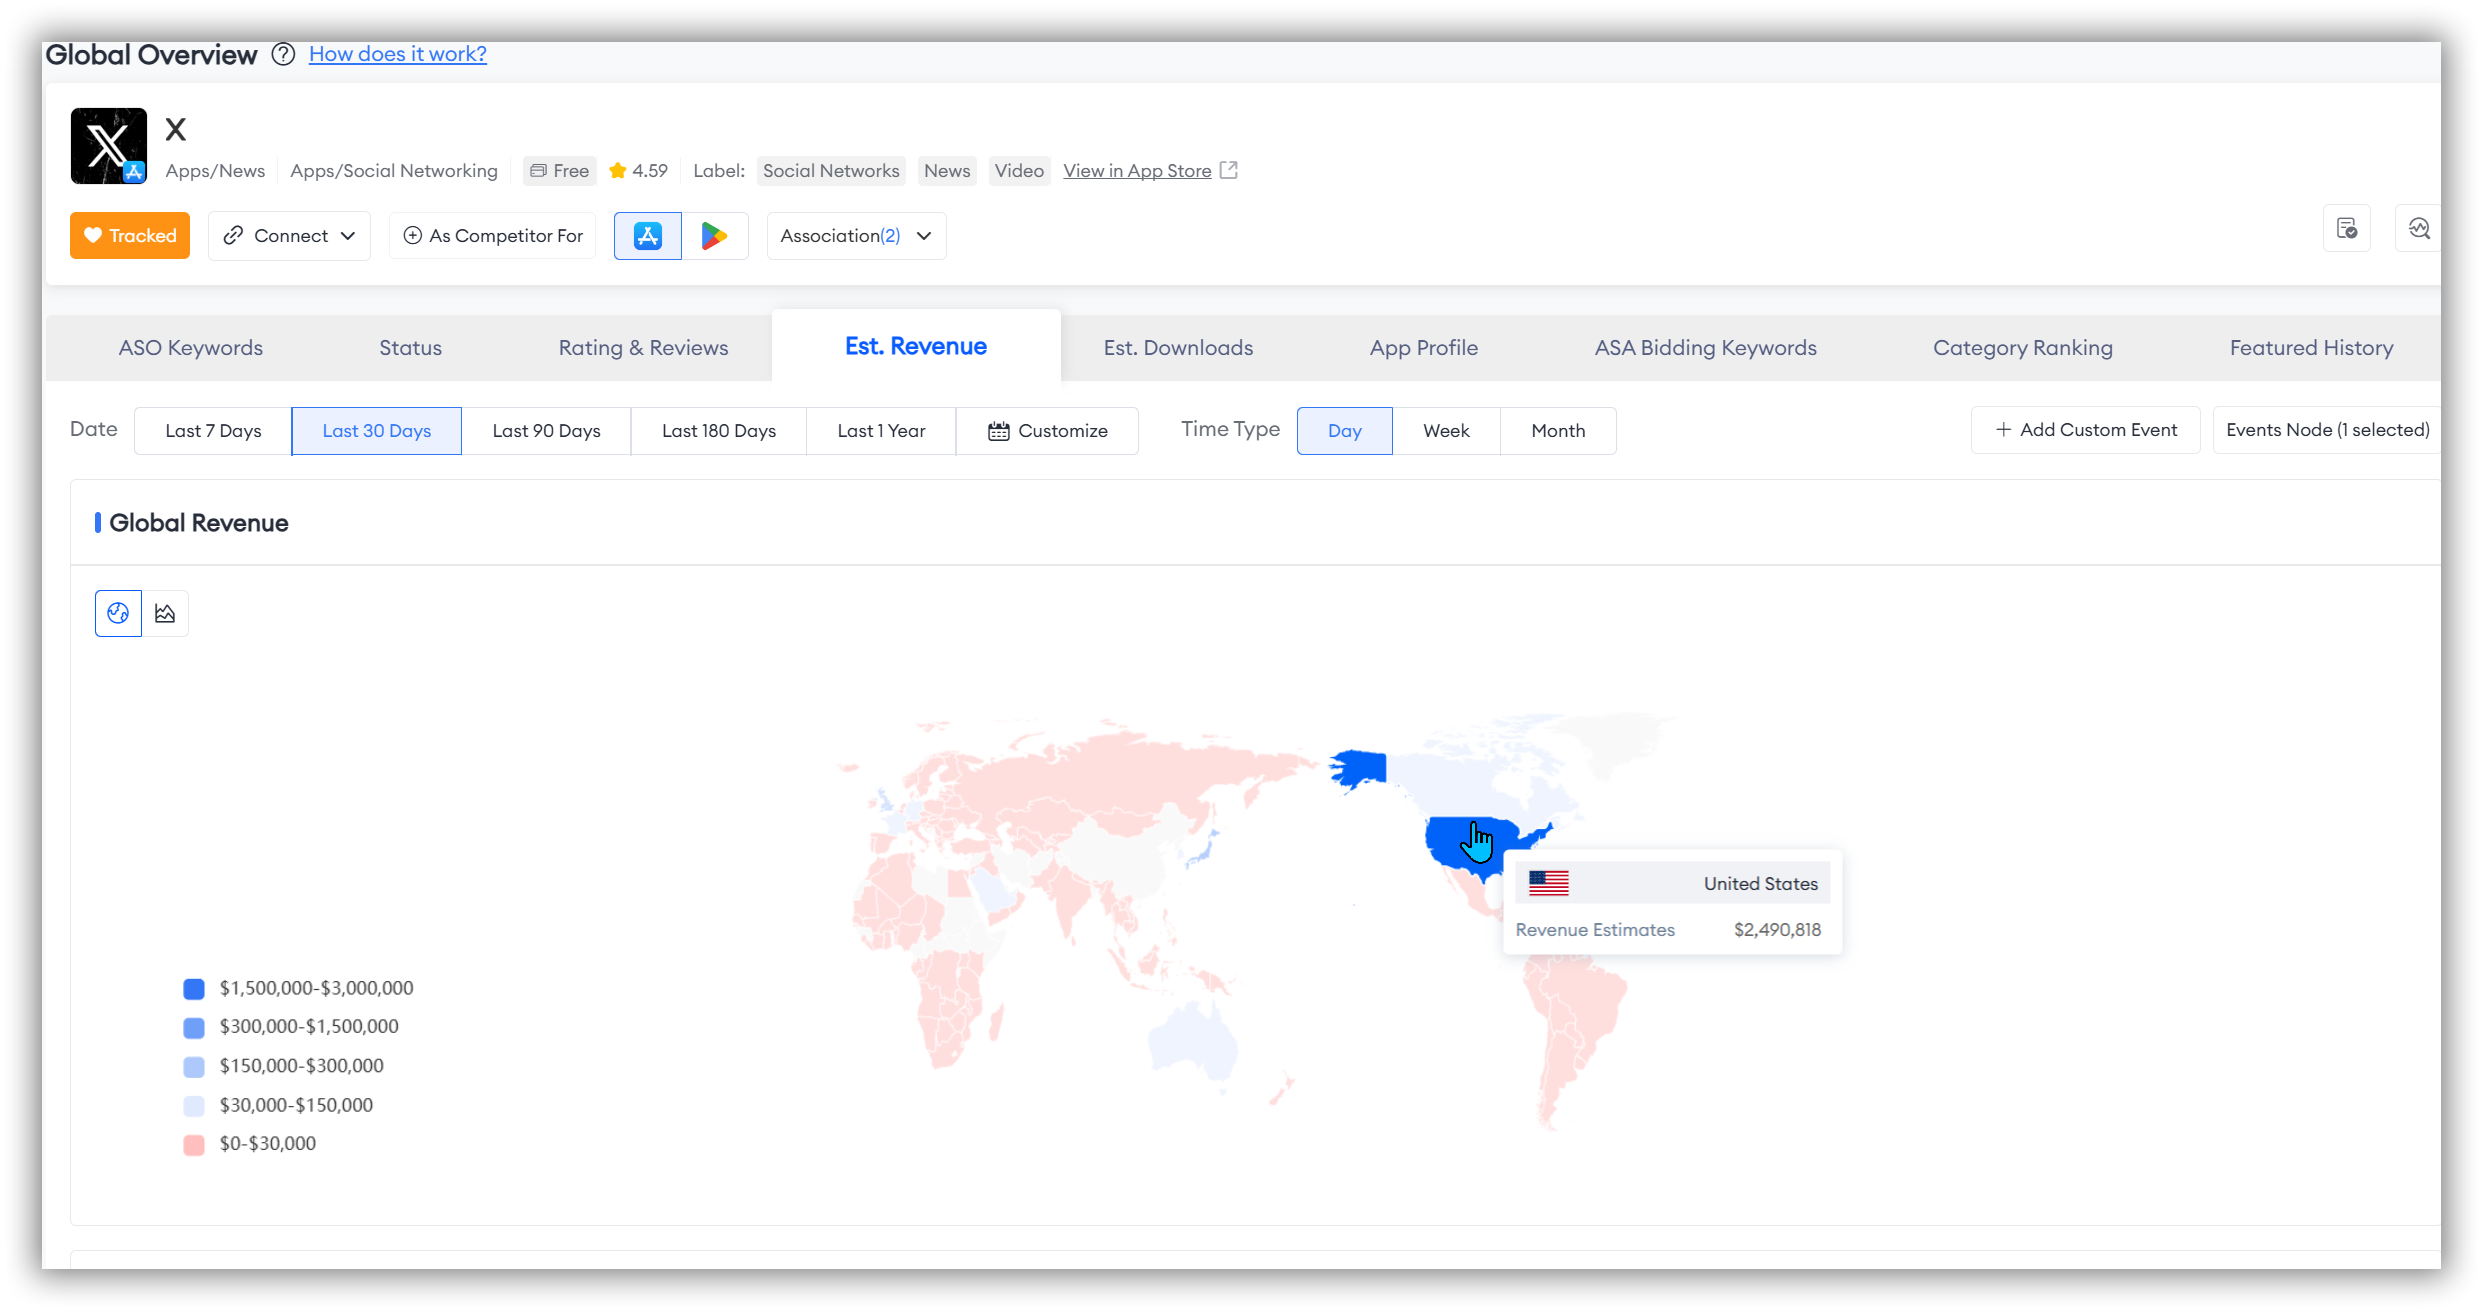
- The second method allows you to conduct a more precise and personalized study of the regions you are interested in. Here's how it works:
Simply hover your mouse over the ranking data axis on the left or the map on the right.
Global Revenue Trends
If you want to study the historical global revenue trends of the apps you are tracking, simply click on the line chart icon in the top left corner. This will allow you to analyze the trend changes within the time dimension you have selected.
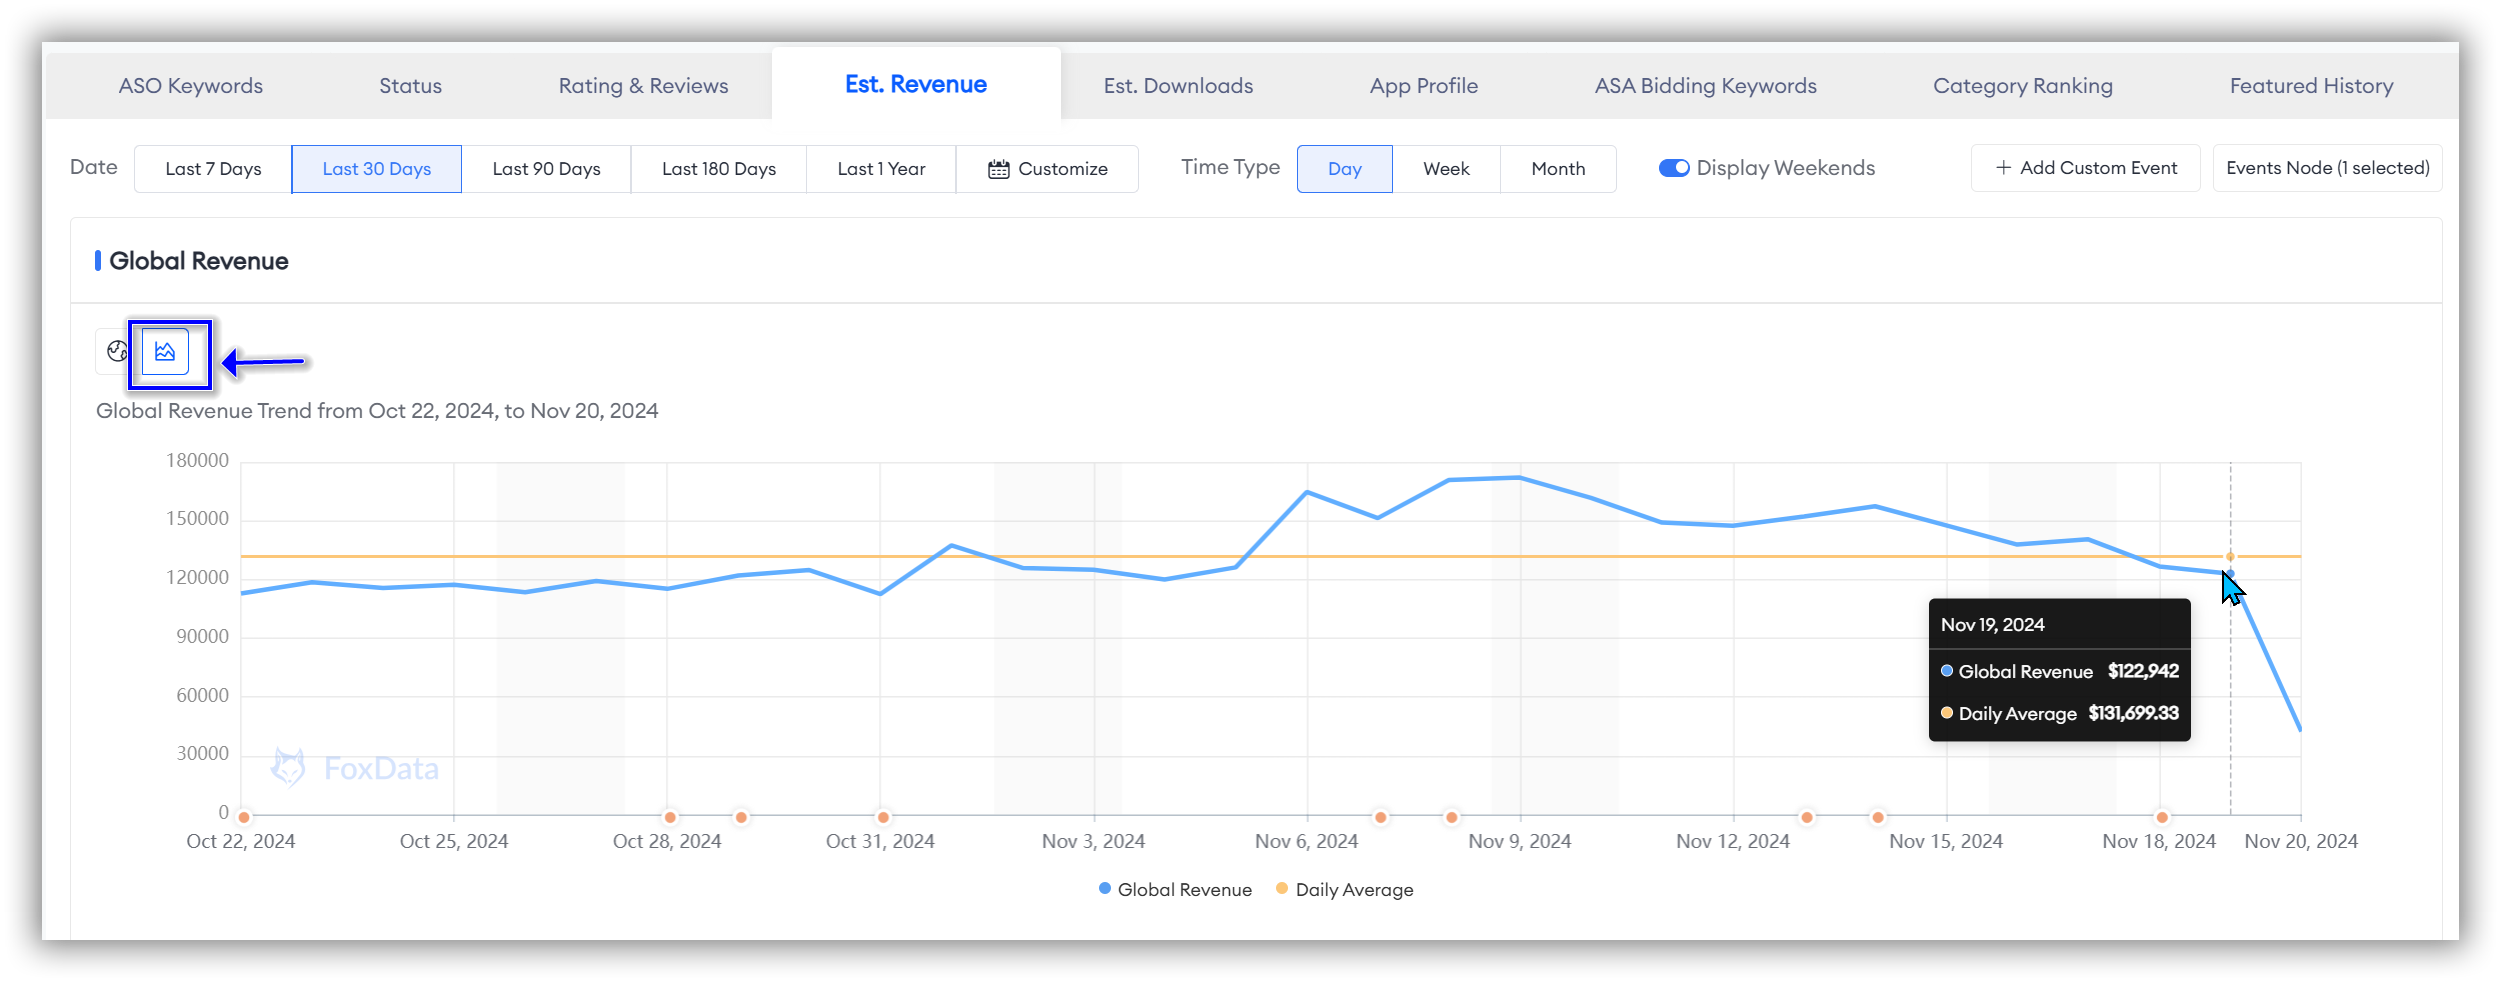
The data is presented with two line graphs: "Global Revenue" and "Daily Average/Weekly Average/Monthly Average."
By comparing these two lines, you can quickly identify time points where the app you are tracking shows abnormal performance. This allows you to analyze in-app or external marketing activities for those specific time points and implement more effective strategies to optimize app performance and revenue.
👏Expert Tips: FoxData offers another feature called "ASO Impact Analysis," which automates change detection, evaluates the impacts of ASO updates, and identifies changes in competitor strategies, thereby enhancing app performance management and optimization efficiently for researchers.
Once you have identified the anomalous time points, you can use the "Event Timeline" feature in "ASO Impact Analysis" to quickly pinpoint events that affected revenue during that period.
💡 Read More: How "ASO Impact Analysis" Helps Monitor Your Competitors and Evaluate Your App's Every Update
Comparison by Country/Region
"Comparison by Country/Region" allows you to view the estimated revenue of the app you track by country or region. By comparing the estimated revenue across different countries or regions, you can assess the app's performance in each market, helping you identify strong markets and areas that need improvement.
The "Comparison by Country/Region" is presented as a trend line chart. This trend chart clearly shows the revenue growth or decline trends in different markets, aiding you in identifying regions that are rapidly growing and seizing market opportunities.
Additionally, by comparing revenue trends in different regions, you can monitor competitors' market activities and strategies, allowing you to adjust your own competitive strategy accordingly.

🗒️ Note: In this section, FoxData defaults the time dimension to 30 days. If you want to study a longer or specific time dimension, don't forget to directly filter the time period you wish to observe at the top of the "Global Revenue" section.
You can select up to ten countries of interest for comparison.
In addition to the line trend chart, there is a detailed table at the bottom of the page displaying the estimated revenue for each country. This table includes columns for "Country/Region," "Est. Revenue," "Average," and "Ratio," providing a more detailed and valuable analytical perspective.
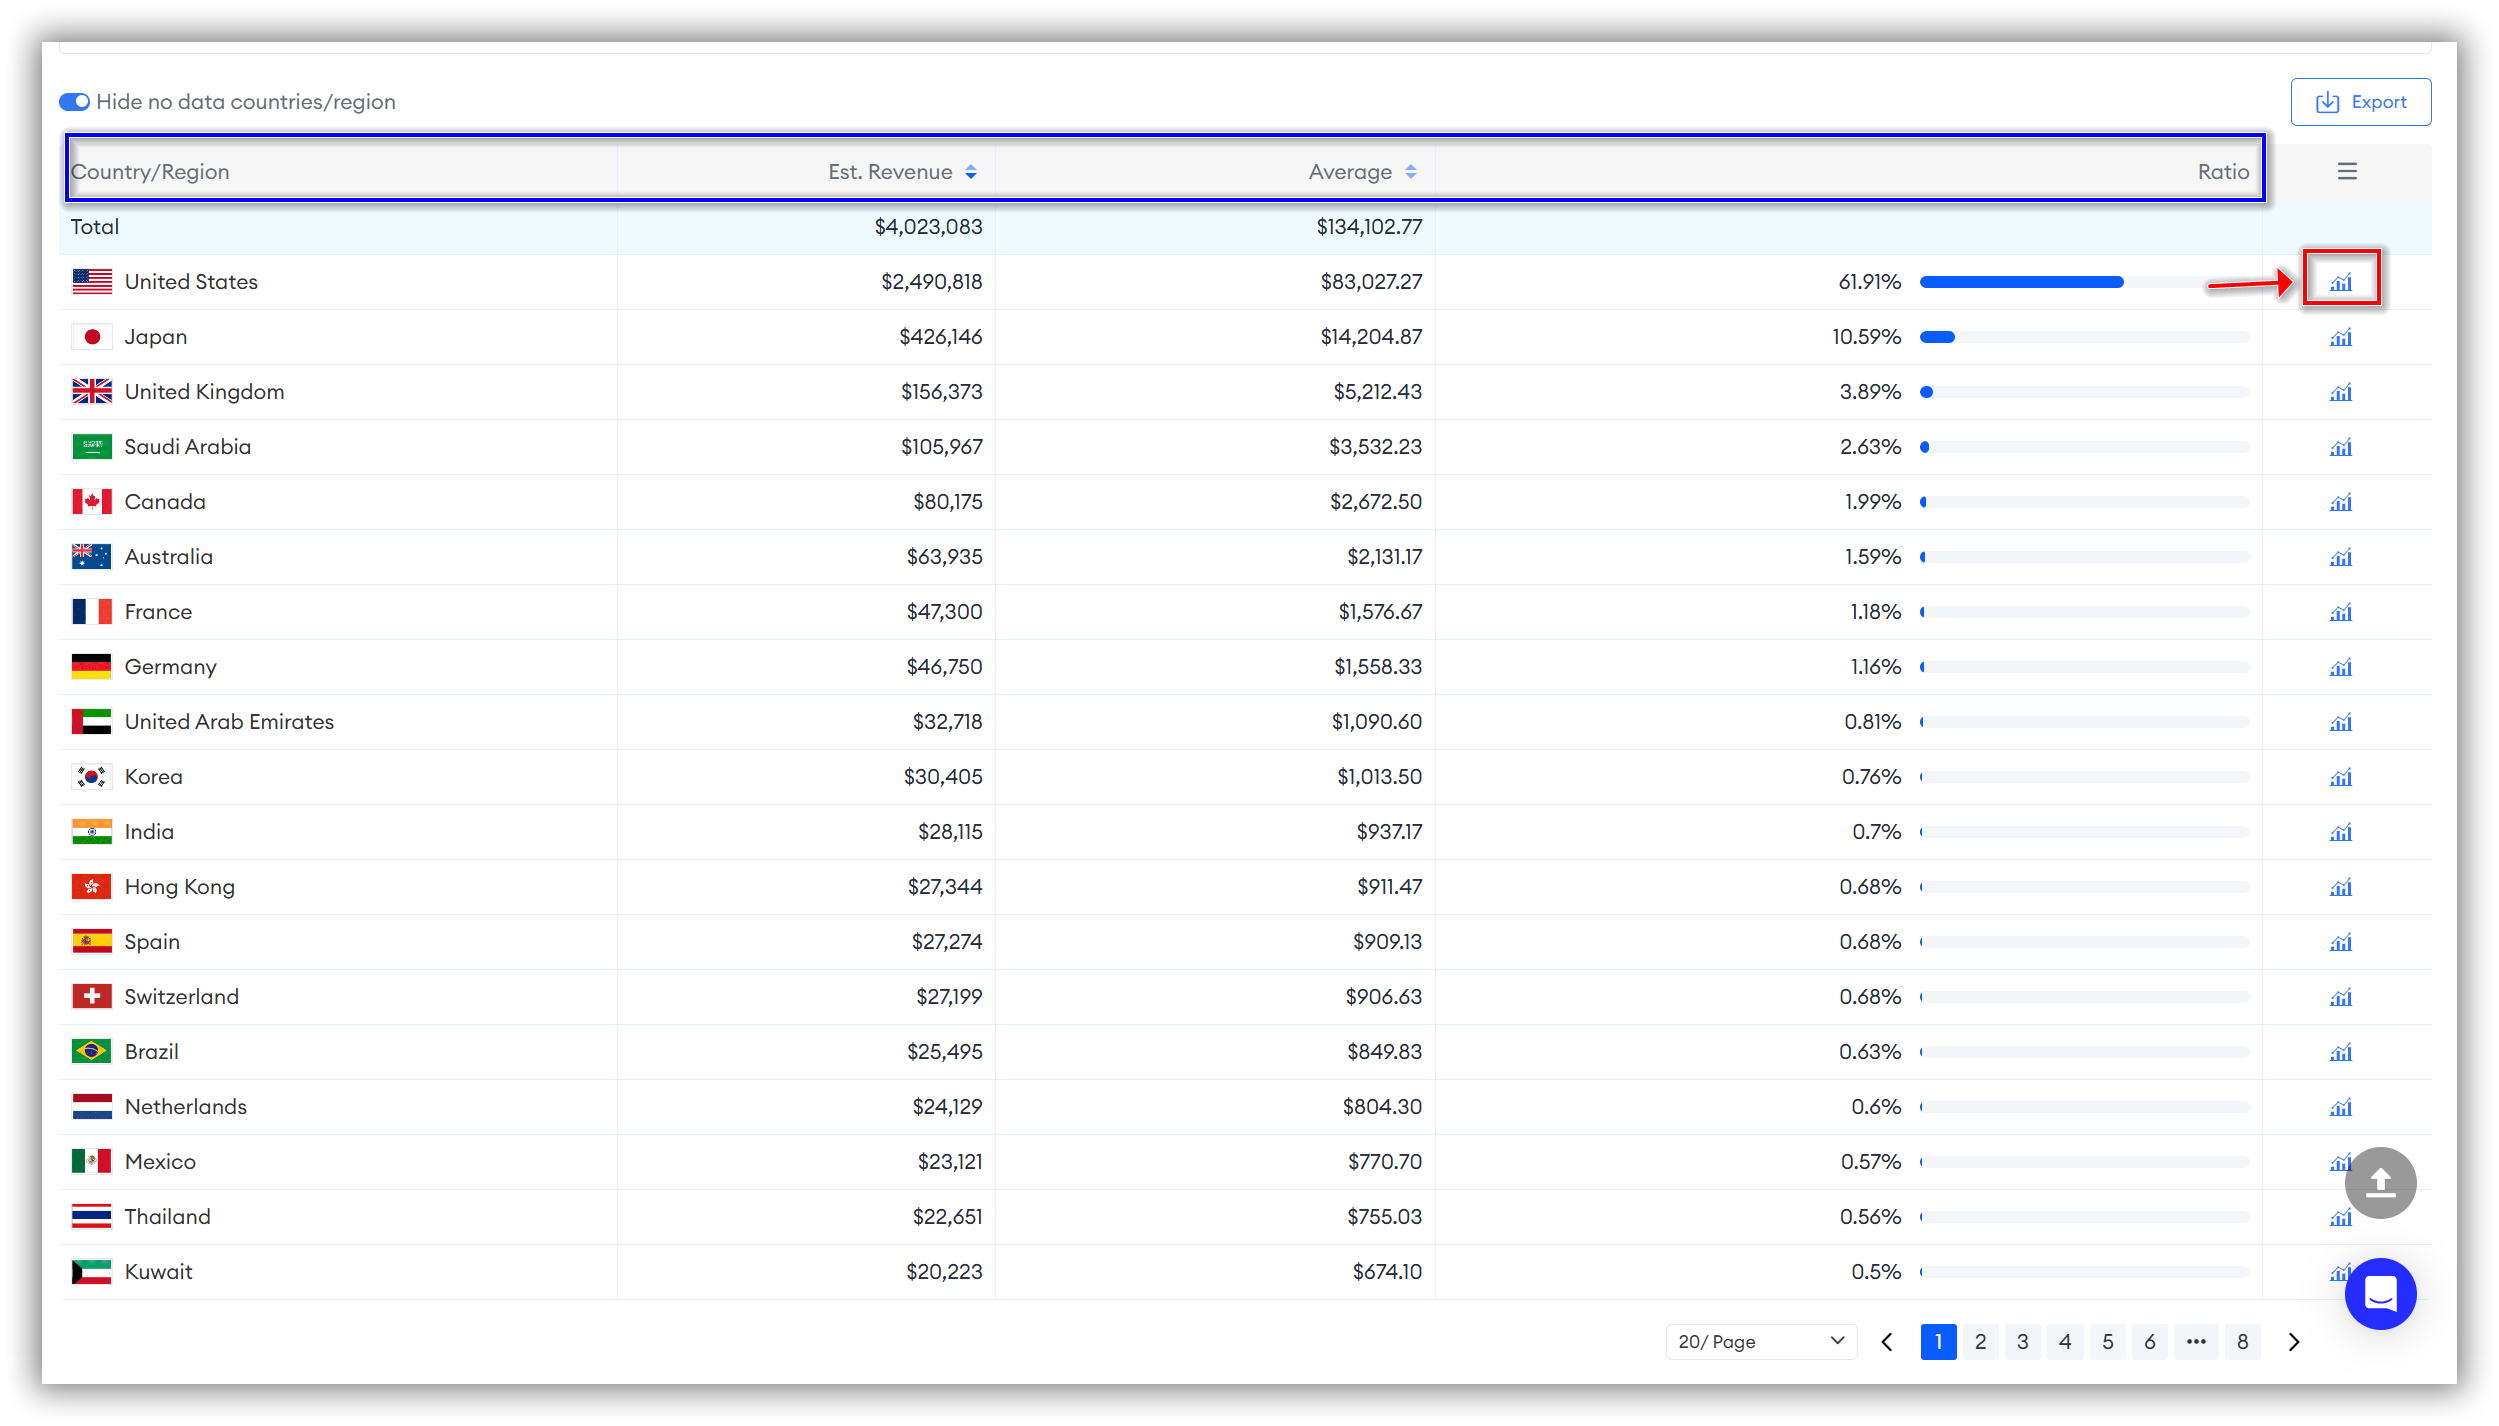
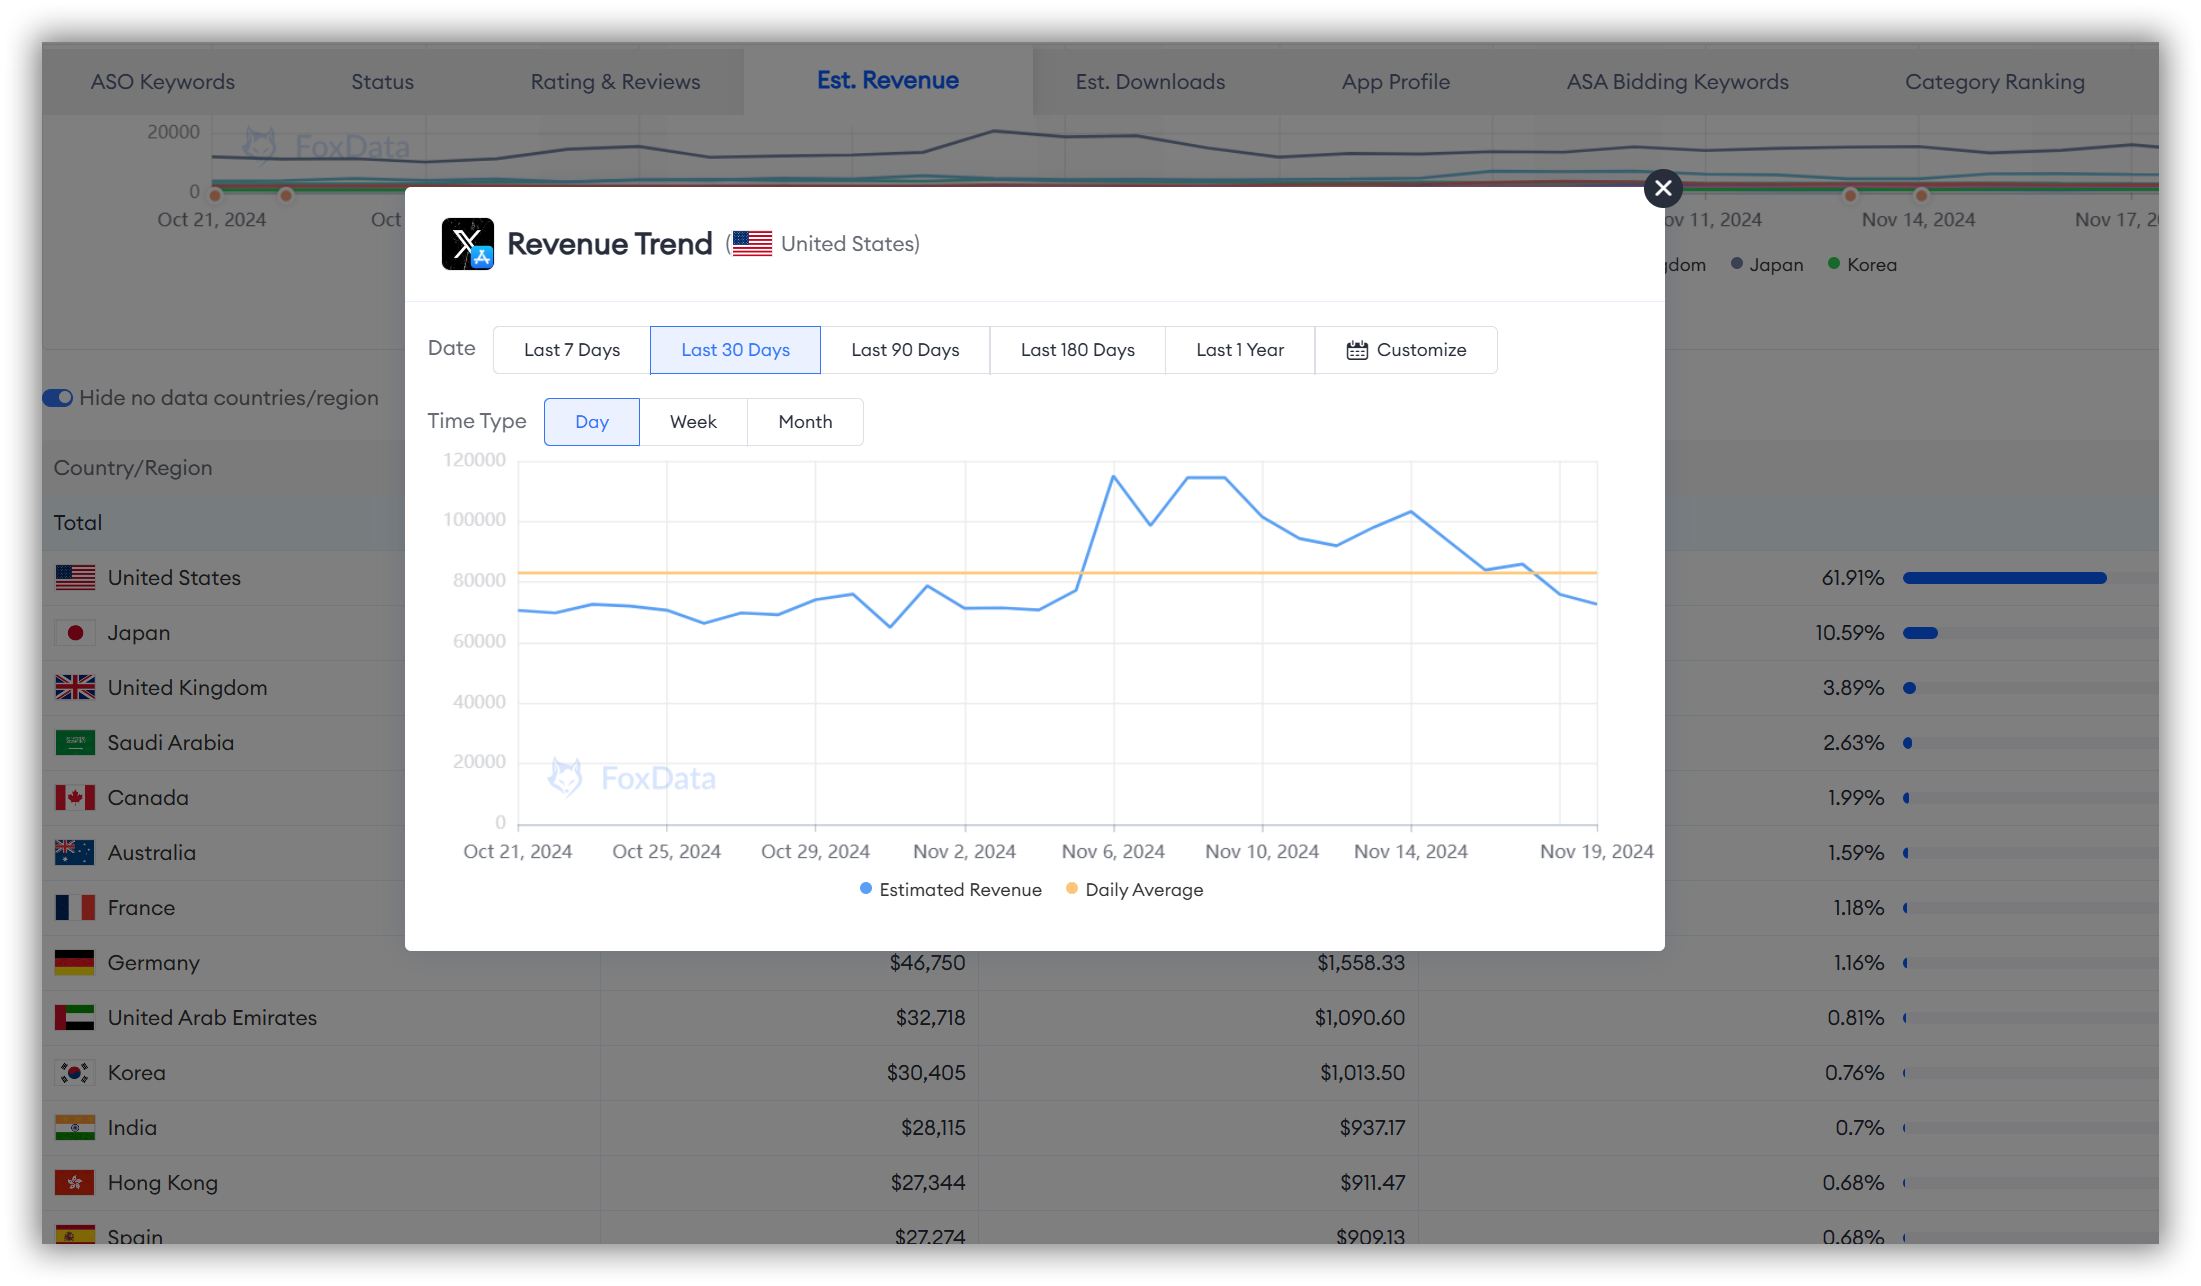
If you are interested in the data for a specific country, you can click the bar chart icon next to the "Ratio" for that country to access its Revenue Trend data.
5. Est. Downloads
Global Downloads Overview"Global Downloads" allows you to view a global overview of the estimated downloads for the app you are tracking.
Downloads are a crucial metric for measuring an app's popularity. Understanding the download volume across different global markets helps assess market penetration.
🗒️ Note: When analyzing the data in the entire "Est. Downloads" section, don't forget to directly filter the time dimension you wish to observe at the top of the "Global Revenue" section.
Once filtered, both the "Global Downloads" and "Comparison by Country/Region" sections will reflect the time dimension you have selected.
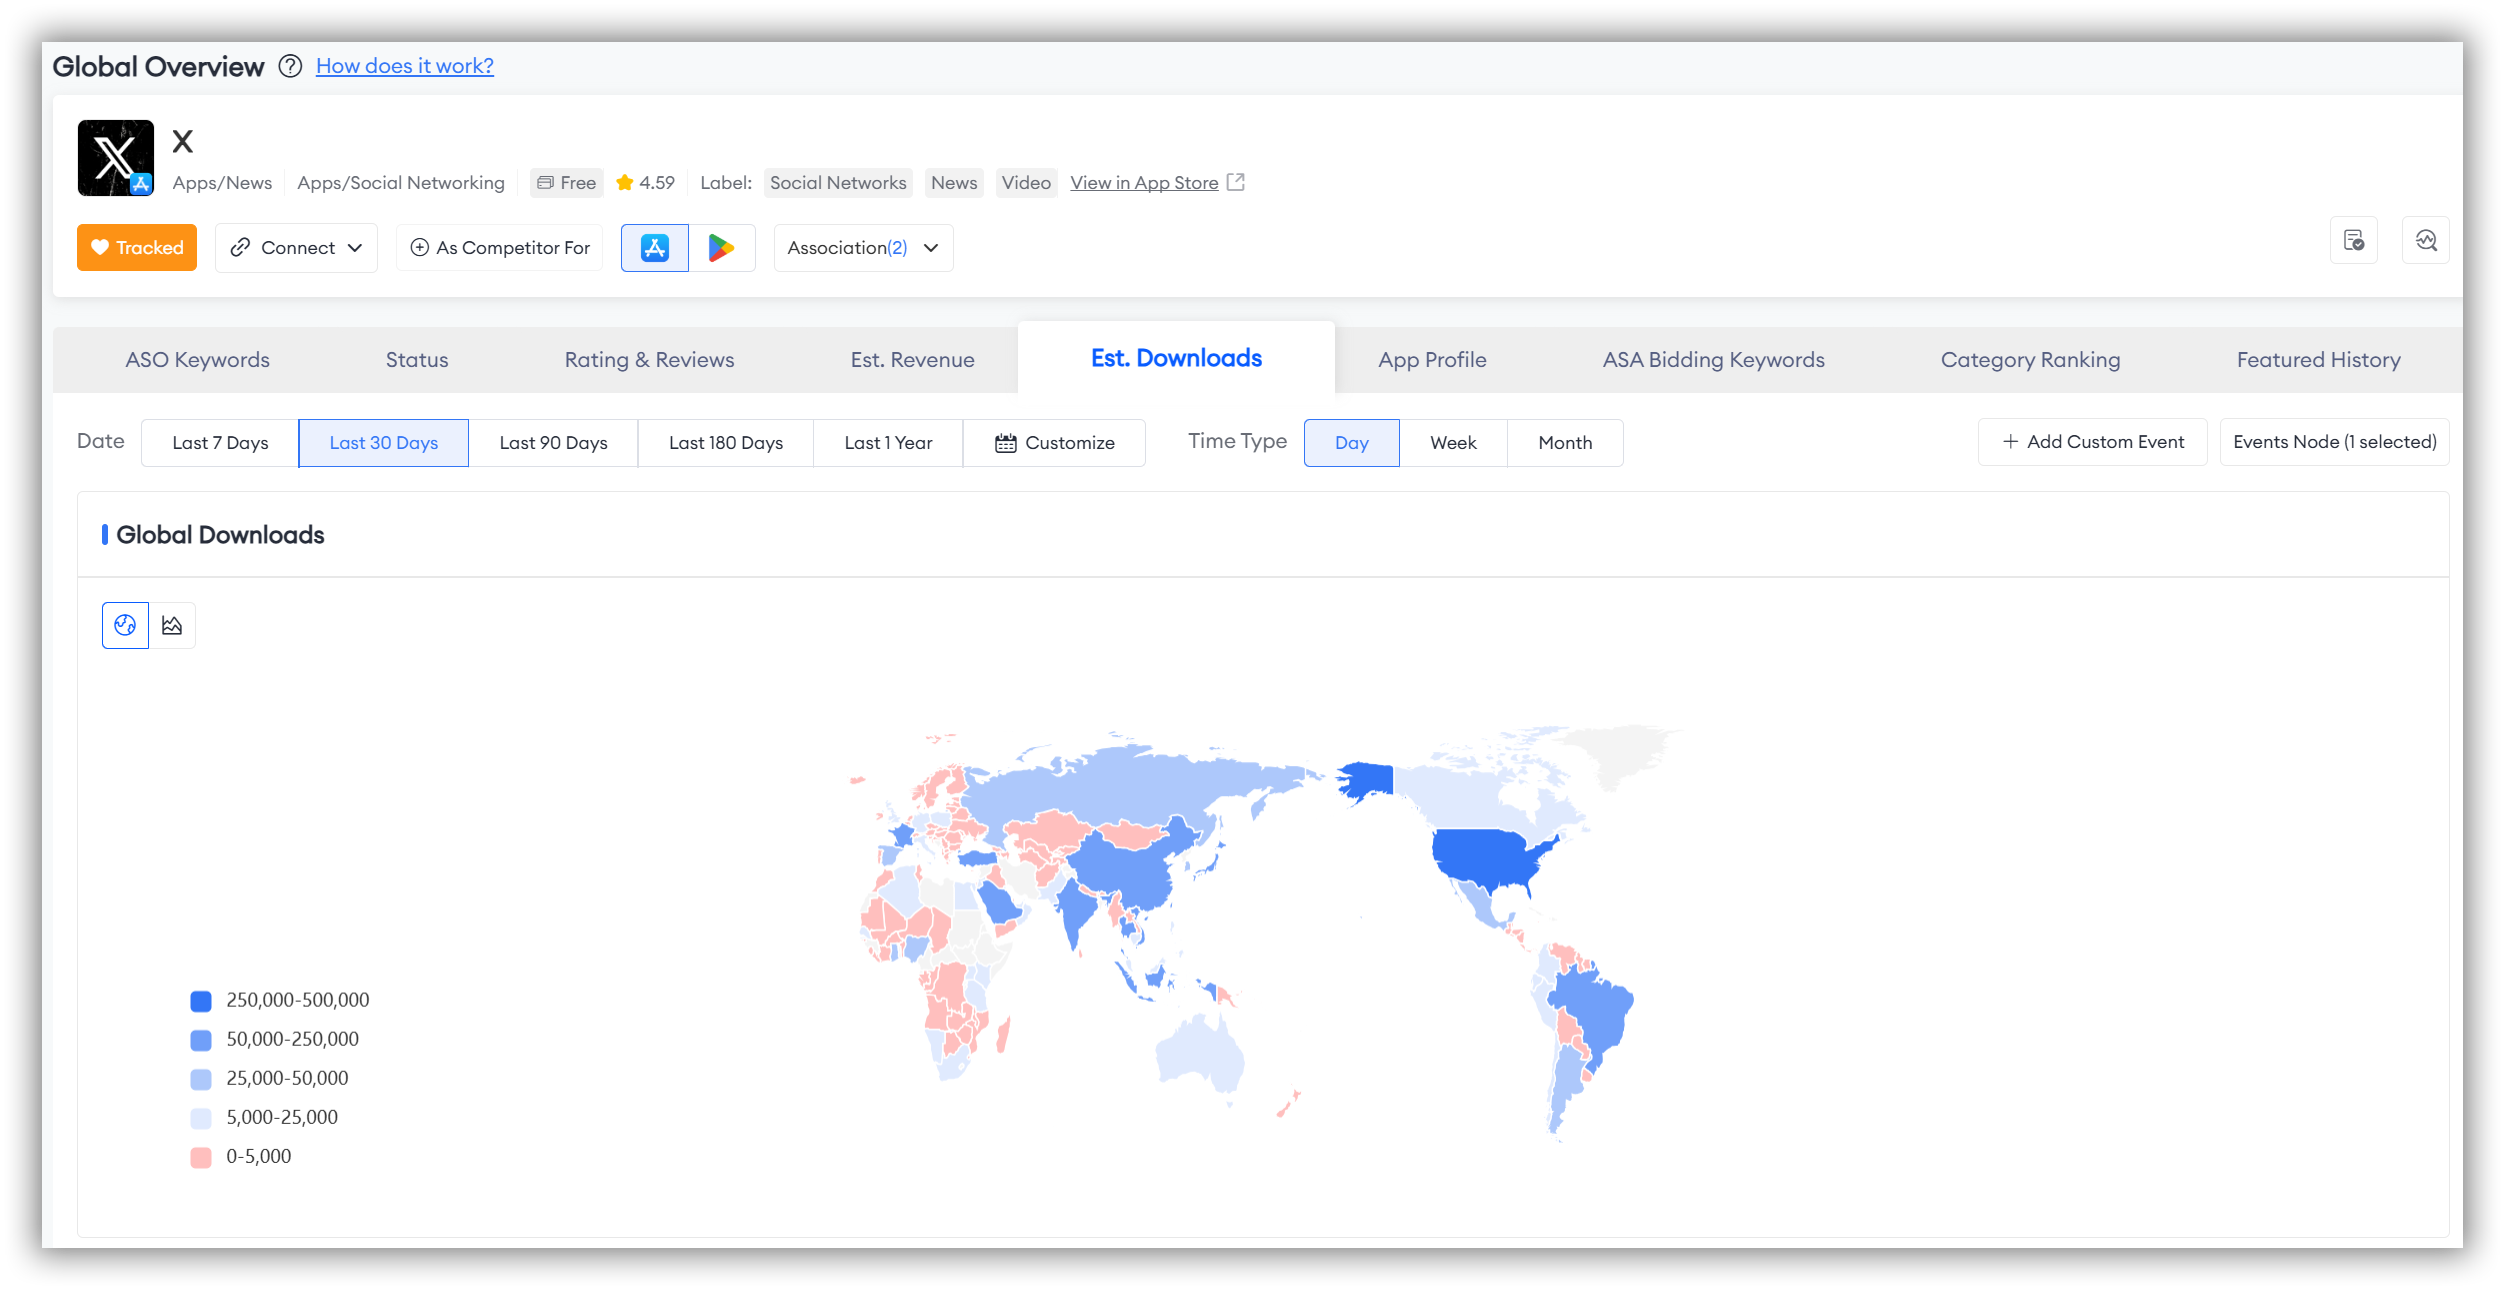
- The first method allows you to view the global overview. Here's how it works:
When you first open the page, you'll see different colors on the left side representing various data. The map on the right corresponds to these colors, representing different data points.
The deeper the shade of blue, the higher the downloads; conversely, lighter shades indicate fewer downloads, with red representing the lowest downloads.
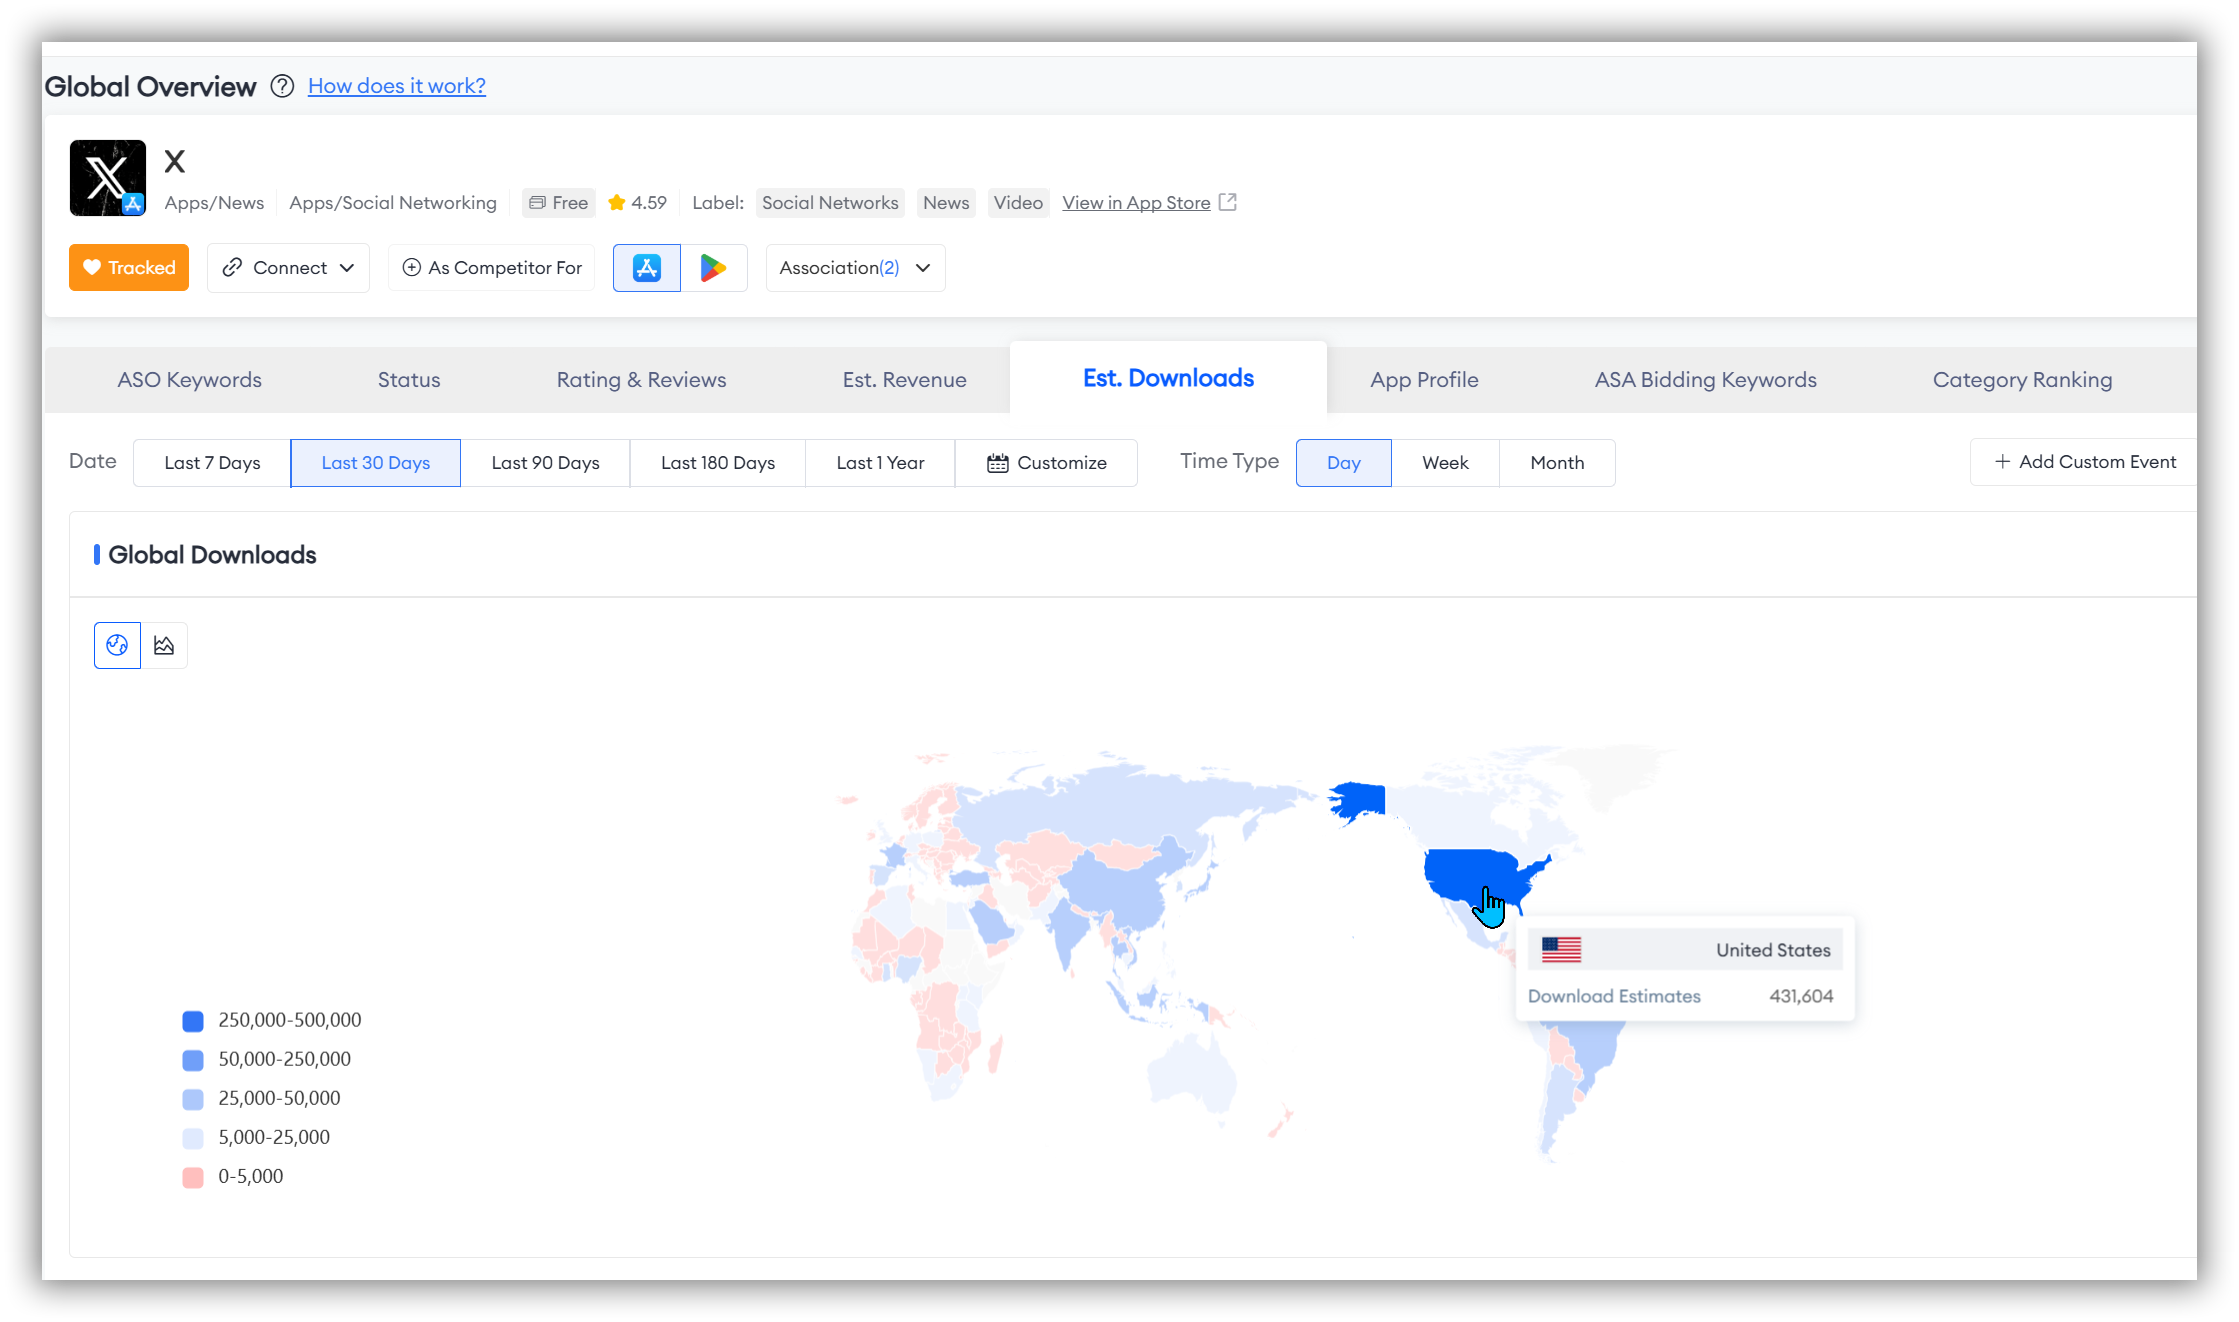
- The second method allows you to conduct a more precise and personalized study of the regions you are interested in. Here's how it works:
Simply hover your mouse over the ranking data axis on the left or the map on the right.
Global Downloads Trends
If you want to study the historical global download trends of the app you are tracking, click the line chart icon in the upper left corner. This will allow you to analyze the trend changes within the time dimension you have selected.
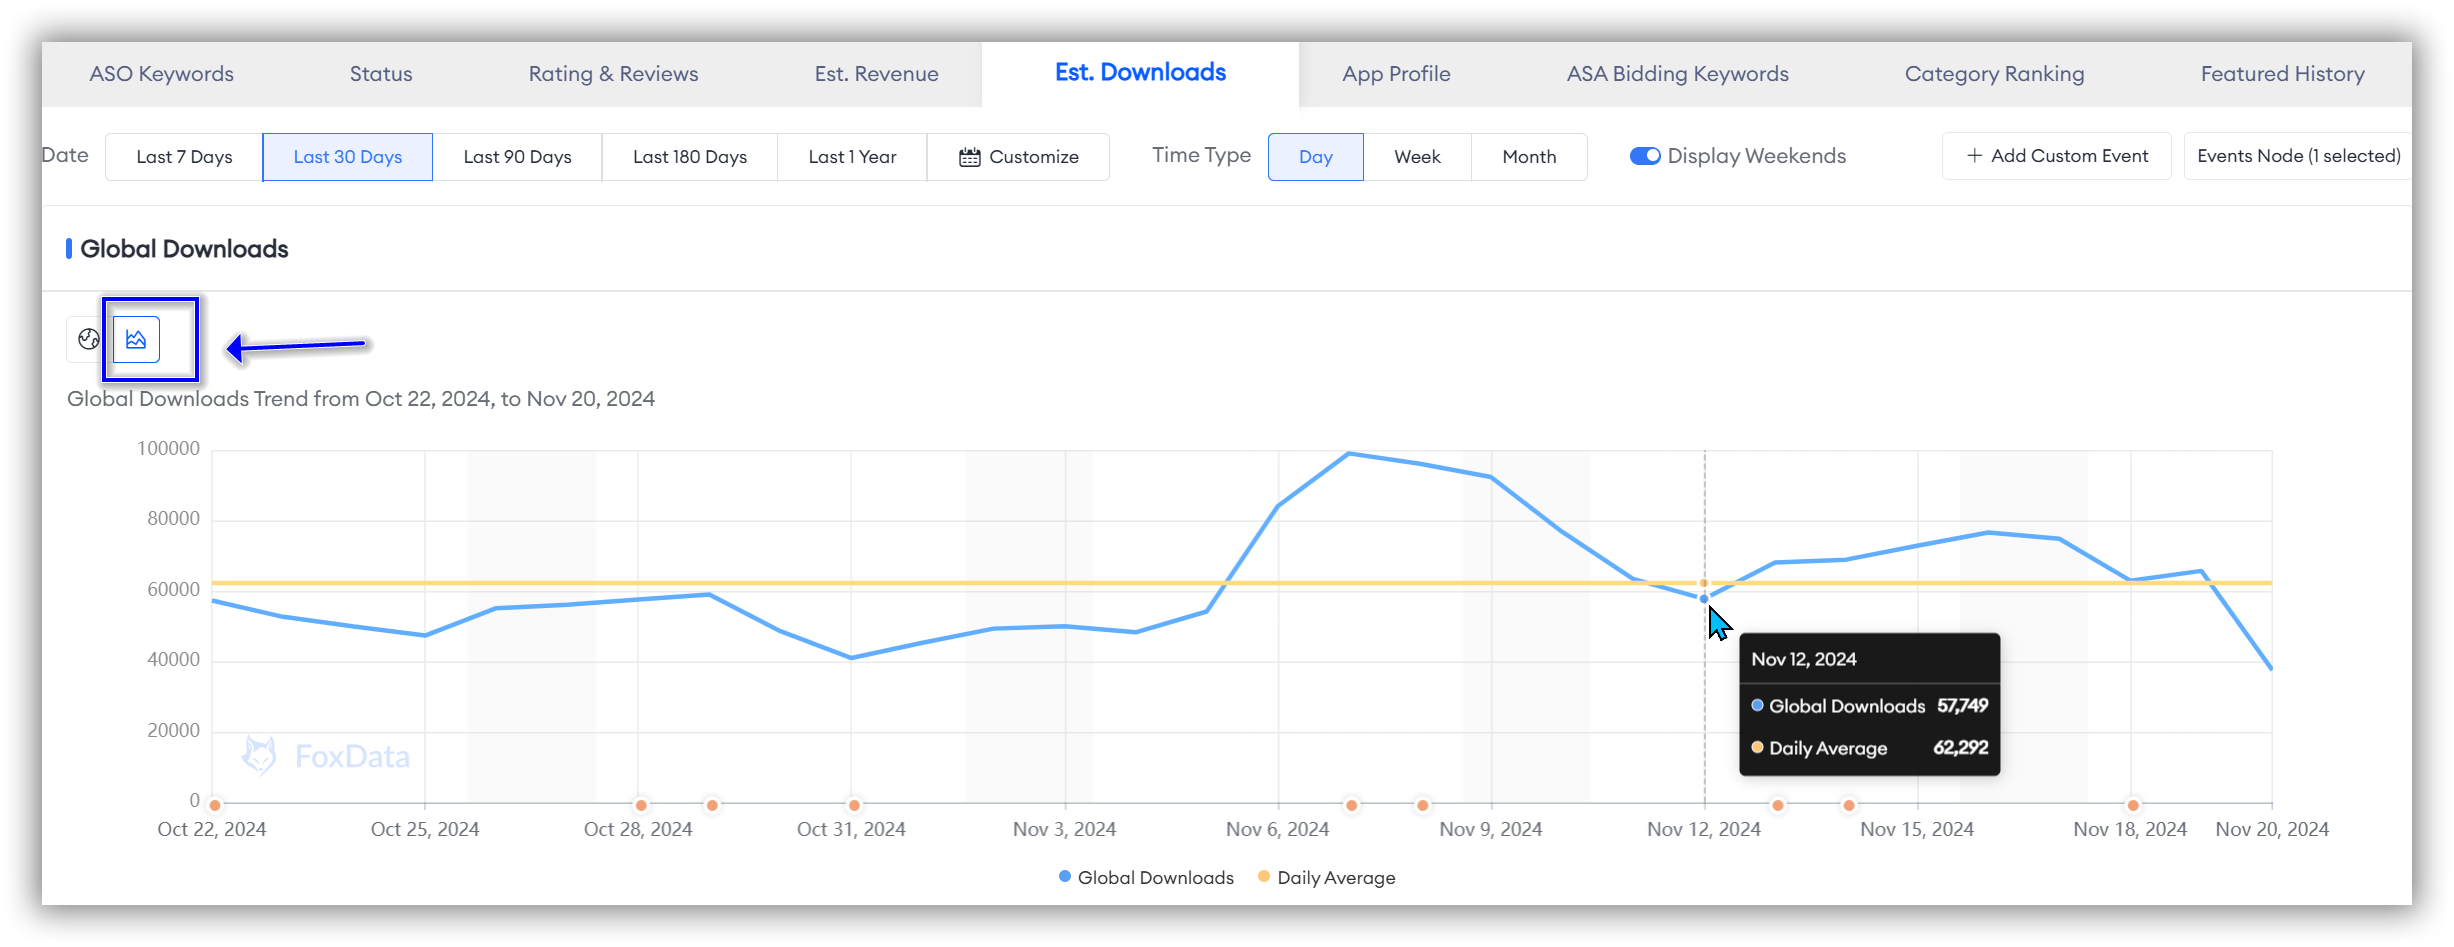
The data is presented with two line charts: "Global Downloads" and "Daily Average/Weekly Average/Monthly Average." By comparing these two lines, you can quickly identify time points where the app you track shows abnormal performance. This helps in analyzing in-app or external marketing activities during specific time periods, allowing you to implement more effective strategies to optimize user acquisition.
👏 Expert Tips: FoxData's "ASO Impact Analysis," feature automates change detection, evaluates the impacts of ASO updates, and identifies competitor strategy changes, enhancing app performance management and optimization efficiently for researchers.
After identifying abnormal time points, you can use the "Event Timeline" in the "ASO Impact Analysis" to quickly pinpoint events affecting downloads during that period.
💡 Read More: How "ASO Impact Analysis" Helps Monitor Your Competitors and Evaluate Your App's Every Update
Comparison by Country/Region
"Comparison by Country/Region" allows you to view the estimated downloads of the app you track, broken down by country or region.
By comparing the estimated download volumes across different countries or regions, you can identify markets with high penetration and potential growth opportunities, helping you optimize market entry and expansion strategies.

🗒️ Note: In this section, FoxData defaults the time dimension to 30 days. If you want to study a longer or specific time dimension, don't forget to directly select the desired time frame at the top of the "Global Downloads" section.
You can choose up to ten countries of interest for comparison.
In addition to the line trend chart, there is a detailed table at the bottom of the page showing the Estimated Downloads for each country, including "Country/Region," "Est. Downloads," "Average," and "Ratio." This provides a more detailed and valuable perspective for analysis.
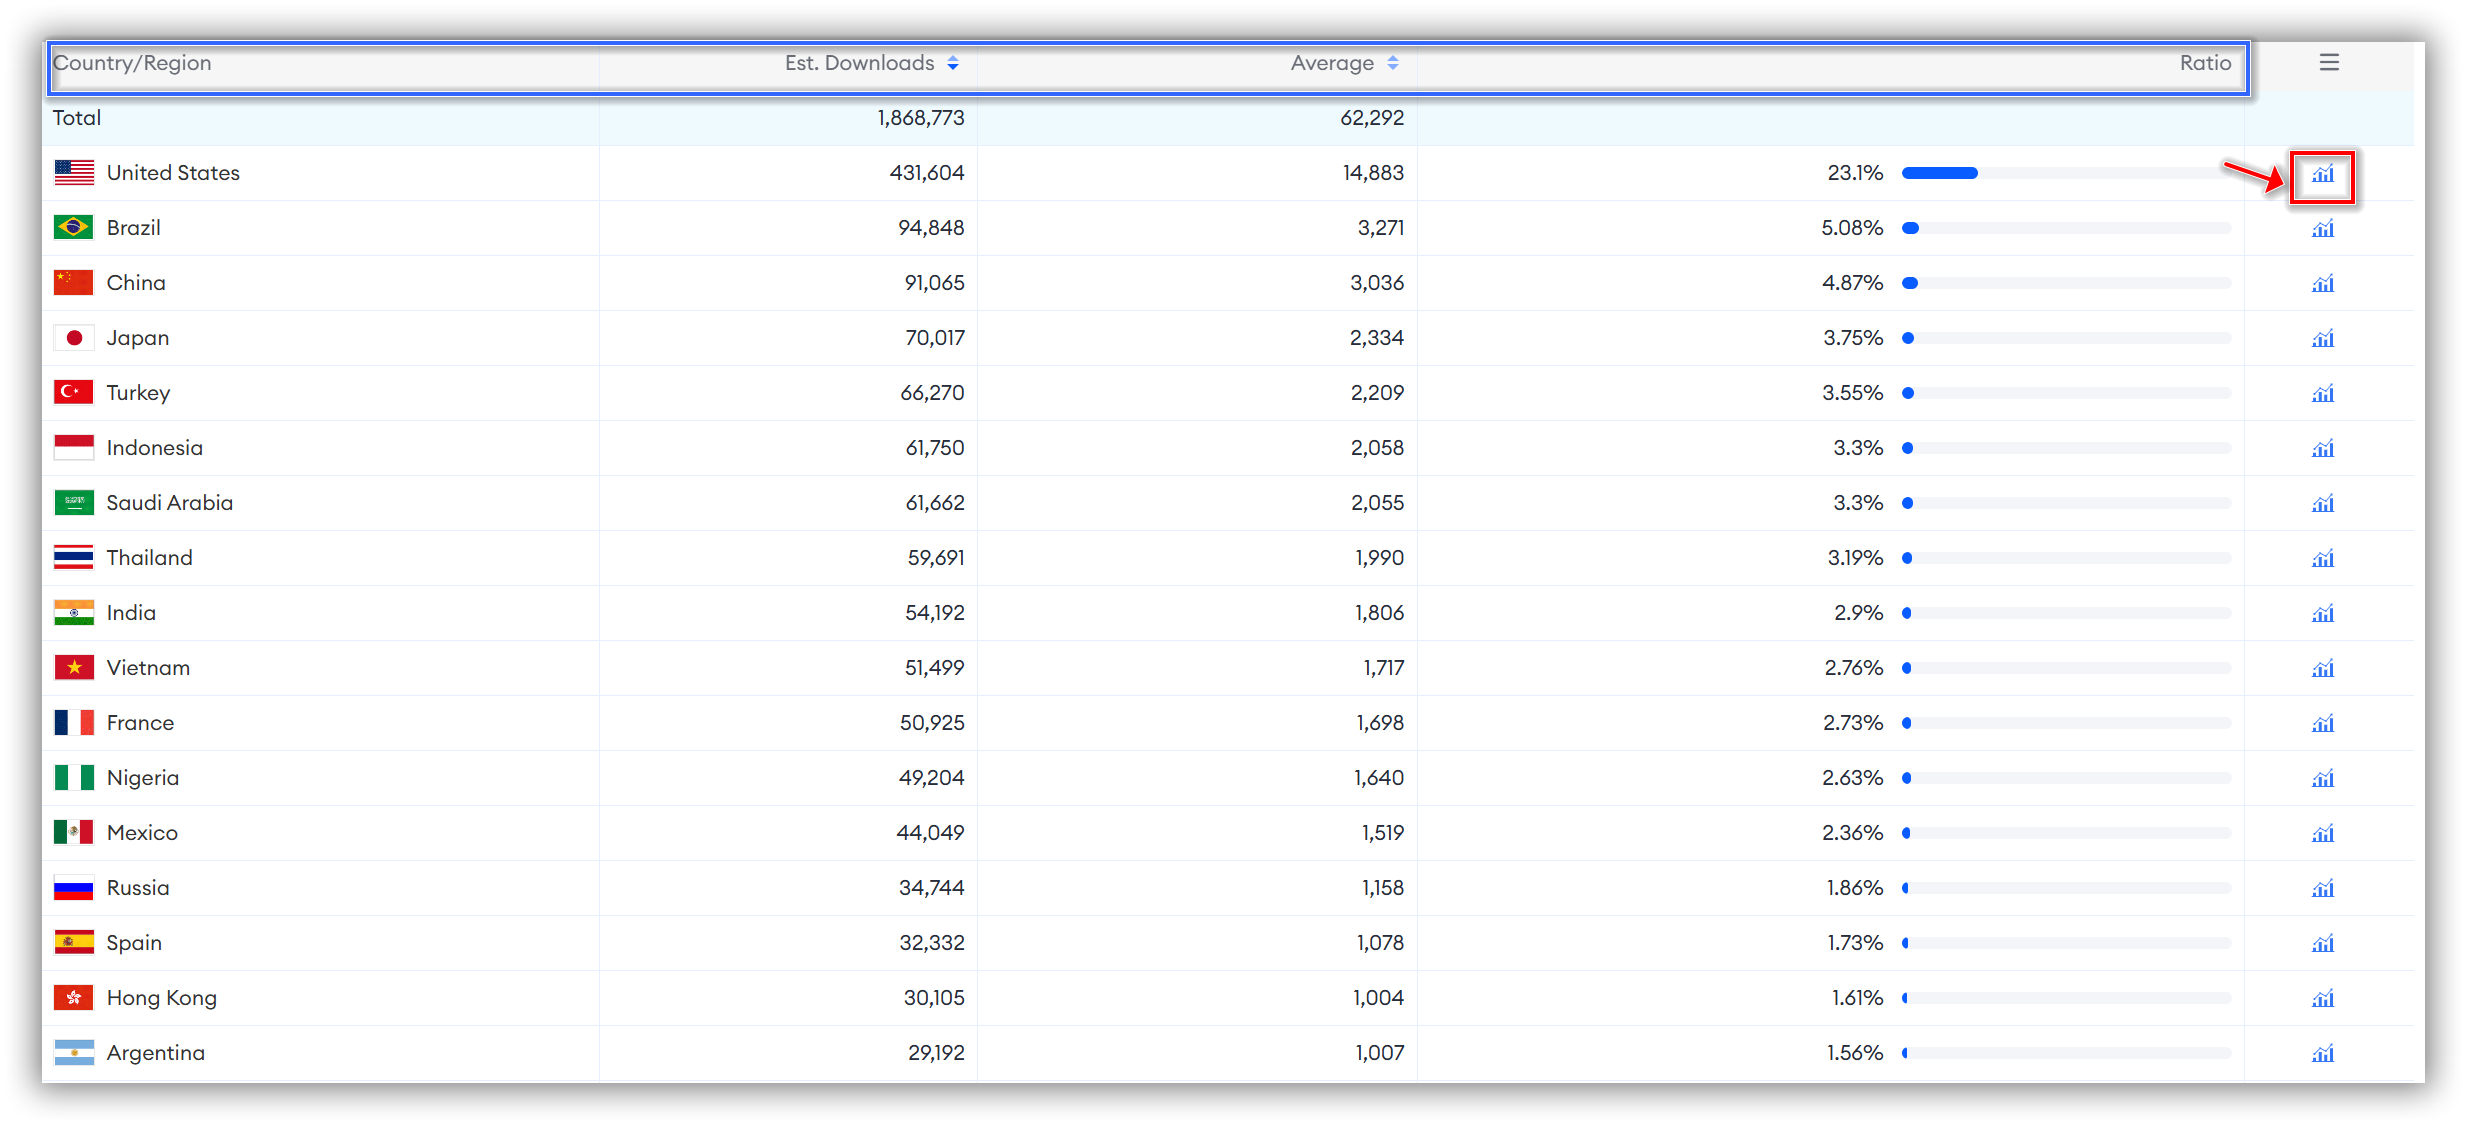
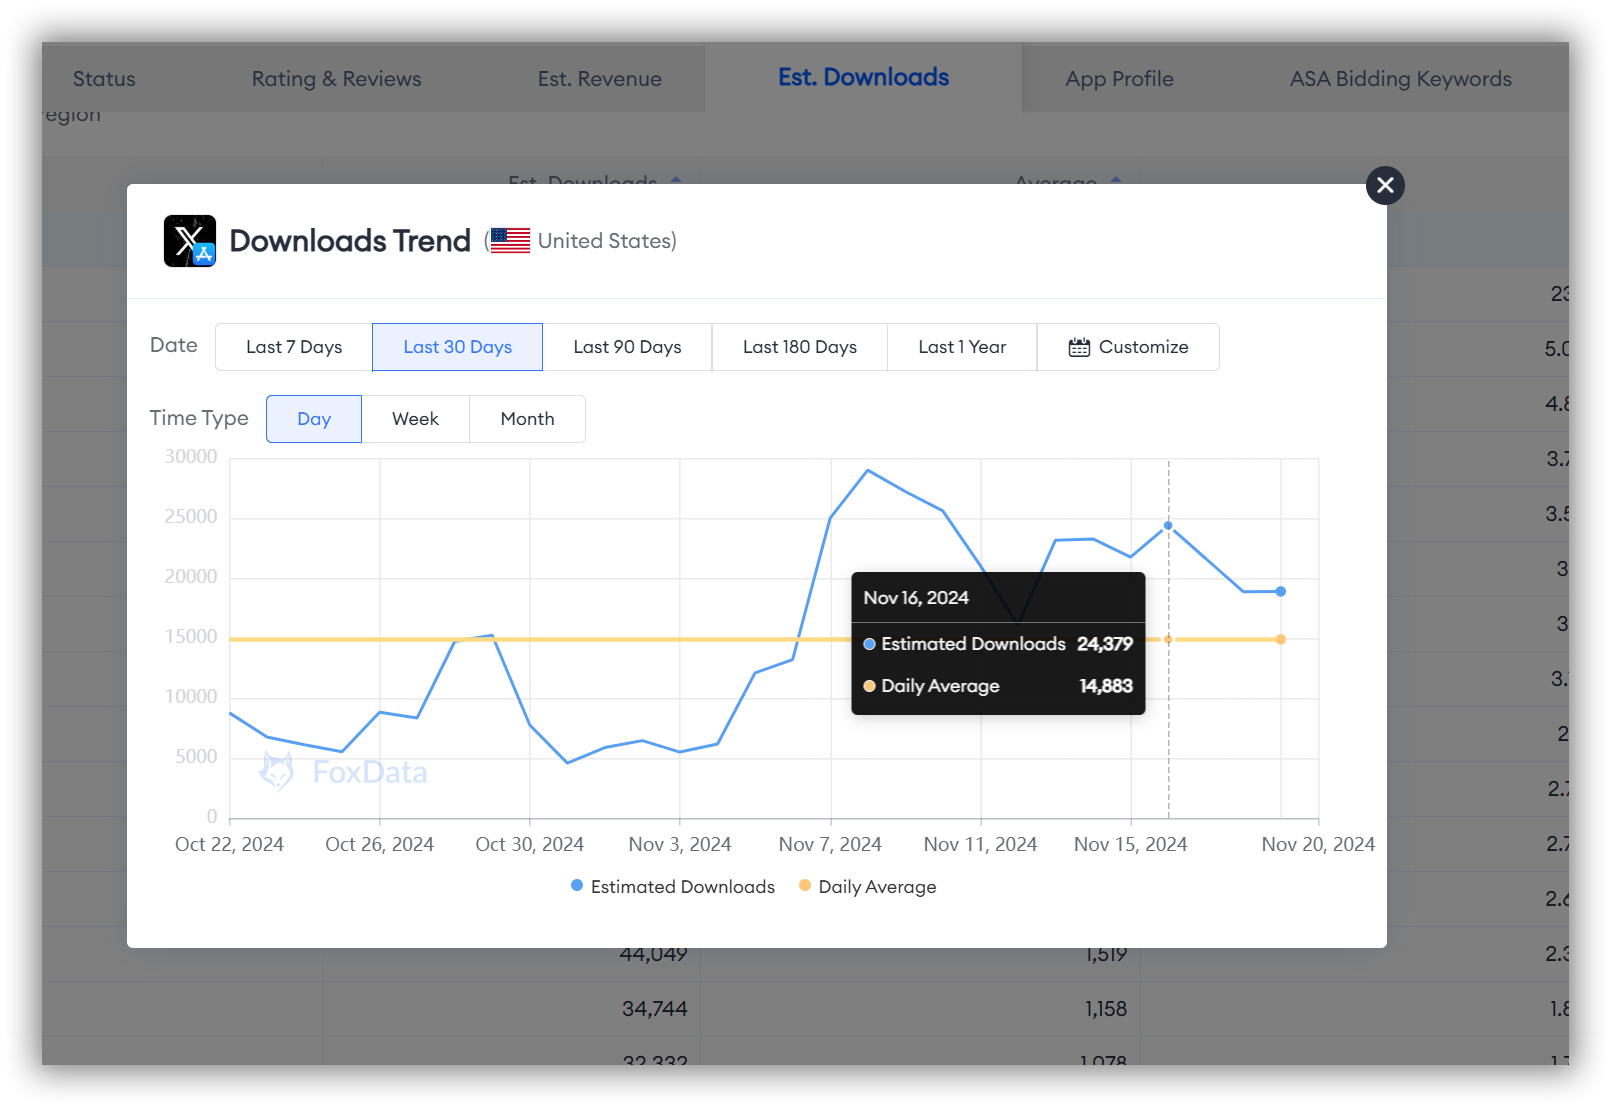
If you're interested in the data for a specific country, you can click the bar chart icon next to the "Ratio" for that country to access the Downloads Trend data.
6. App Profile
App Profile Global Overview
"App Profile" allows you to view global information such as "Version," "Country/Region" (number of countries covered by the version), "Screenshots" (the count of videos in screenshots), and app description localization (the number of countries where the app description is localized).、
This feature helps you better analyze the app's market performance and internationalization strategy, enabling more effective product management and marketing decisions.
🗒️ Note: In the global market, app version updates are typically kept consistent to ensure all users have access to the latest features and security patches.
Therefore, in the "App Profile" section, most apps will display only their latest global version.

App Profile Details
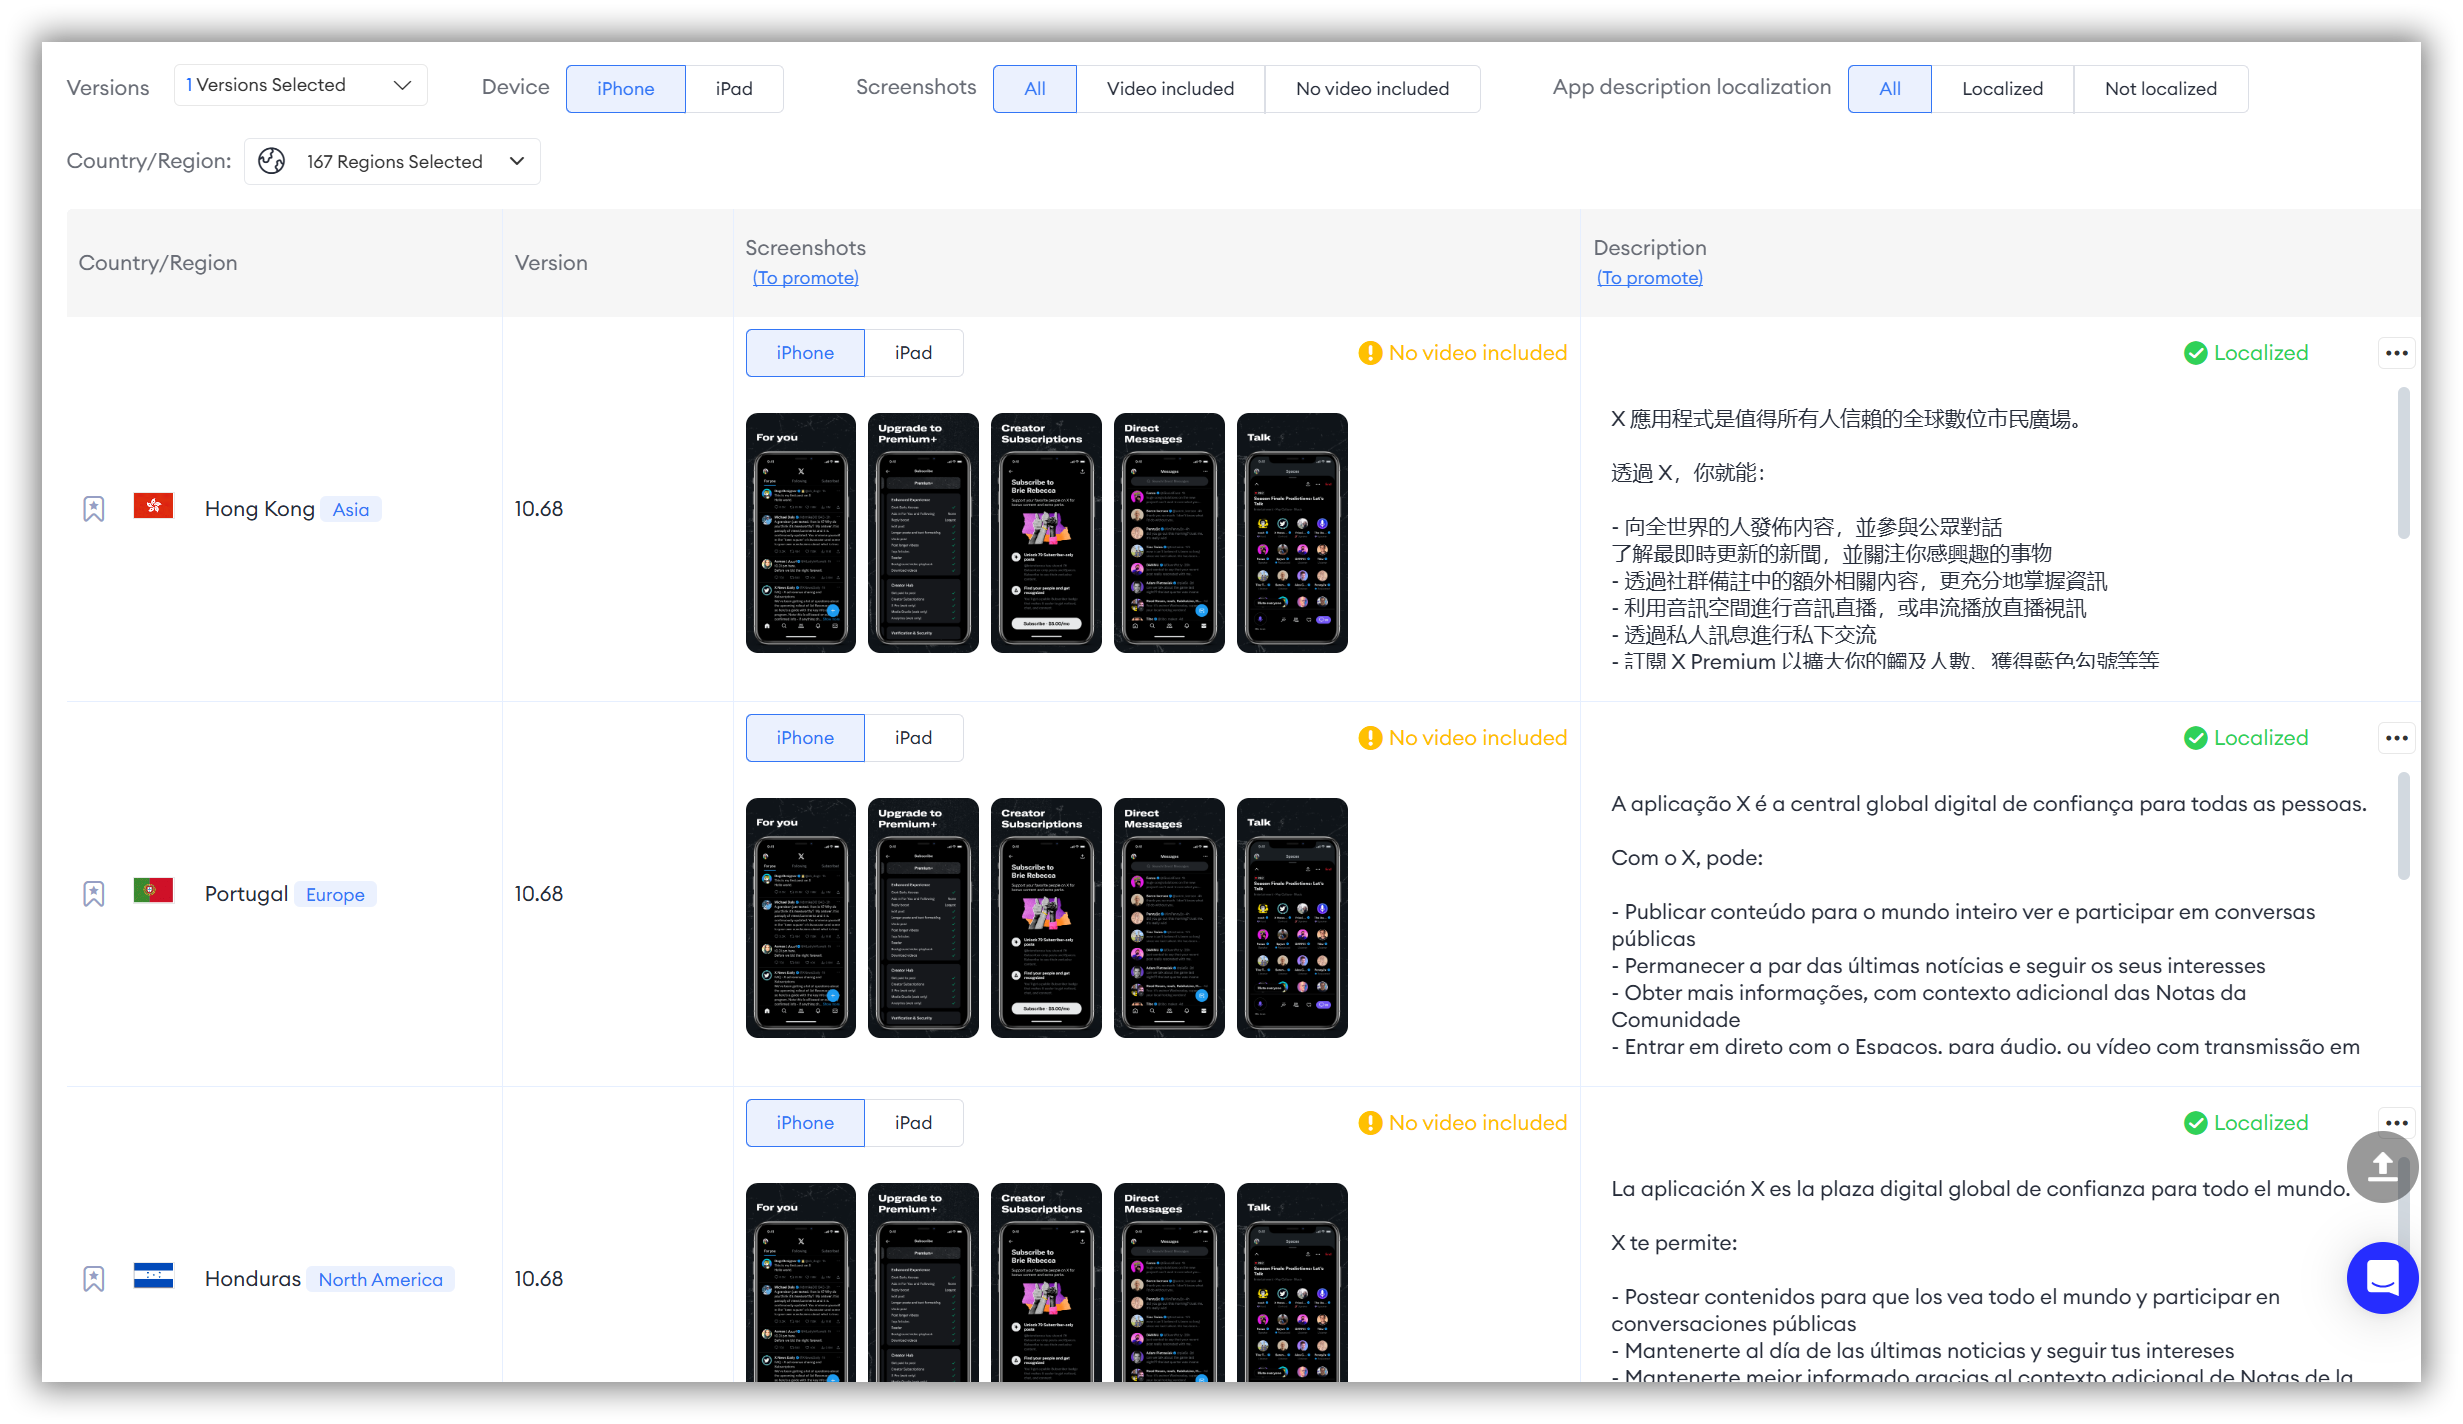
If you want to view specific App Profile details for each country, simply scroll down.
FoxData allows you to personalize your filters in this section using "Versions," "Device," "Screenshots," "App description," and "Country/Region."
🗒️ Note: The "Country/Region" filter allows you to select from all countries globally, with no limit on the number of countries you can choose.
7. ASA Bidding Keywords
"ASA Bidding Keywords" is a feature available only for apps on the App Store.
However, if your app is published on the App Store but you have not implemented Apple Search Ads, there will be no data displayed in this section.
"ASA Bidding Keywords" allows you to view, through a data visualization map and data table, in which countries the app you are tracking has deployed bidding keywords. By examining where your keywords have bidding activity, you can identify market opportunities and determine which regions may require increased investment.
Additionally, this feature helps you understand competitors' keyword strategies in different regions, allowing you to adjust your own bidding and keyword selection to gain a competitive advantage.
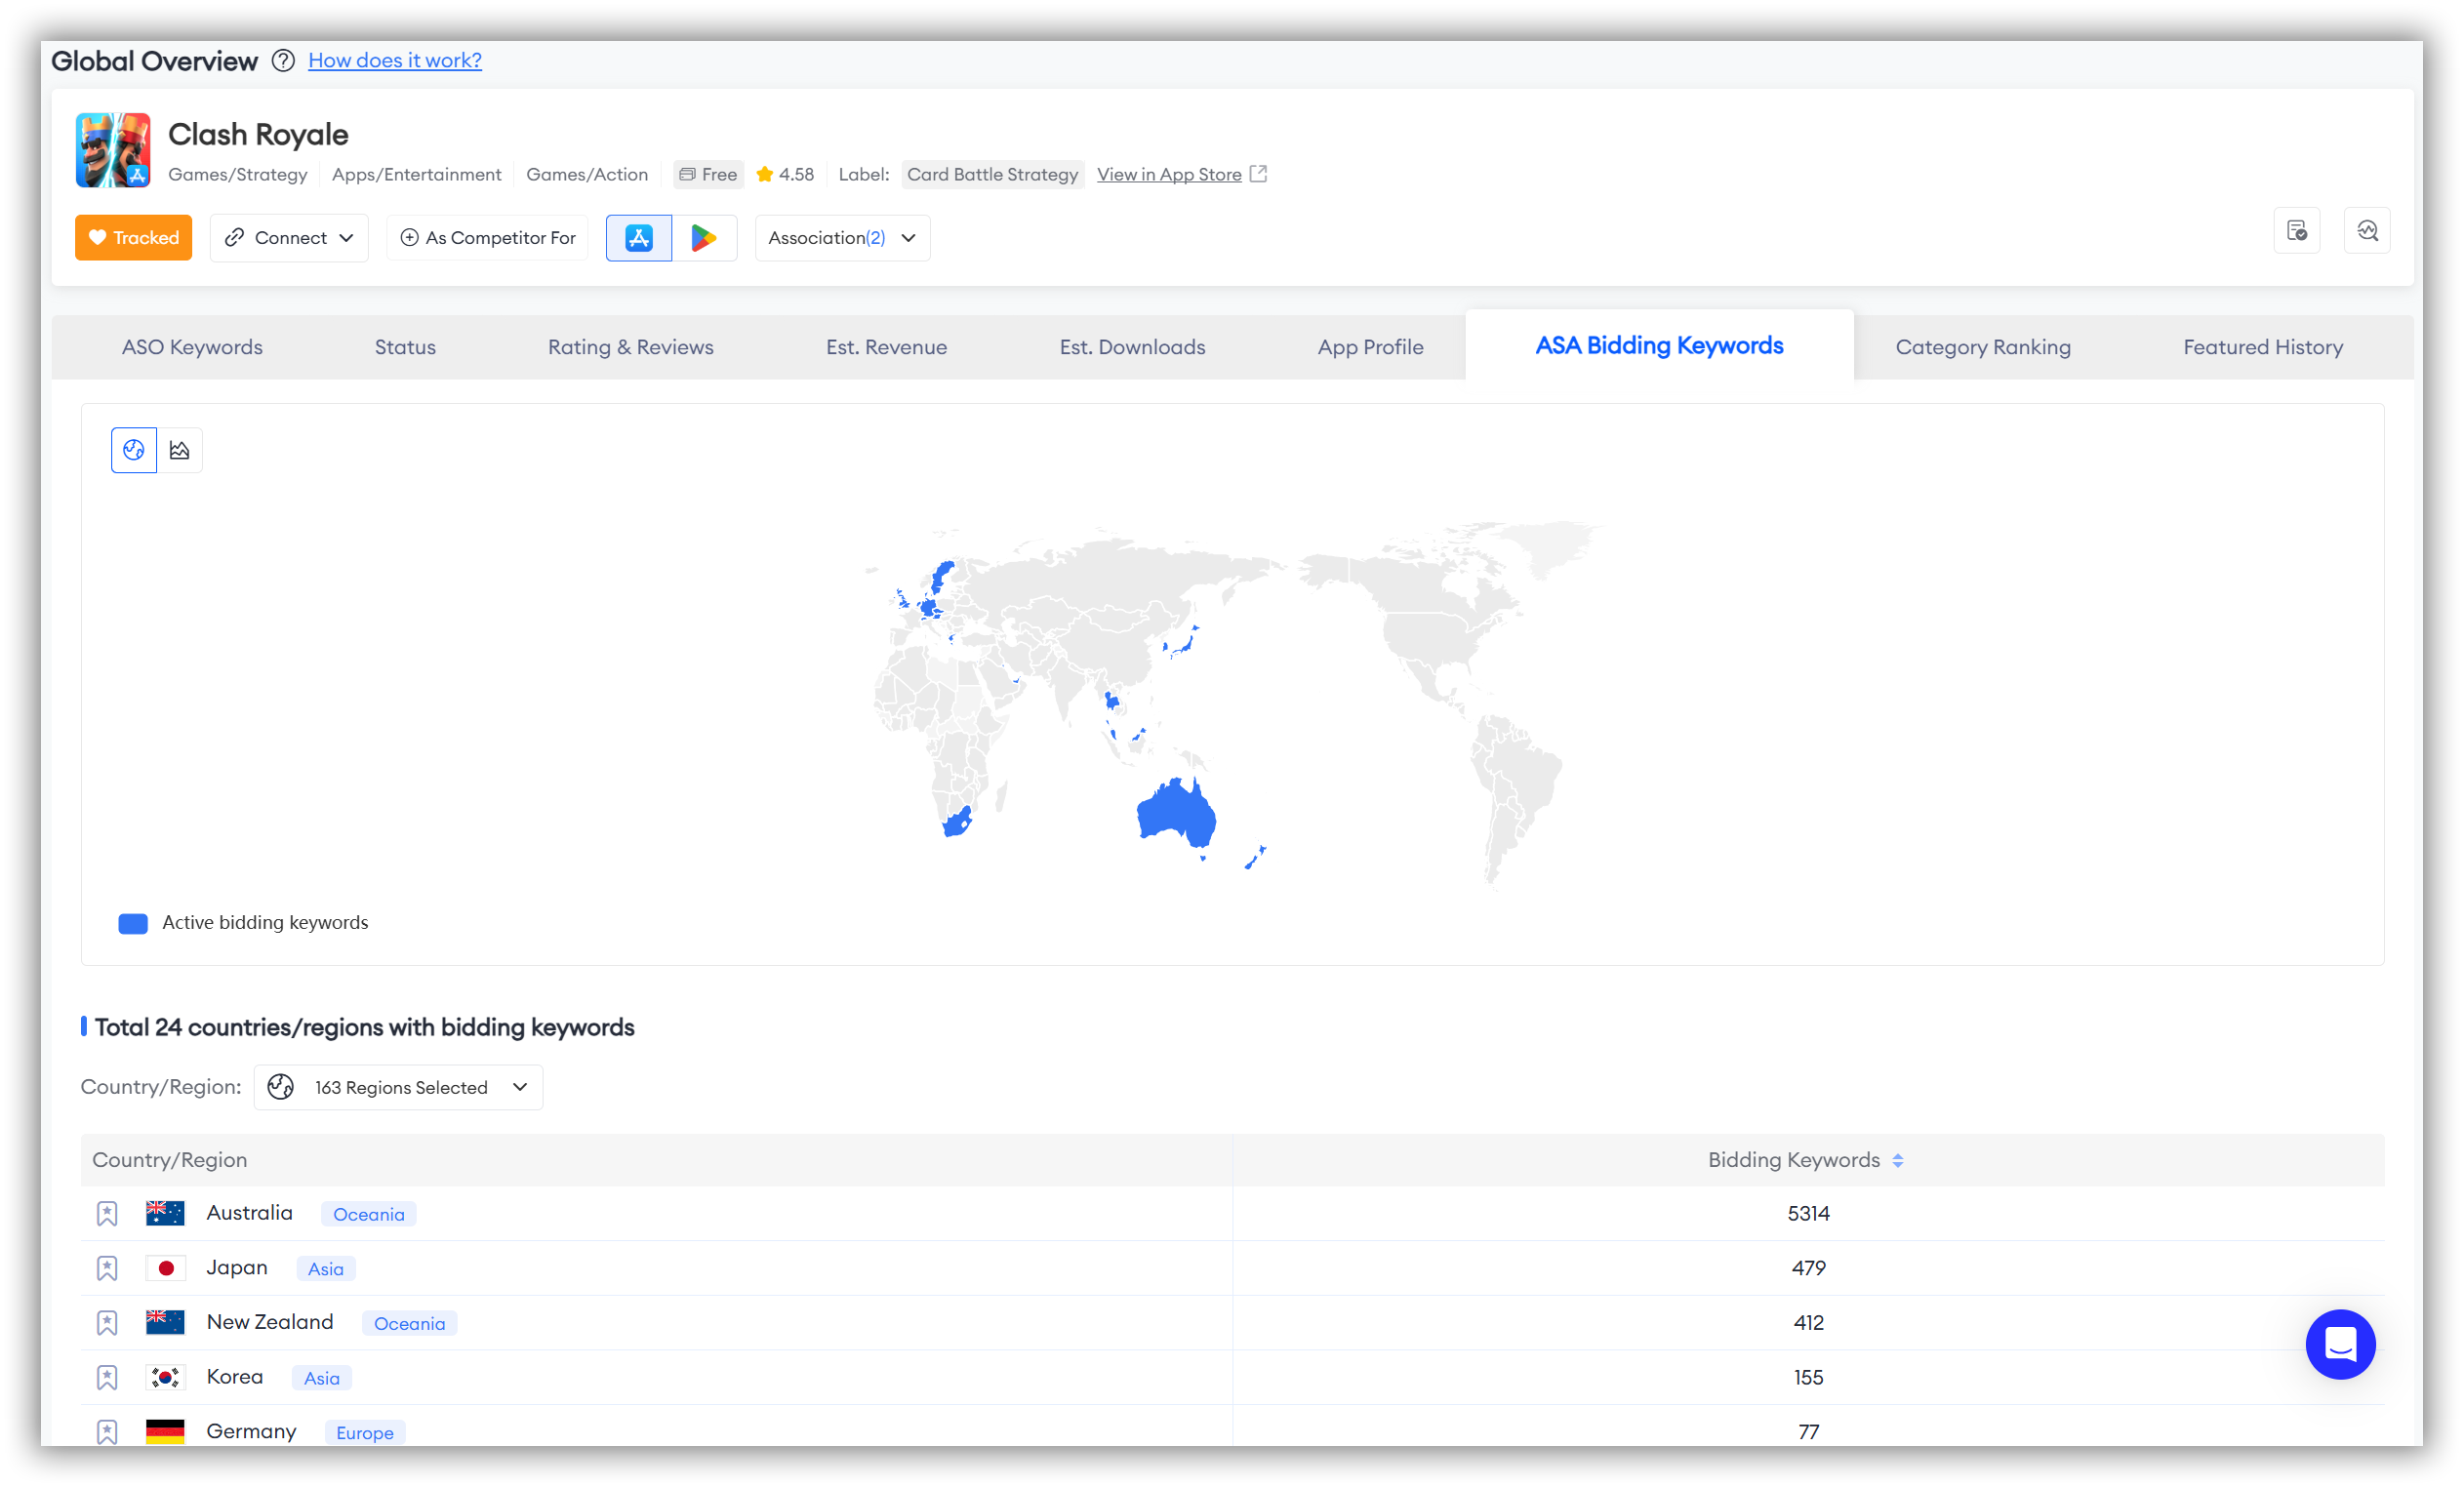
There are two ways to study the map data in this section:
- The first method allows you to view the global overview. Here's how it works:
As seen when you first open the page, blue represents "Active" and gray represents "Inactive." The map on the right corresponds to the colors on the left, indicating different statuses.
For example, as shown in the illustration, we can clearly see that "Clash Royale" has deployed Apple Search Keywords only in certain regions like Australia, Japan, and South Korea.
If you're not very familiar with the world map, you can directly refer to the data table below to get specific information about the countries covered by "ASA Bidding Keywords."
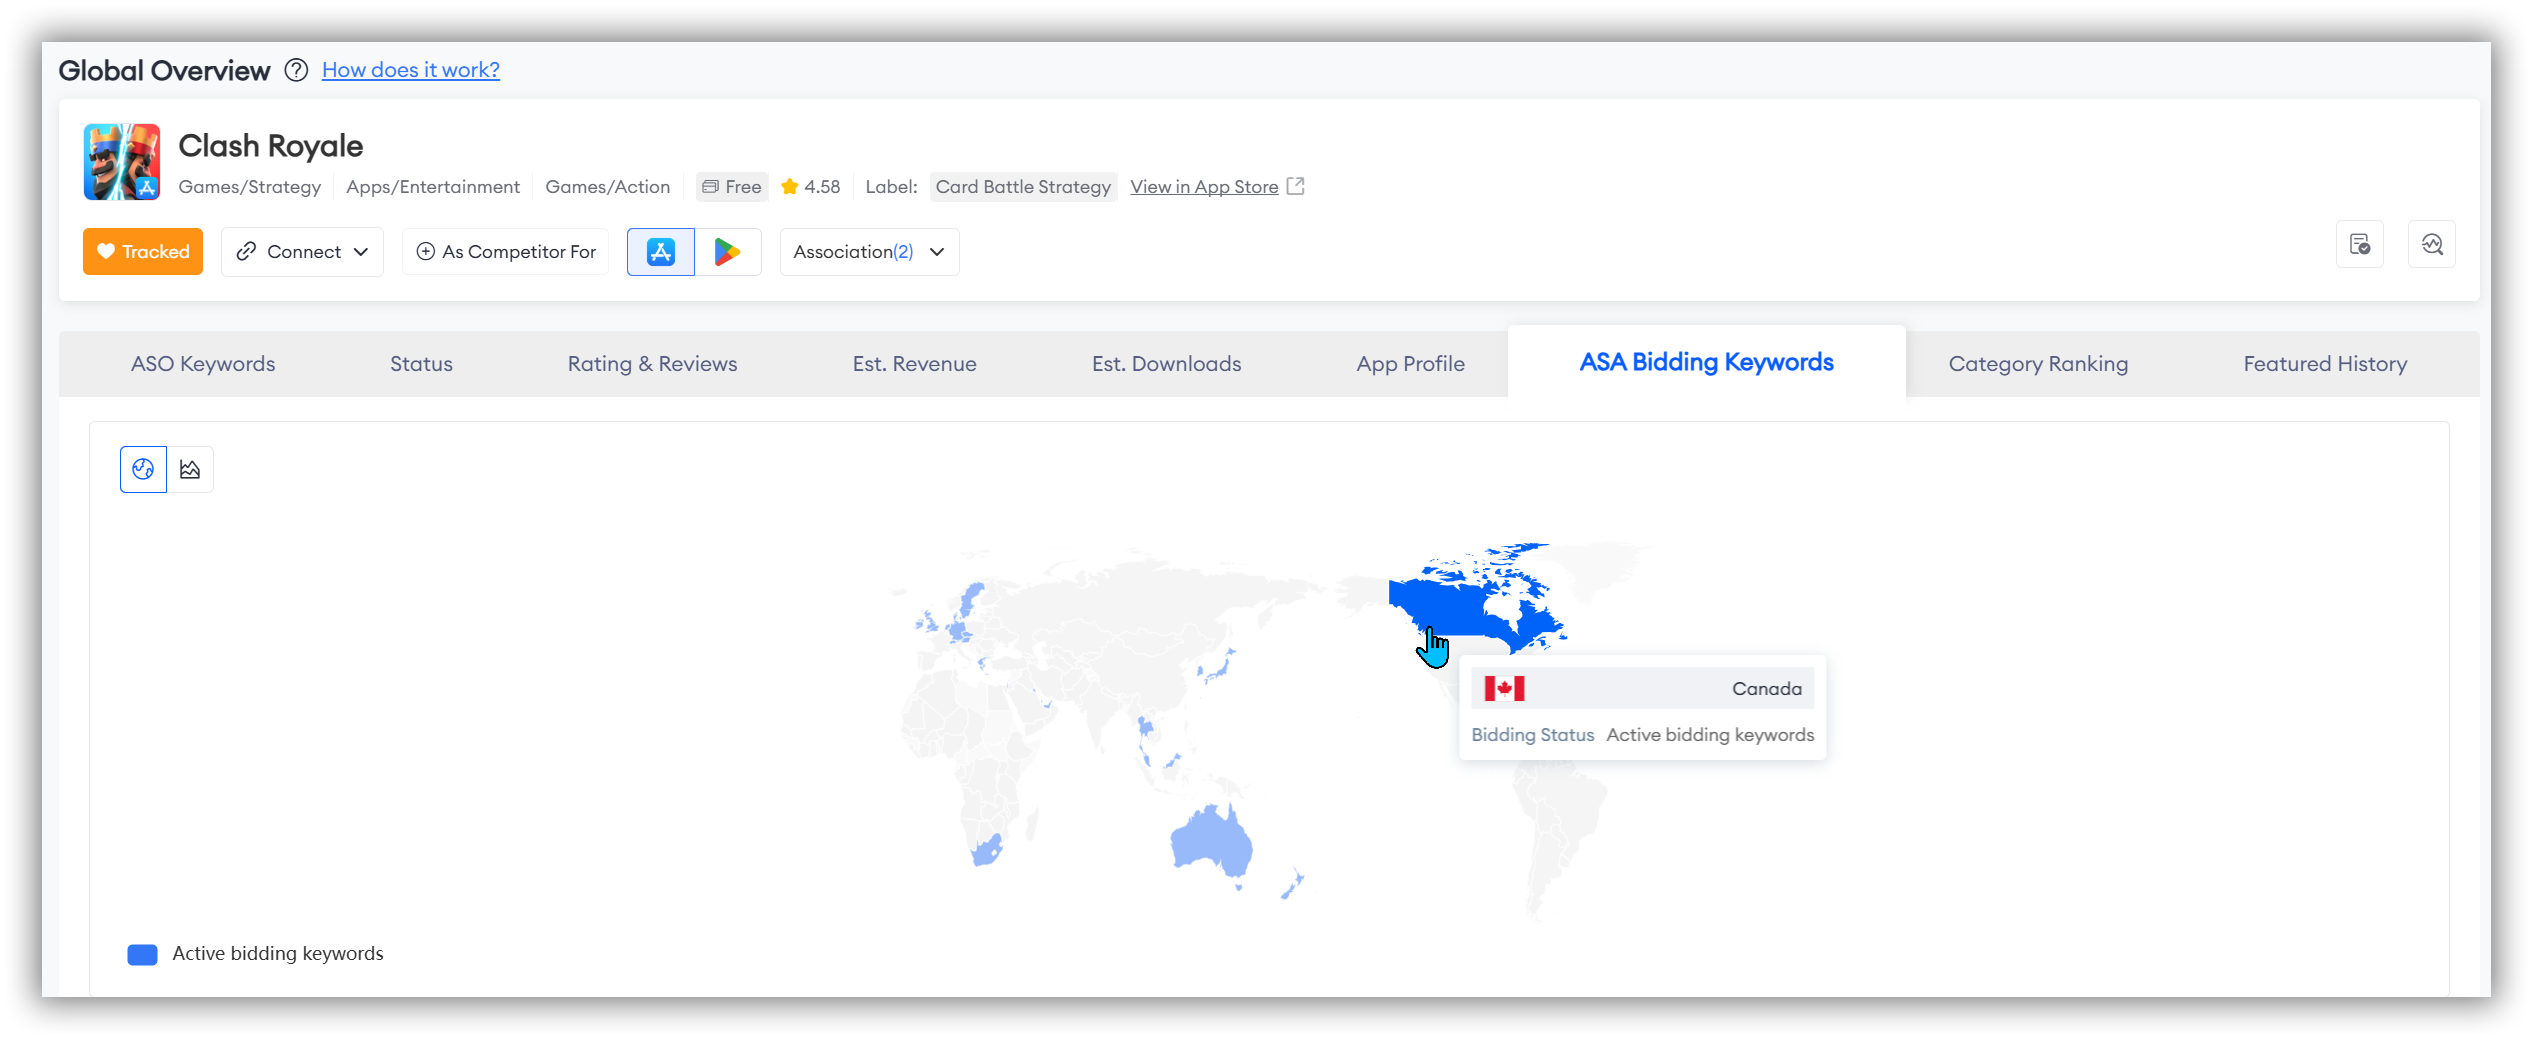
- The second method allows you to conduct a more precise and personalized study of the regions you are interested in. Here's how it works:
Simply hover your mouse over the ranking data axis on the left or the map on the right.
ASA Bidding Keywords Trends
If you want to explore the historical trends of ASA Bidding Keywords for your app on Trak, simply click the line chart icon in the top left corner. This allows you to analyze trend changes within your selected time frame.
With this detailed trend analysis, you can better develop global advertising strategies, optimize keyword bidding and ad placements in various countries, and enhance your app's performance in international markets.
🗒️ Note: You can select up to 10 countries of interest for your analysis here.

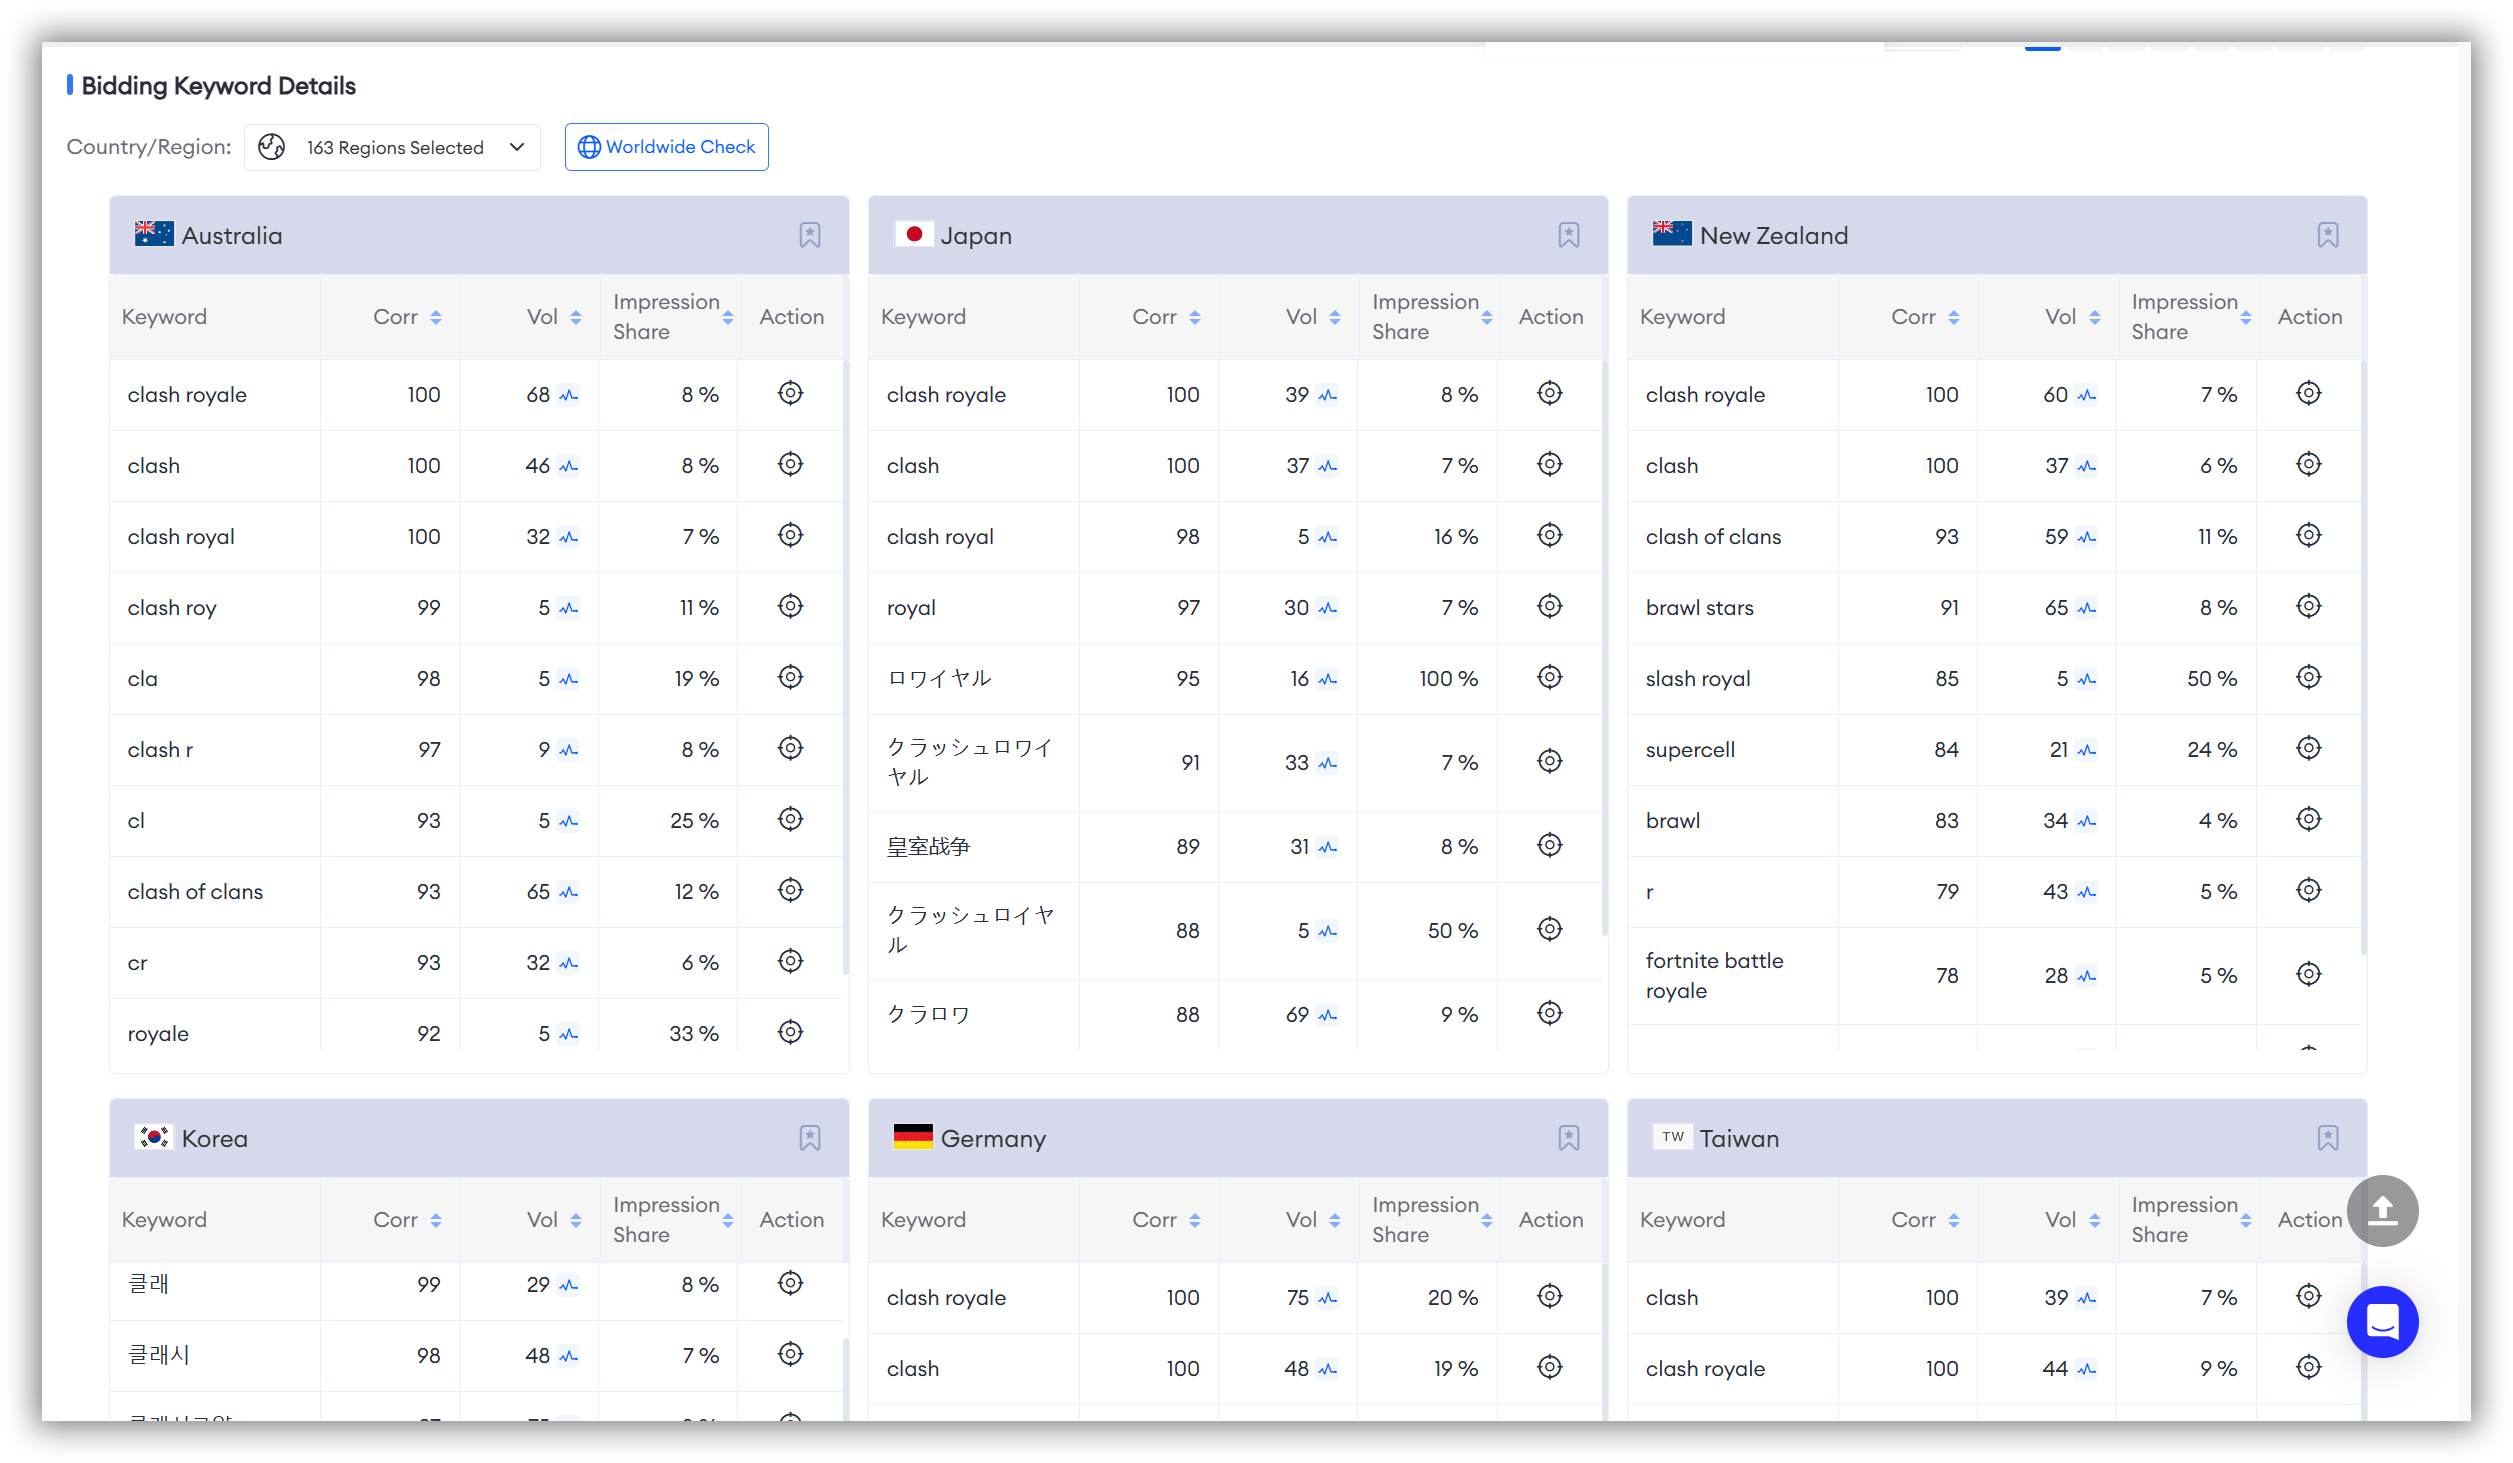
Bidding Keywords Details
If you want to delve deeper into the specifics of keywords for each country where ASA Bidding Ads have been placed, simply scroll down the page.
The "Bidding Keywords Details" section provides detailed information on bidding keywords for all countries.
To quickly find the bidding keyword details for a country you’re interested in, you can filter directly in the "Country/Region" section.
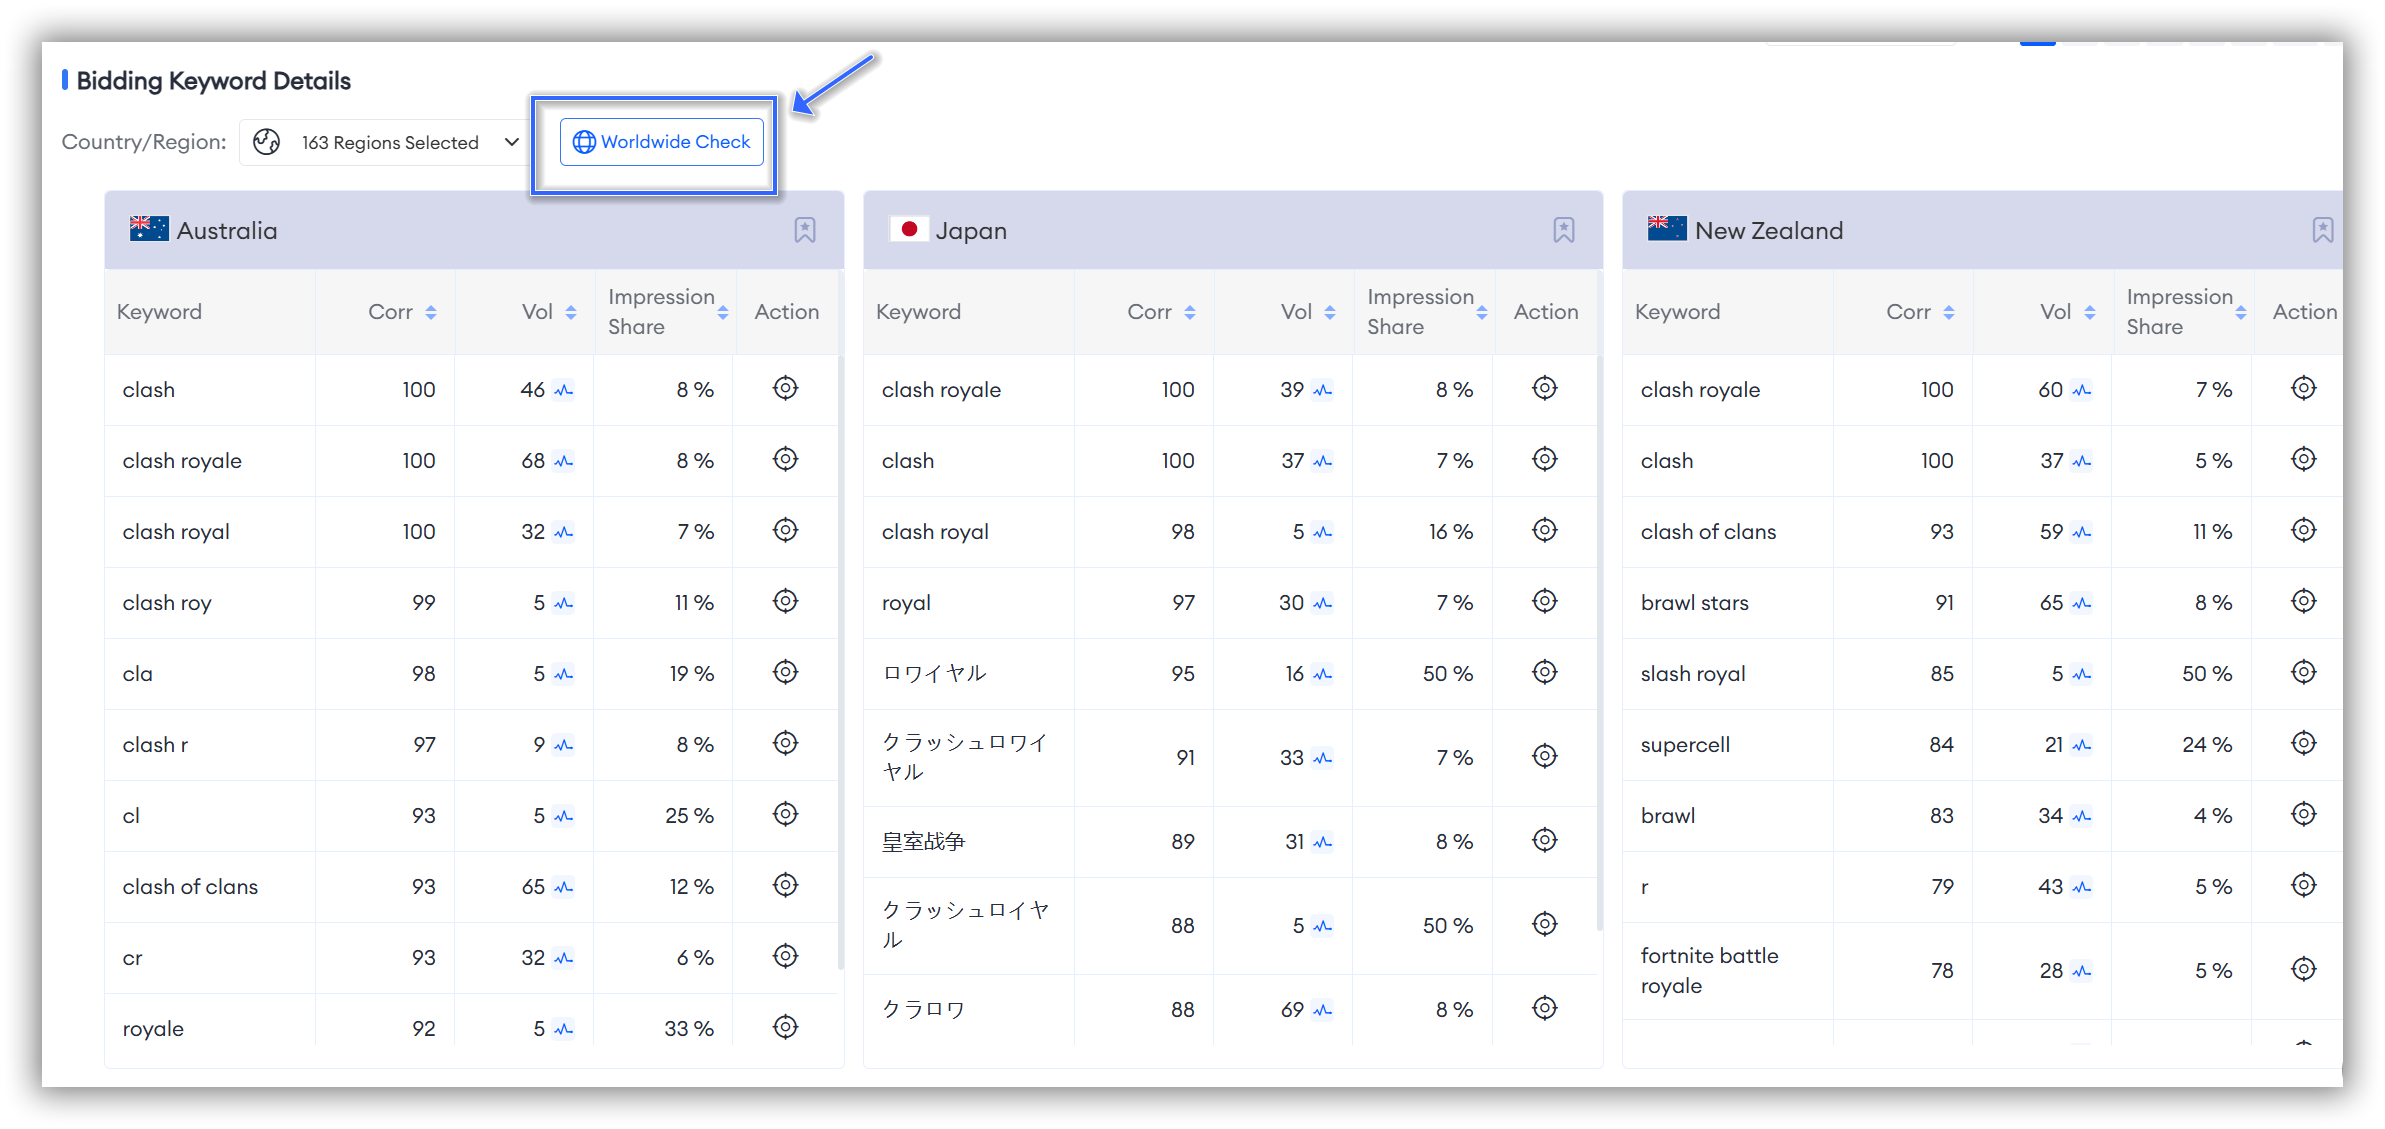
Or do you have specific target keywords in mind?
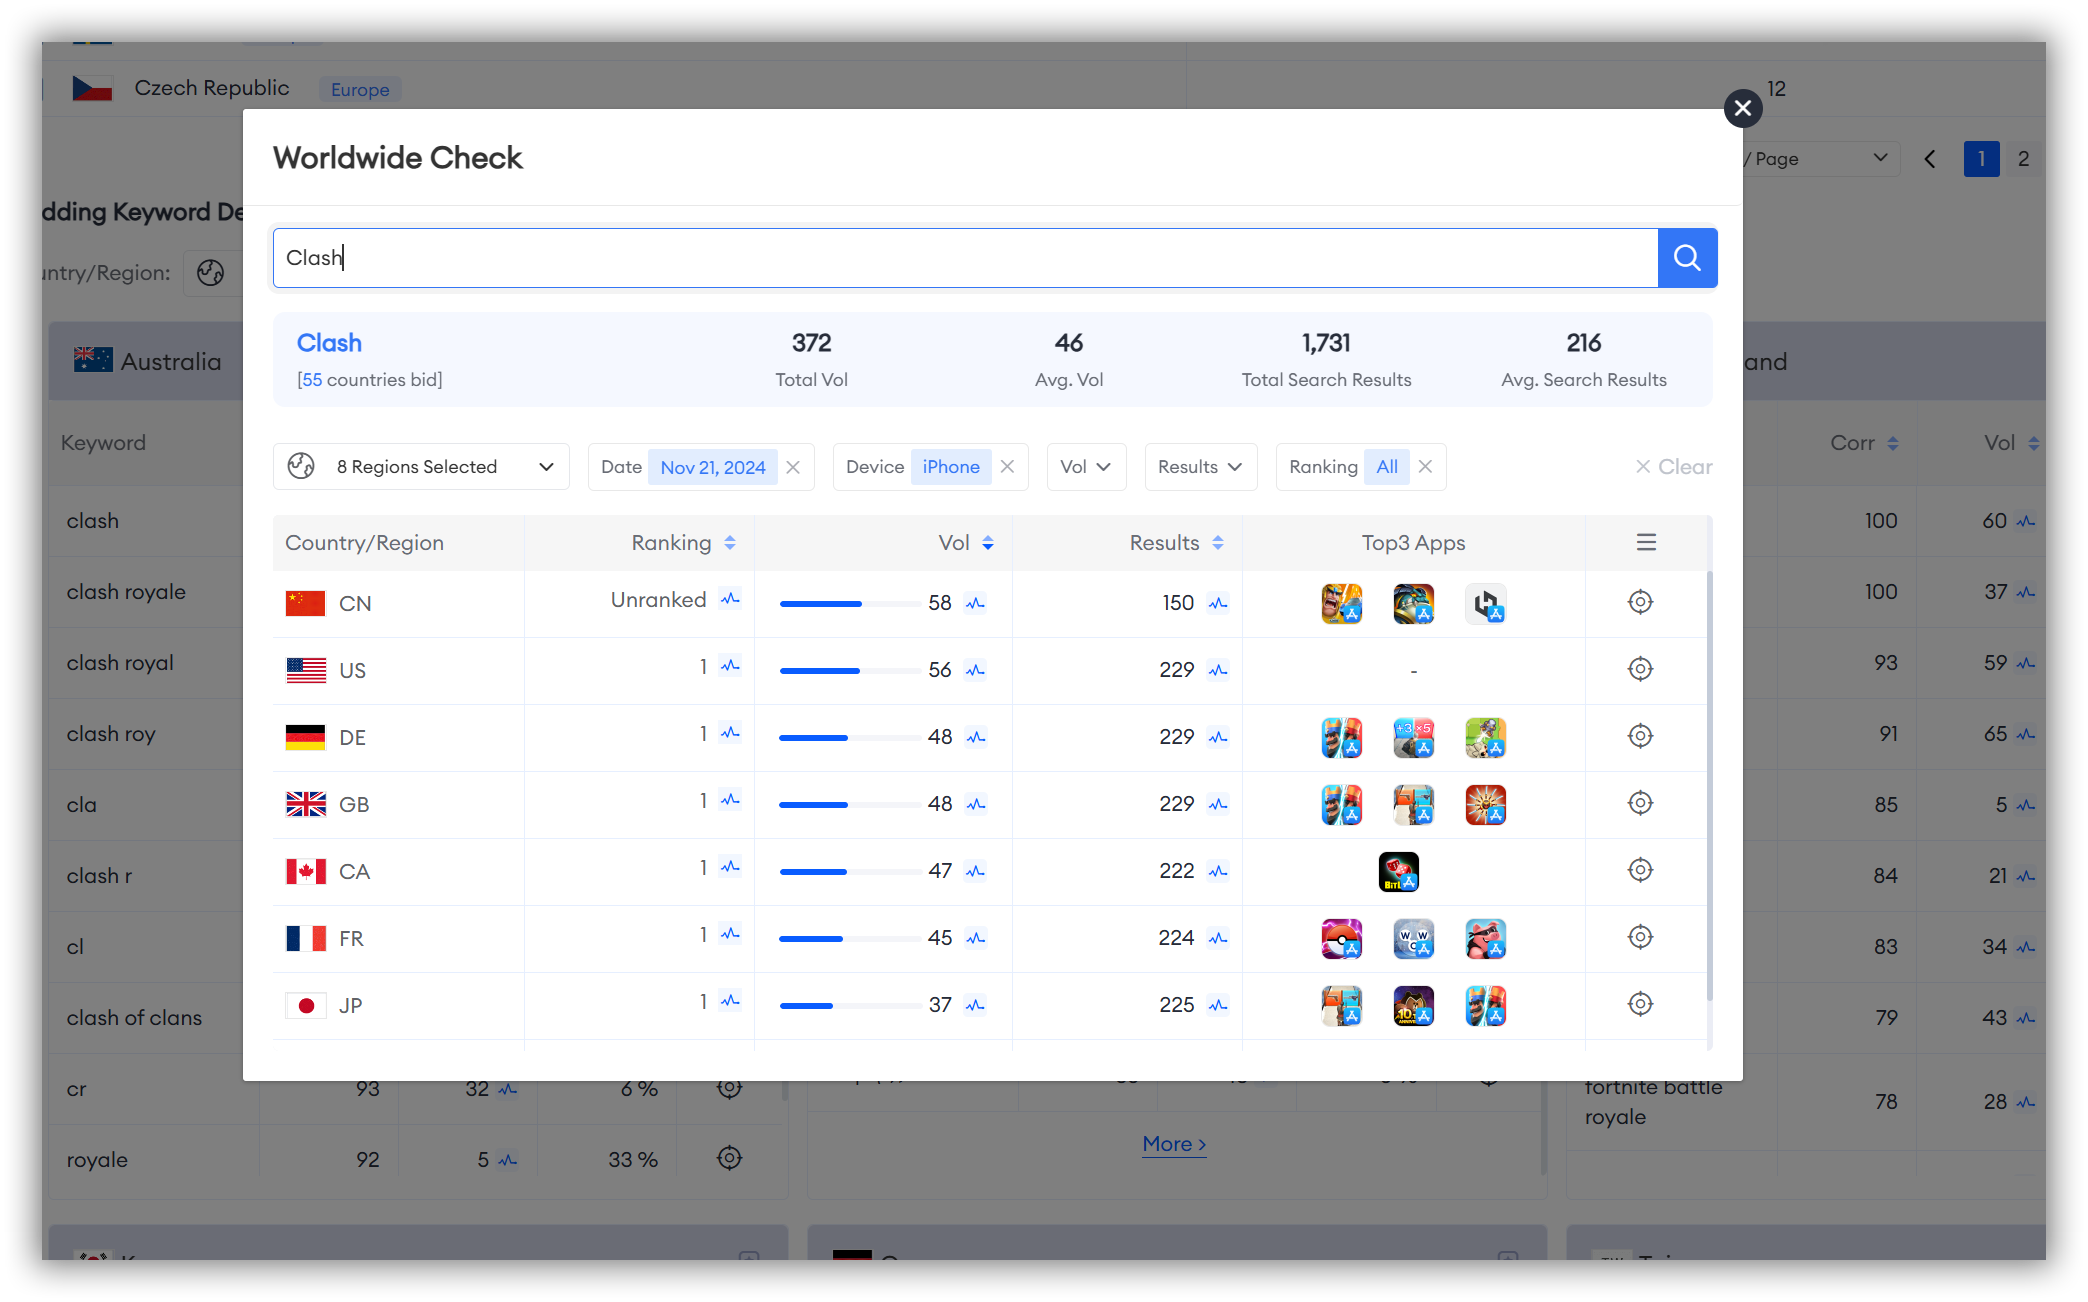
No worries! FoxData allows you to directly check the global performance of specific keywords!
Simply click on "Worldwide" in the top left corner and search for the specific keywords you're interested in.
8. Category Ranking
This can help you identify which markets have higher demand or potential for your app and understand competitors' performance in different markets, assisting you in adjusting your strategy to enhance competitiveness.
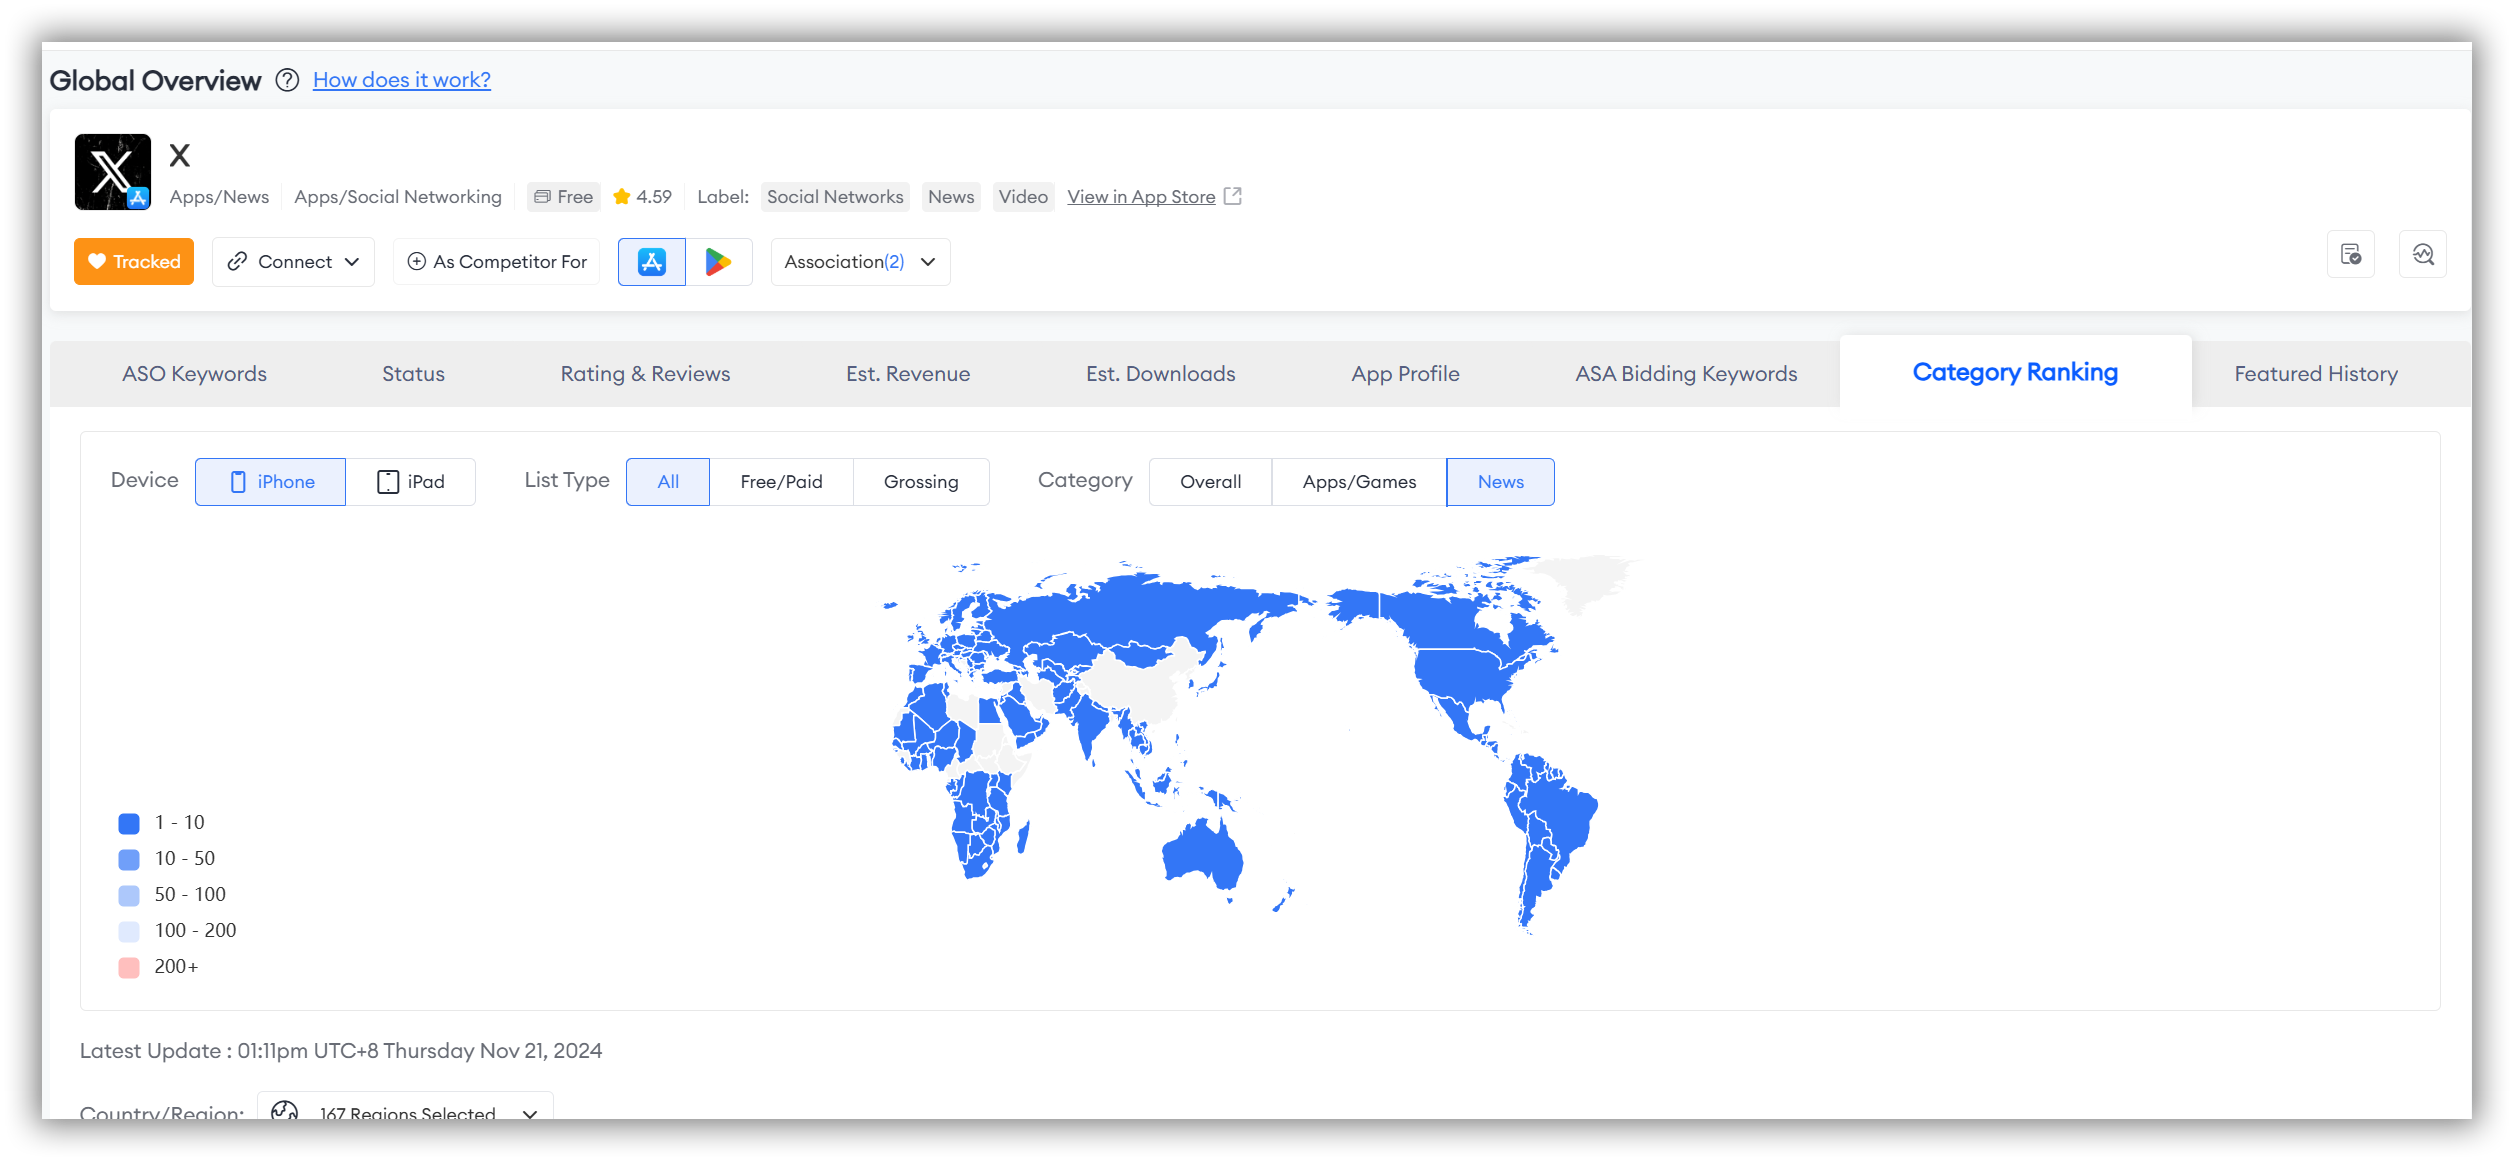
There are two ways to study the map data in this section:
- The first method allows you to view the global overview. Here's how it works:
As seen when you first open the page, the colors on the left represent different data values. The map on the right corresponds to these colors, representing various data points.
The deeper the shade of blue, the higher the category ranking; lighter shades indicate lower rankings. Rankings beyond 200 are shown in red.
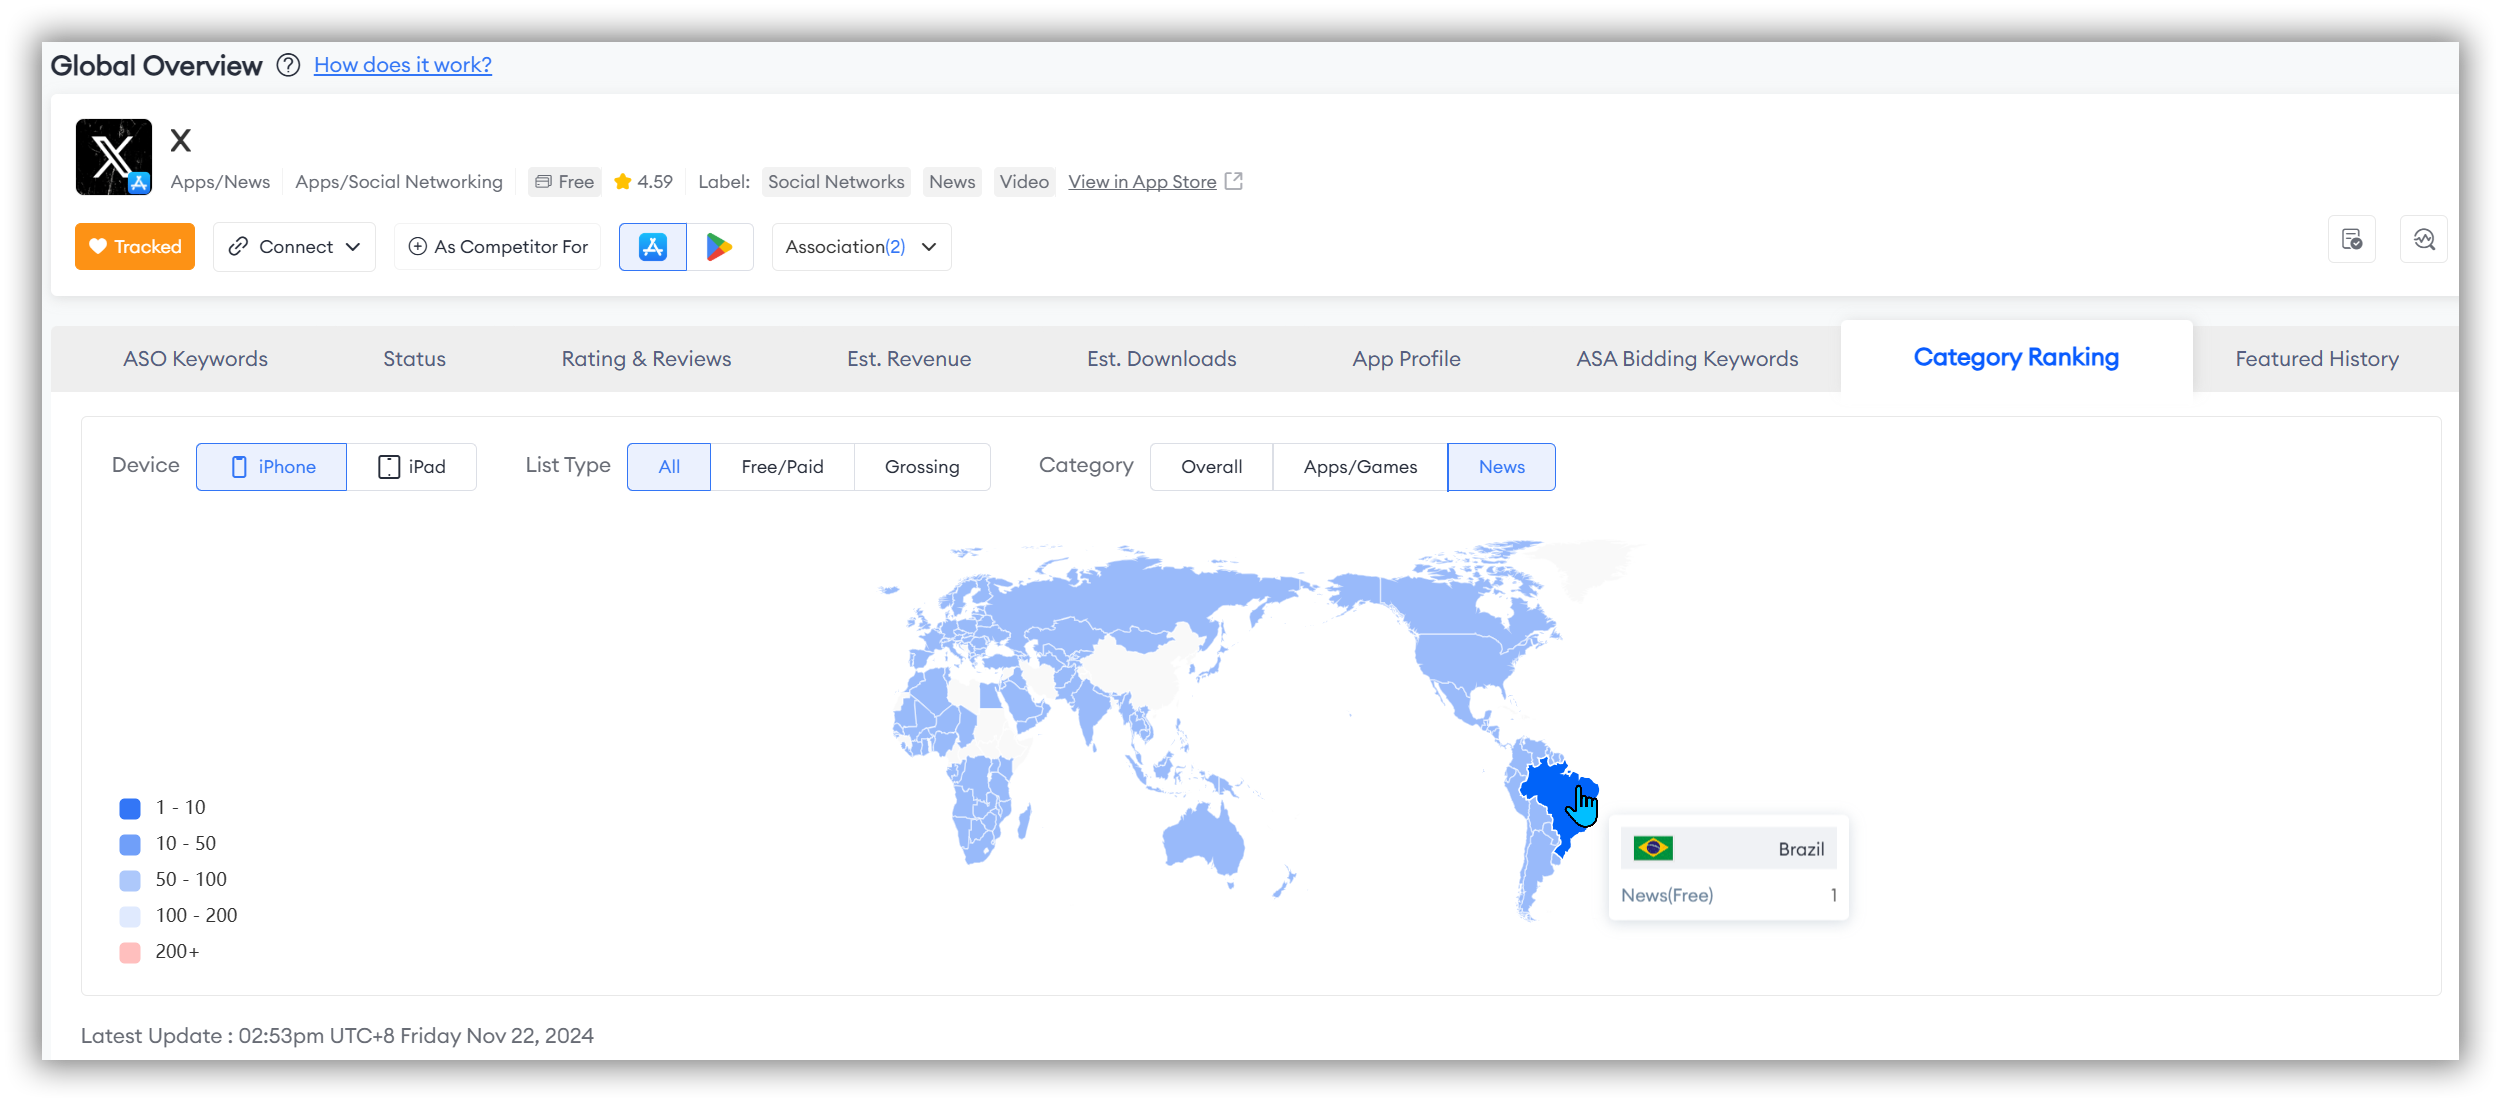
- The second method allows you to conduct a more precise and personalized study of the regions you are interested in. Here's how it works:
Simply hover your mouse over the ranking data axis on the left or the map on the right.
Category Ranking Details
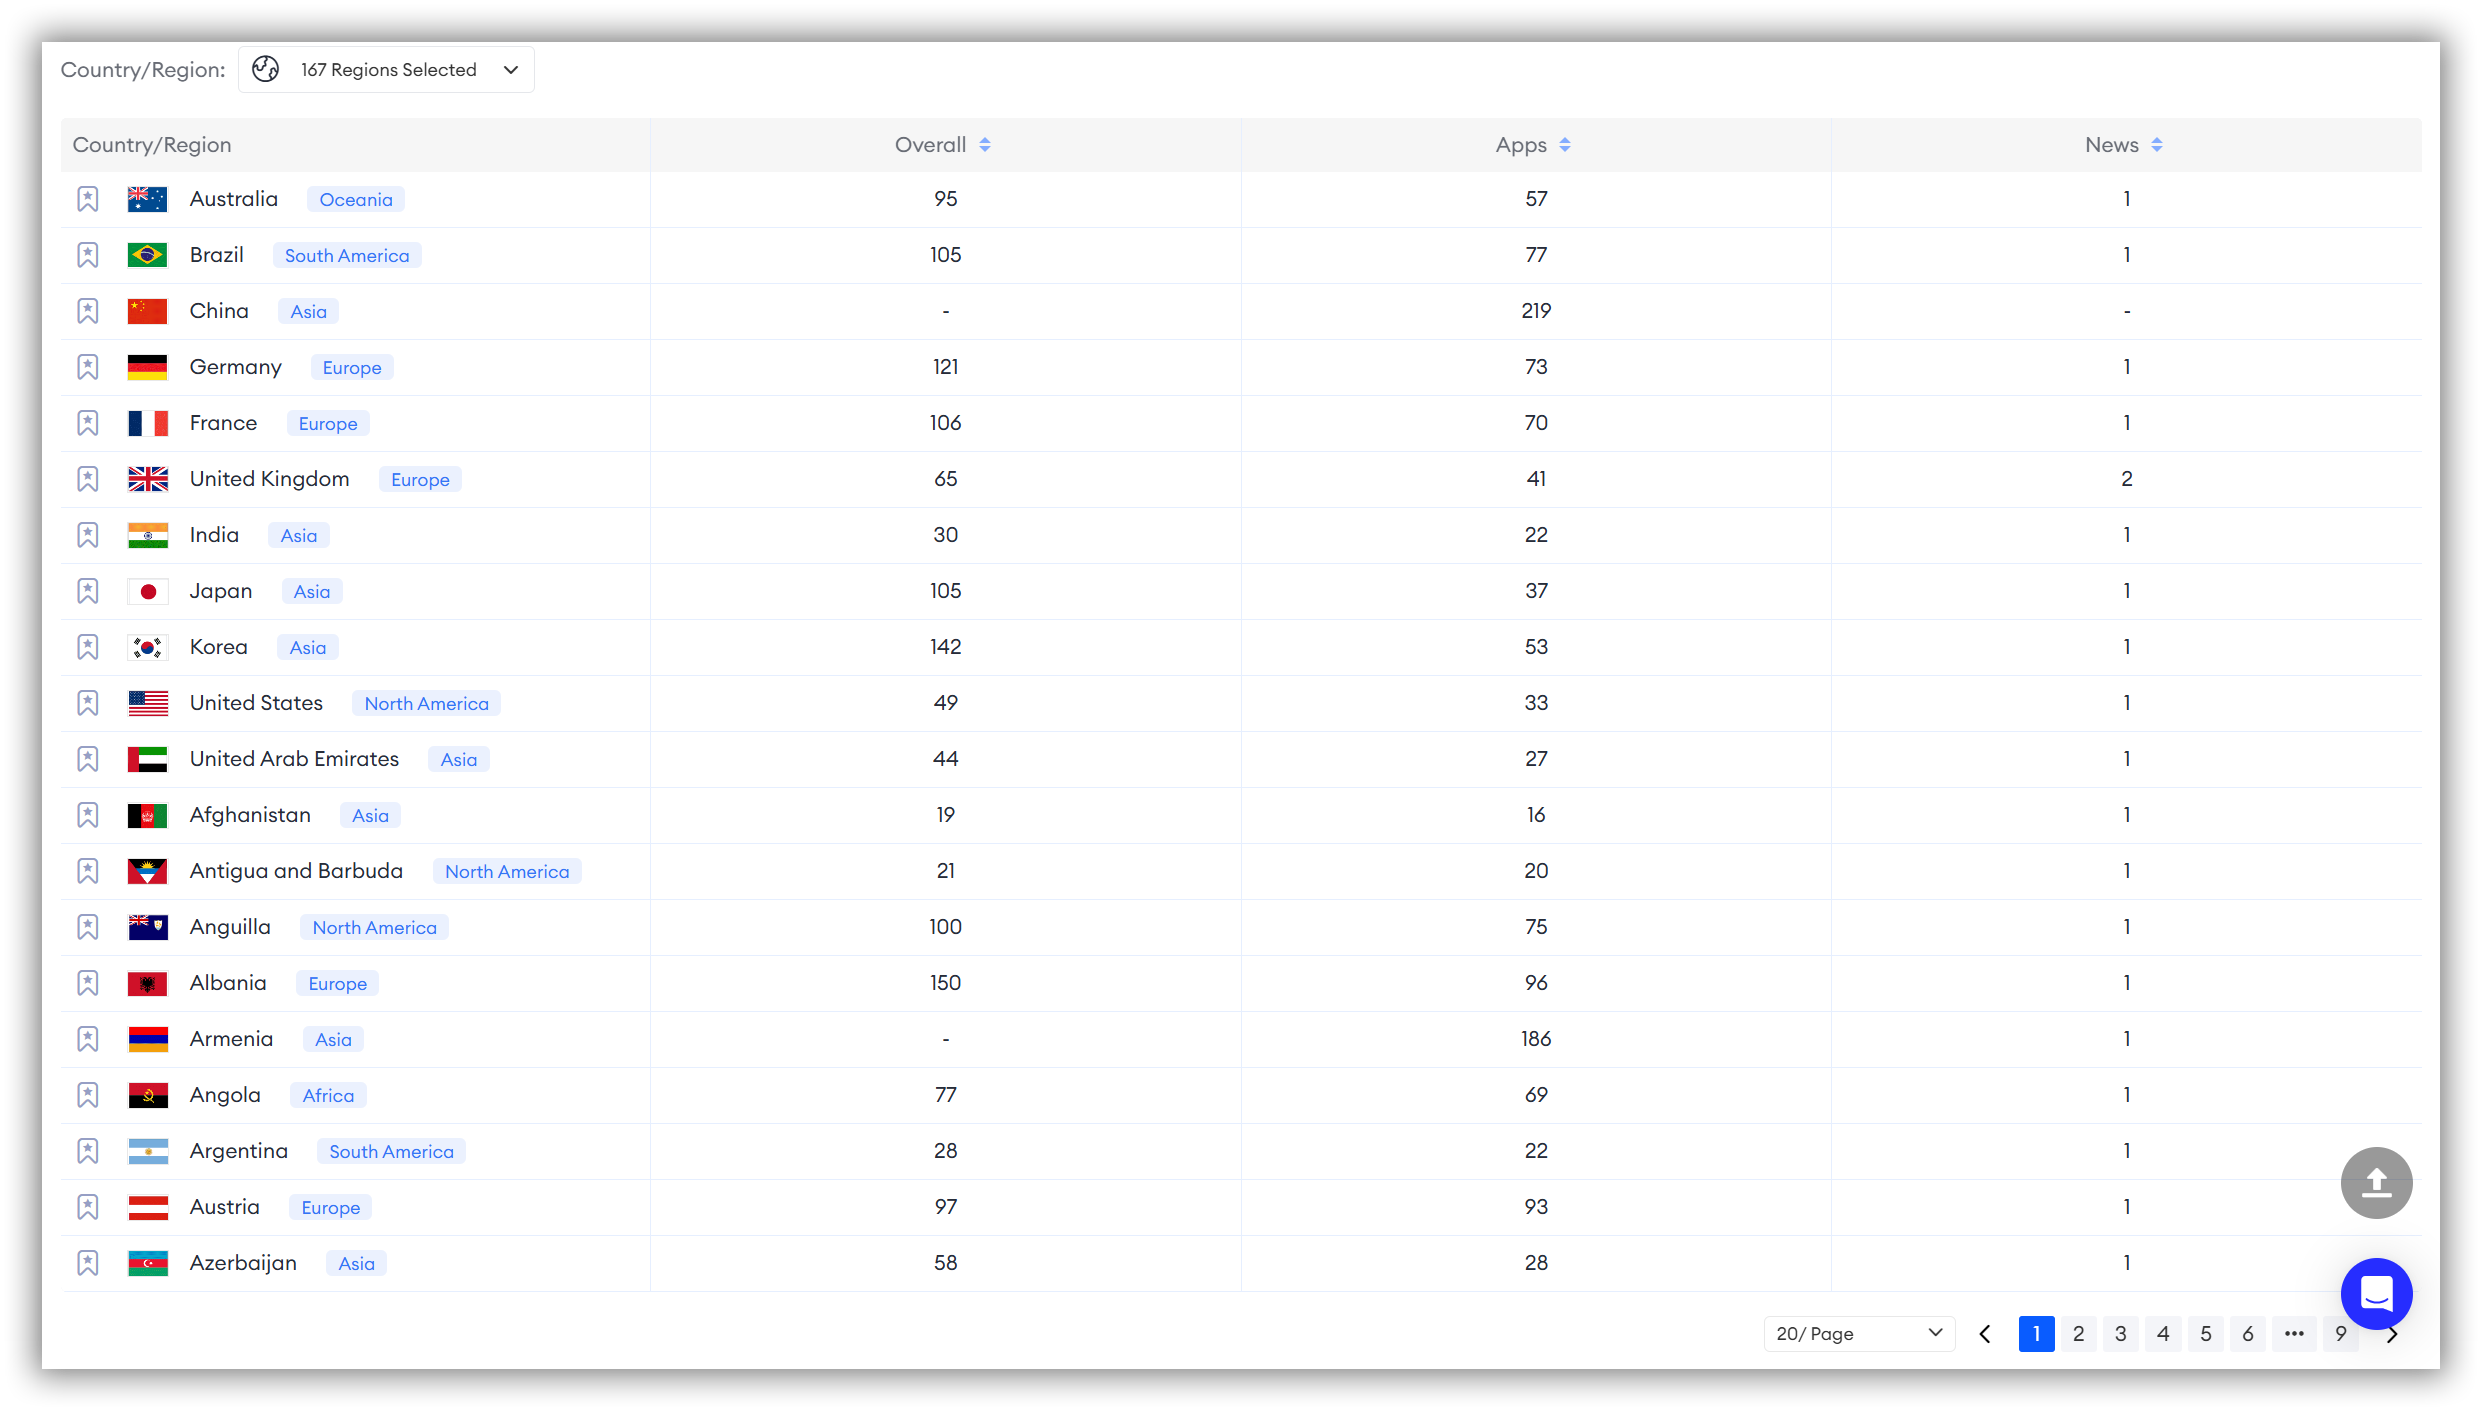
If you want to delve deeper into the specific data for each country, simply scroll down the page.
The "Category Ranking Details" section helps you conduct a more comprehensive analysis across four key dimensions: "Country/Region," "Overall," "Apps," and "News."
🗒️ Note: The "Country/Region" filter allows you to select all countries globally without any limit on the number.
9. Featured History
The "Featured History" is a feature section available exclusively for apps on the App Store.Featured History Global Overview
The Featured History Global Overview includes a data visualization map and a data summary at the bottom, providing you with a quick foundational understanding of the global "featured" status of the apps you are tracking.
The "Featured History" feature allows you to view the featured history of your tracked apps worldwide through a visualization map. This map helps you easily identify which regions have a higher frequency of featuring your app, thereby gaining insights into market trends.
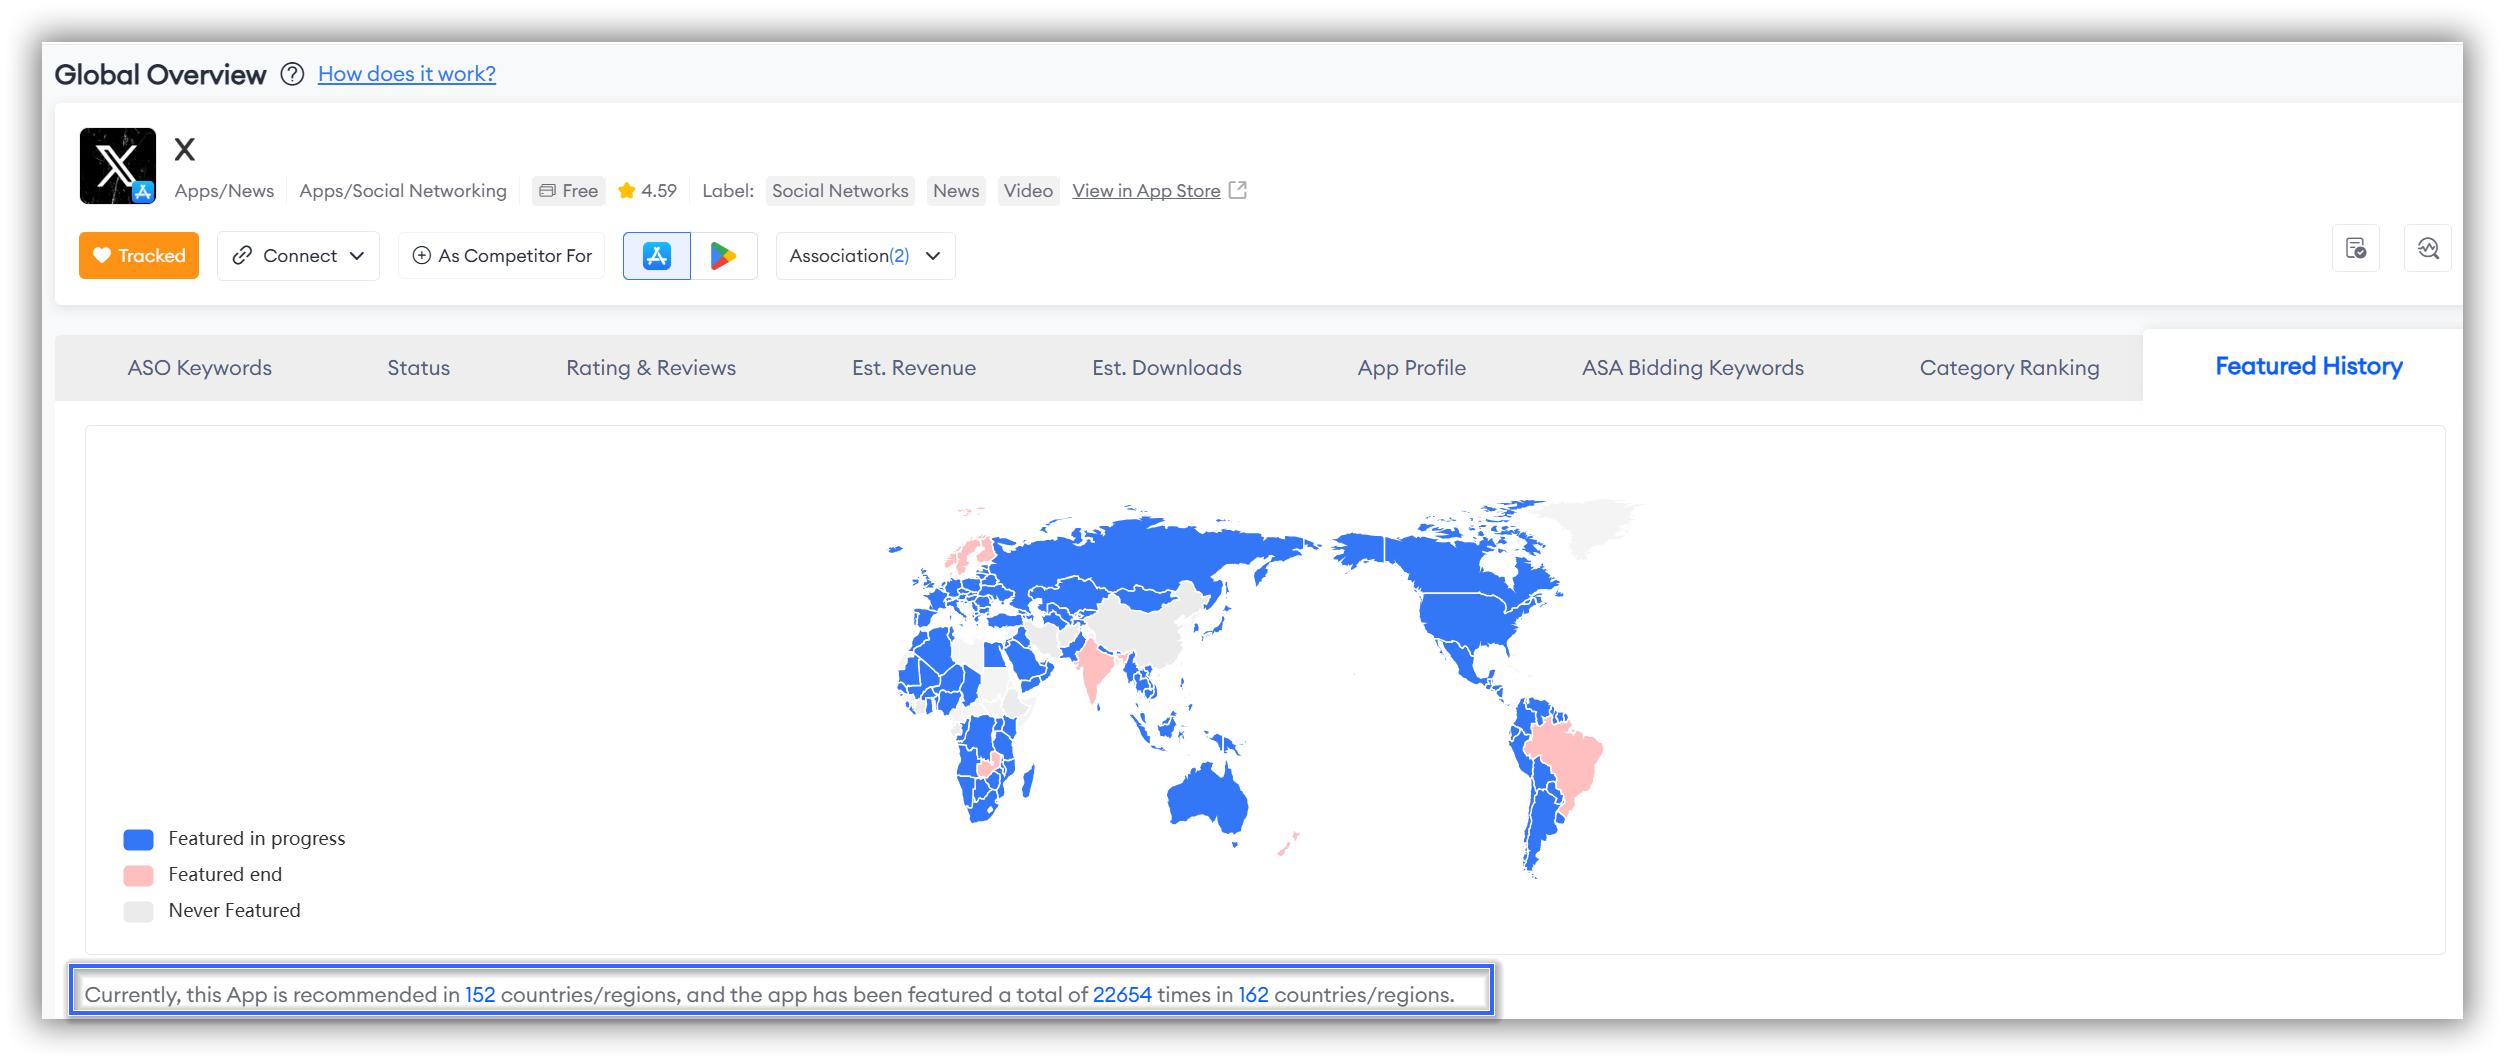
There are two ways to study the map data in this section:
- The first method allows you to view the global overview. Here's how it works:
As seen when you first open the page, the colors represent different statuses: Blue indicates "Featured in progress." Red signifies "Featured end." Gray means "Never Featured."
The map on the right corresponds to these colors, representing the different statuses for your tracked app across various regions.
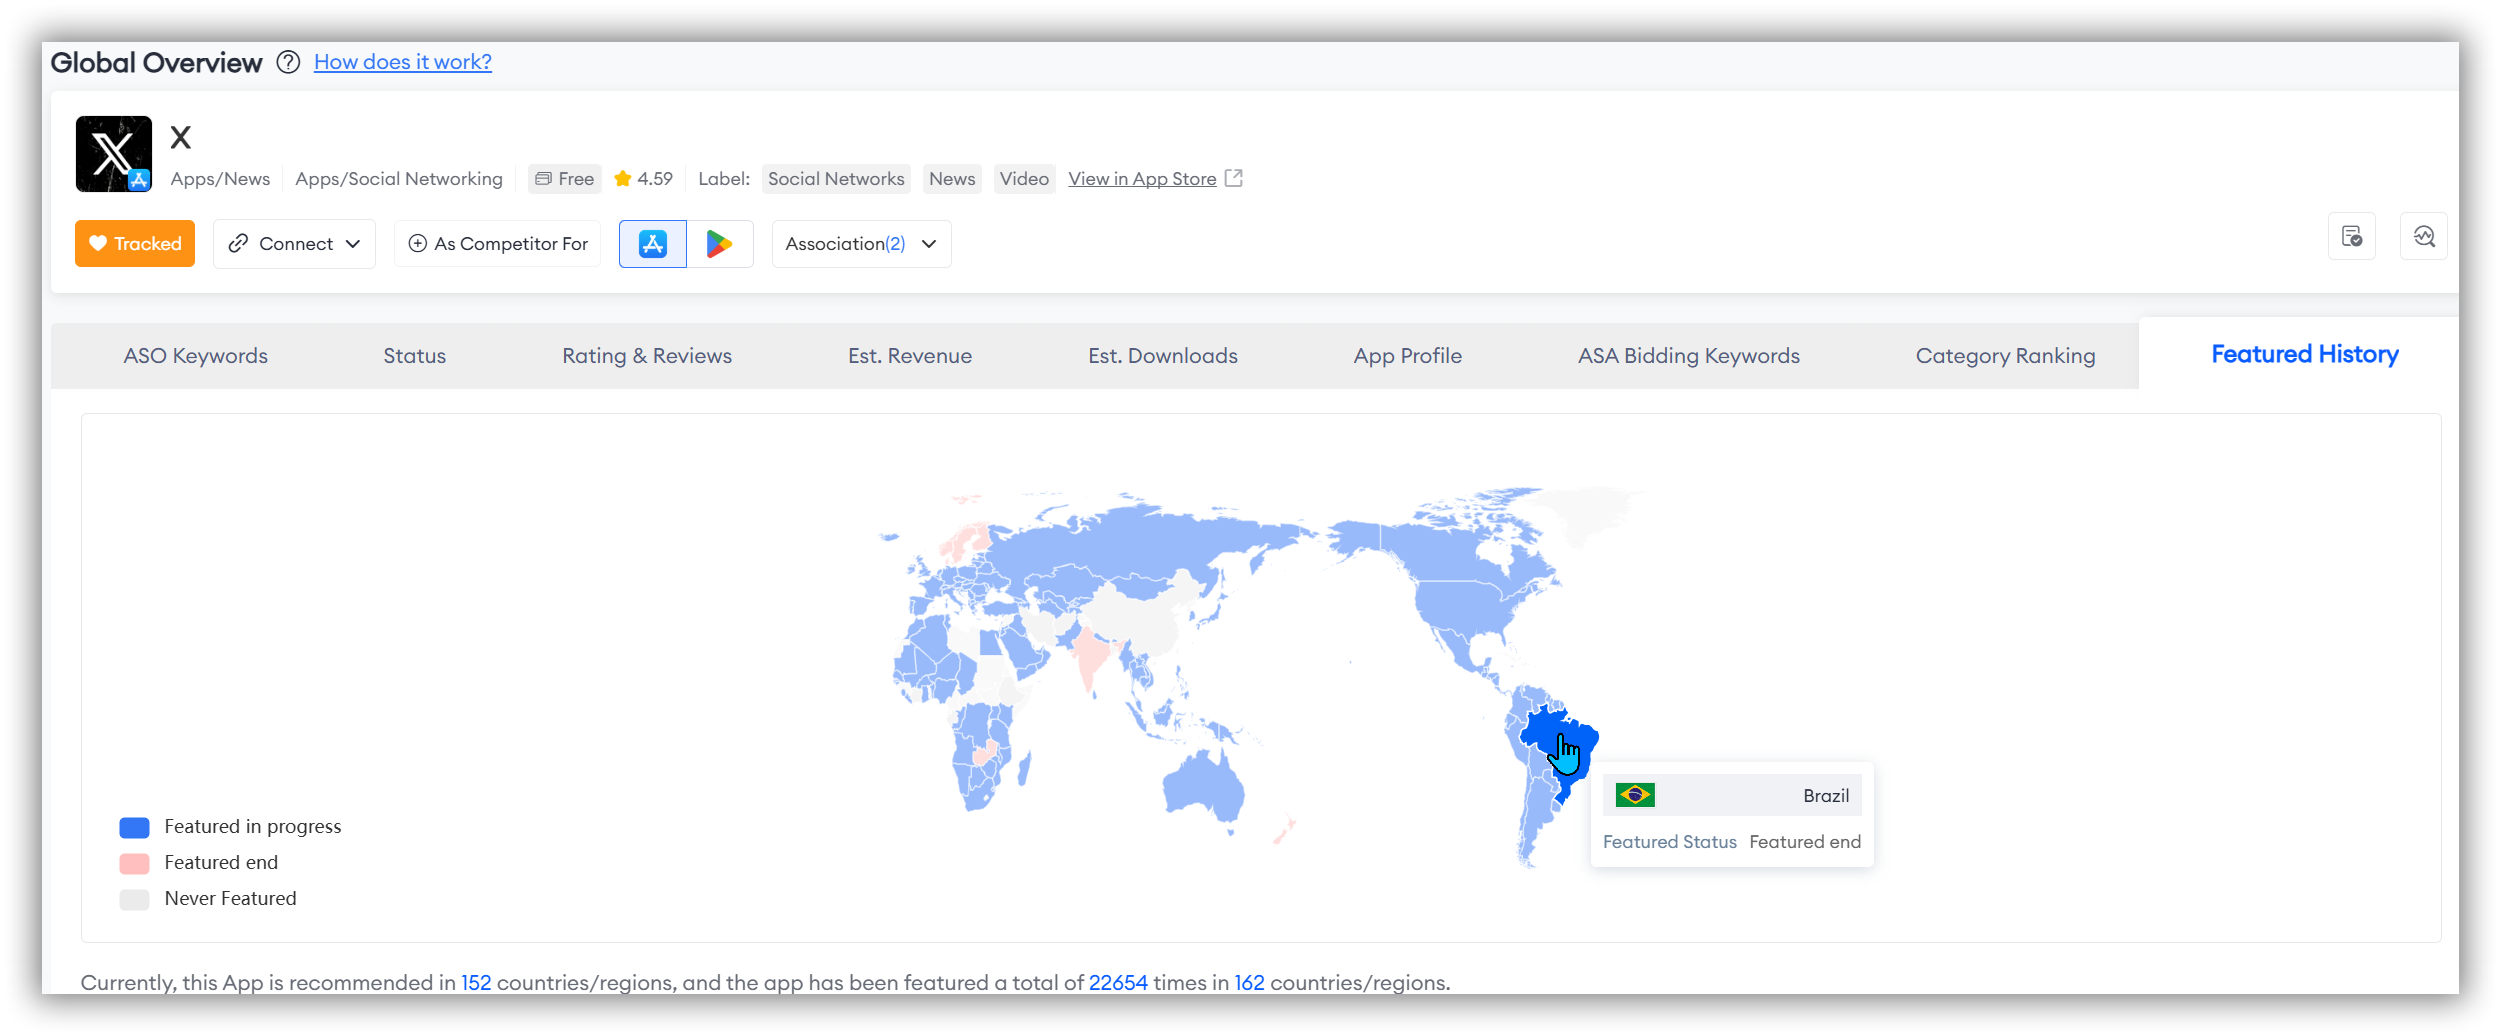
- The second method allows you to conduct a more precise and personalized study of the regions you are interested in. Here's how it works:
Simply hover your mouse over the ranking data axis on the left or the map on the right.
Featured History Details
If you want to explore specific data for each country further, simply scroll down the page.
FoxData allows you to conduct more personalized research by filtering through "Date," "Status," and "Country/Region."
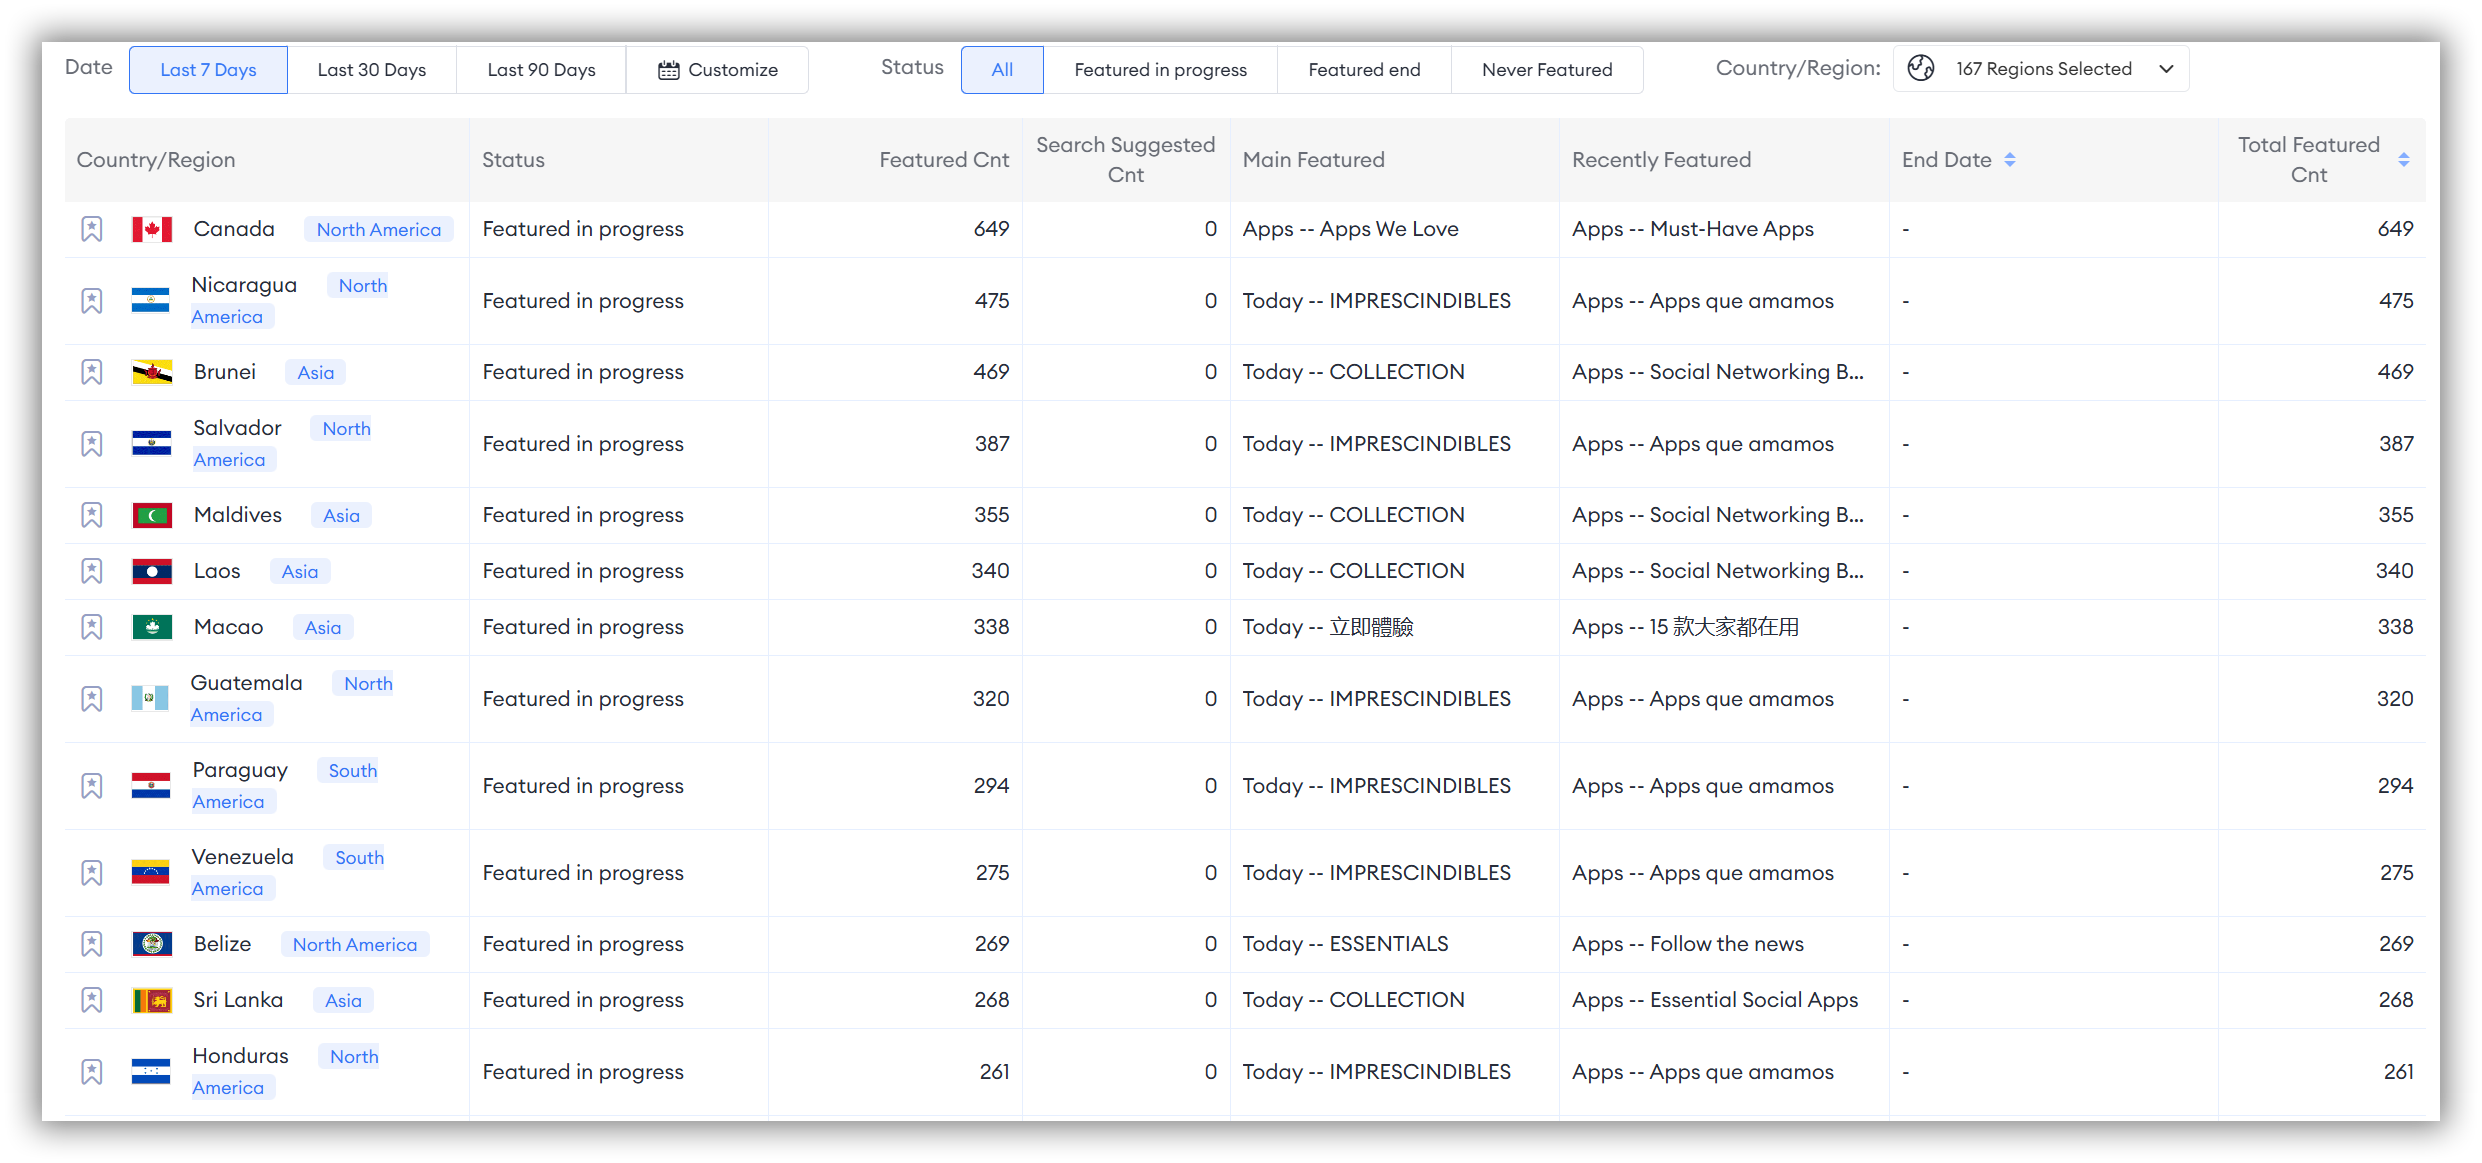
🗒️ Note: The "Country/Region" feature allows you to filter by all countries worldwide, with no limit on the number of selections.
What is the value of Global Overview?
From a market value perspective, the "Global Overview" feature of FoxData provides critical insights and strategic advantages that can significantly enhance an app's market position and valuation:
-
Holistic Global Insight: By aggregating global data on ASO keywords, revenue, downloads, and more, the feature provides a comprehensive view of an app's performance across different regions. This holistic insight is crucial for identifying global trends, understanding market dynamics, and making informed strategic decisions.
-
Strategic Market Positioning: The feature enables businesses to assess their competitive standing on a global scale through metrics like category ranking and featured history. This information helps in fine-tuning strategies to improve market position, optimize product offerings, and increase brand visibility internationally.
-
Optimized Global Marketing Strategies: By comparing the estimated revenue and estimated downloads across different regions, you can identify which markets have growth potential and develop corresponding market entry or expansion plans.
Insights into global ASA bidding keywords allow for the optimization of advertising campaigns across different regions. This targeted approach can lead to more effective marketing efforts, reduced customer acquisition costs, and improved return on investment. -
Enhanced User Satisfaction and Retention: Analyzing global ratings and reviews provides valuable feedback from users worldwide. Addressing this feedback can lead to improved user satisfaction, higher retention rates, and a more loyal customer base, all of which are critical for long-term success and market value.
-
Risk Management and Strategic Planning: The global status and app profile sections provide essential information for monitoring the app's lifecycle and anticipating potential challenges. This foresight aids in proactive risk management and strategic planning, ensuring the app remains competitive and adaptable in a rapidly changing global market.
In summary, the "Global Overview" feature of FoxData offers essential insights that support strategic decision-making, enhance global market presence, and ultimately increase the app's market value. By leveraging these insights, businesses can optimize their operations, attract investment, and achieve sustained growth on a global scale.
FAQs
Q: What is the main purpose of the "Global Overview" feature?
A: The main purpose of the "Global Overview" feature is to provide a comprehensive, data-driven analysis of an app's performance and market position across multiple dimensions. By leveraging these analytics, businesses can optimize their operations, attract investment, and achieve sustained growth on a global scale.


