

Explore More Possibilities for Your Business
Full-cycle scenario construction to meet your needs from App research, development, and release to operation.
Ready for your soaring growth
FoxData’s latest feature, Users Retention Analysis, provides app developers and marketers with powerful insights into user behavior, helping them understand retention trends, reduce churn, and optimize engagement strategies.
In today's competitive app market, acquiring a new user can cost anywhere from $3 to $10, whereas retaining existing users is significantly more cost-effective. Users Retention Analysis leverages retention metrics, AI-powered insights, and competitive benchmarking to help you make data-driven decisions for improving app engagement. This guide will help you effectively use FoxData's "Users Retention Analysis" to boost retention and optimize user experience.
FoxData’s "Users Retention Analysis" enables businesses to track and measure how well they retain users over different time frames. The feature helps marketers:
Unlike typical retention tools, FoxData allows you to analyze your app's retention and compare it with competitors, providing estimated retention data for industry benchmarking.
Step-by-step Guide to Access Retention Insights:
Interpreting the Data: What to Look For
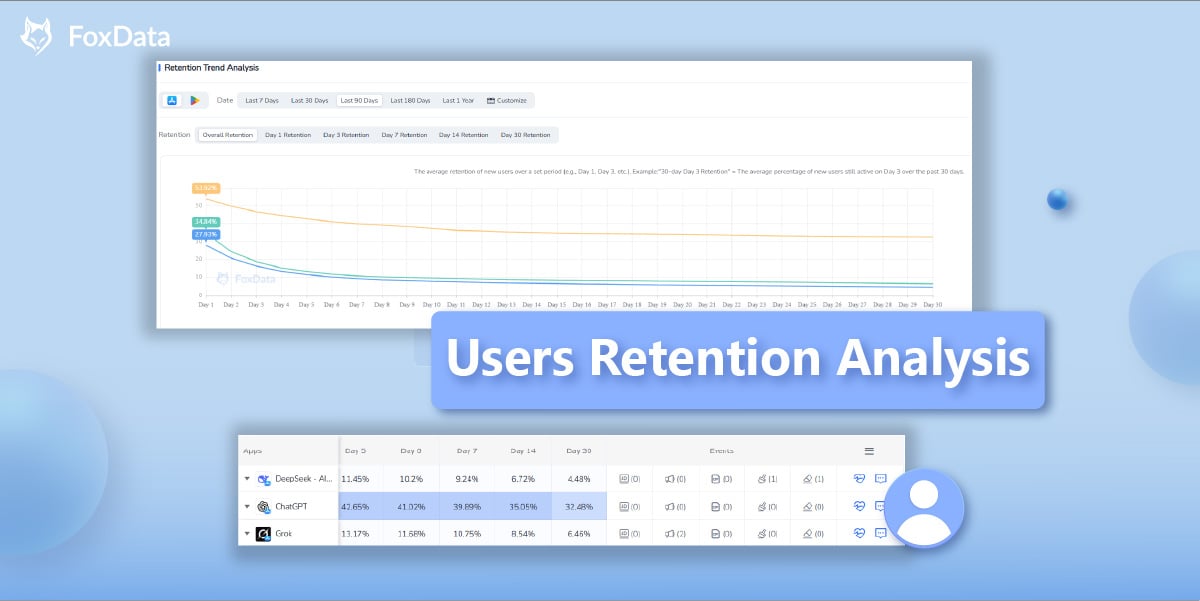
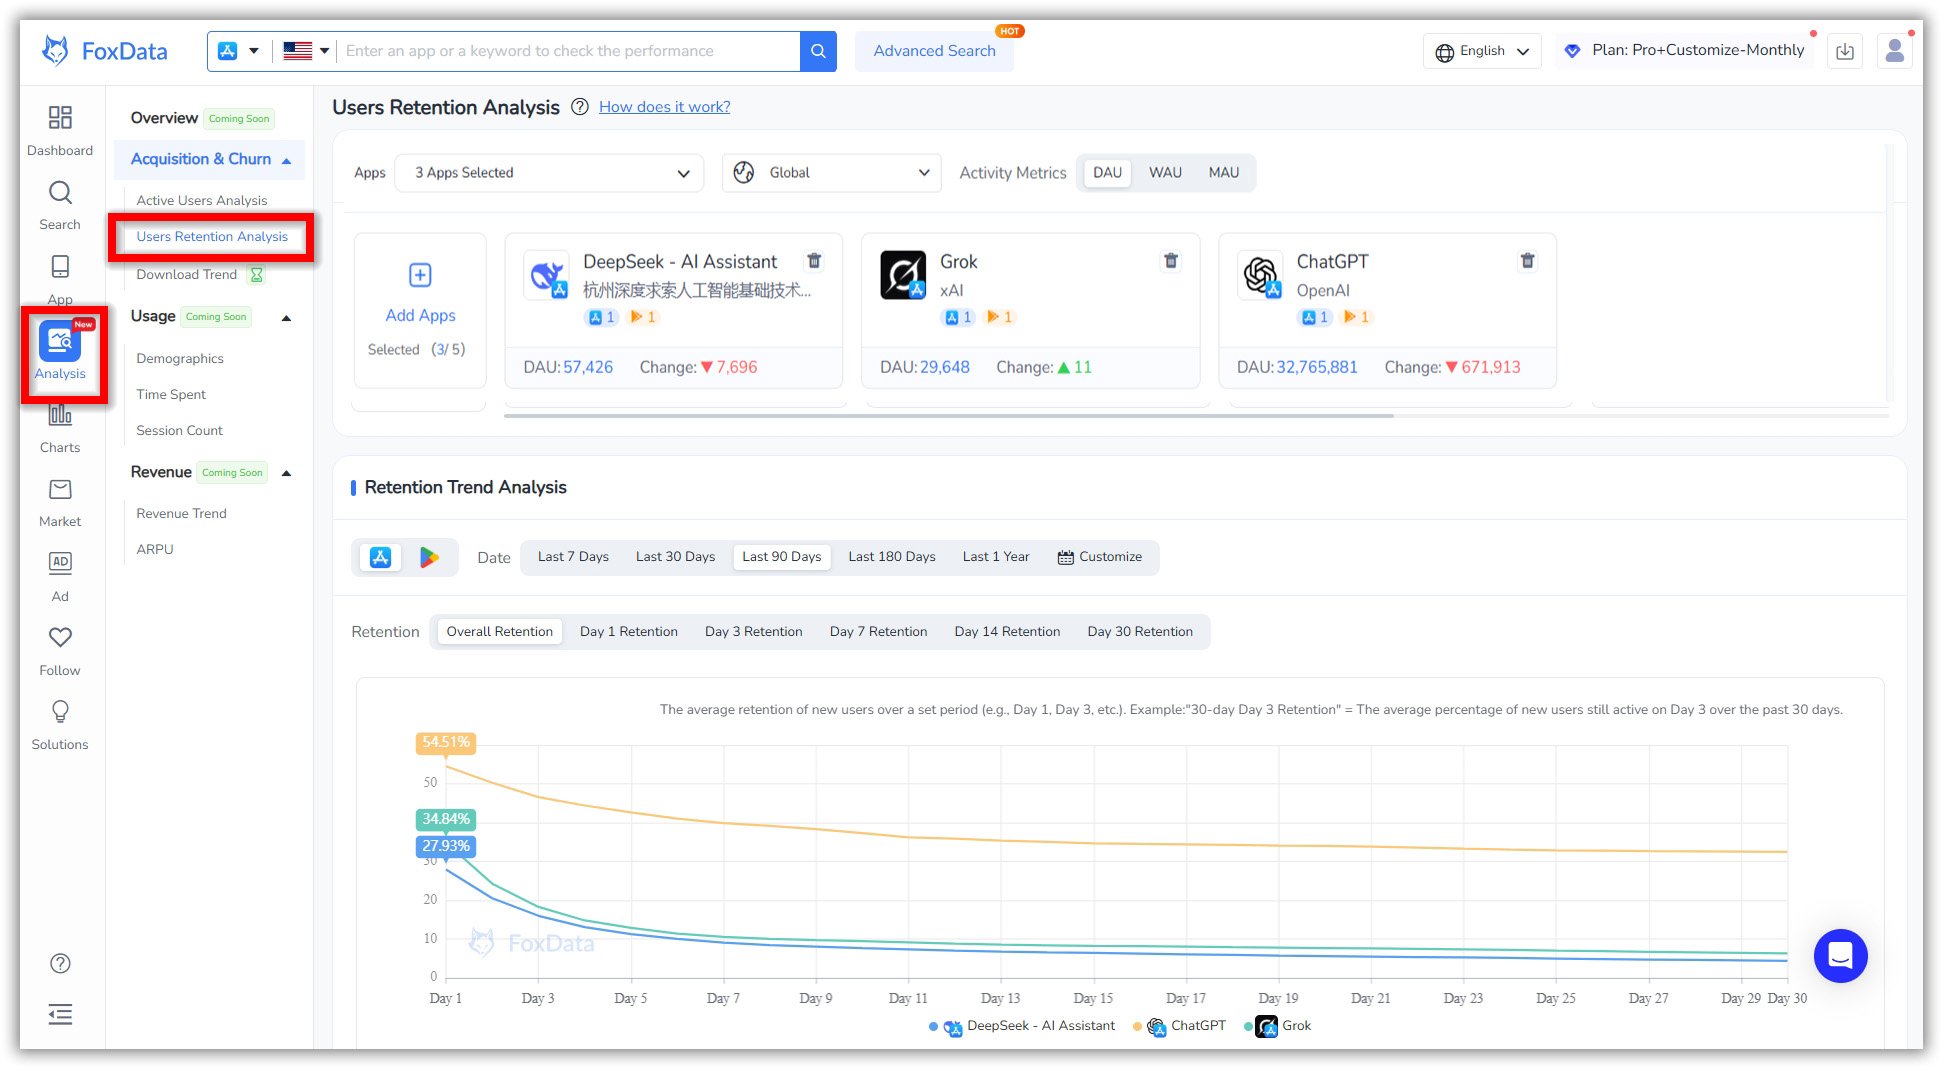
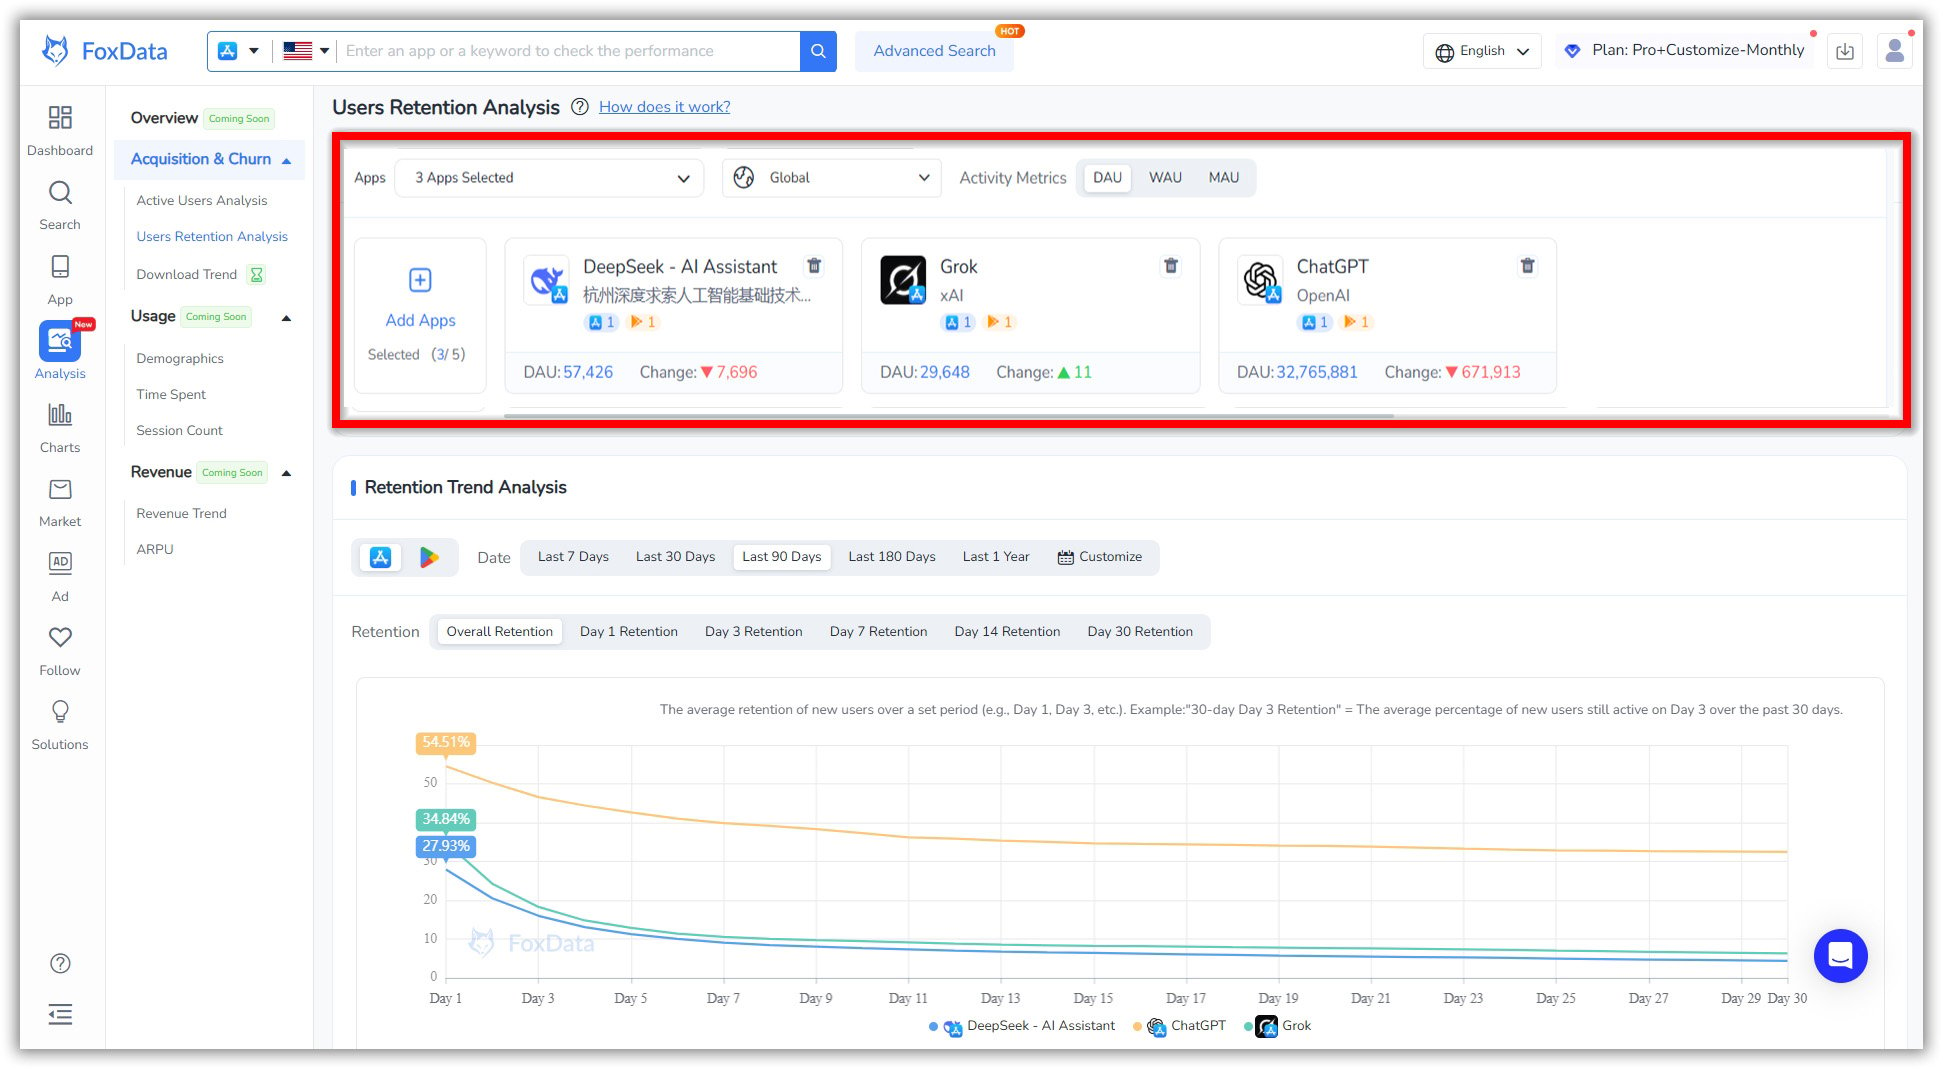
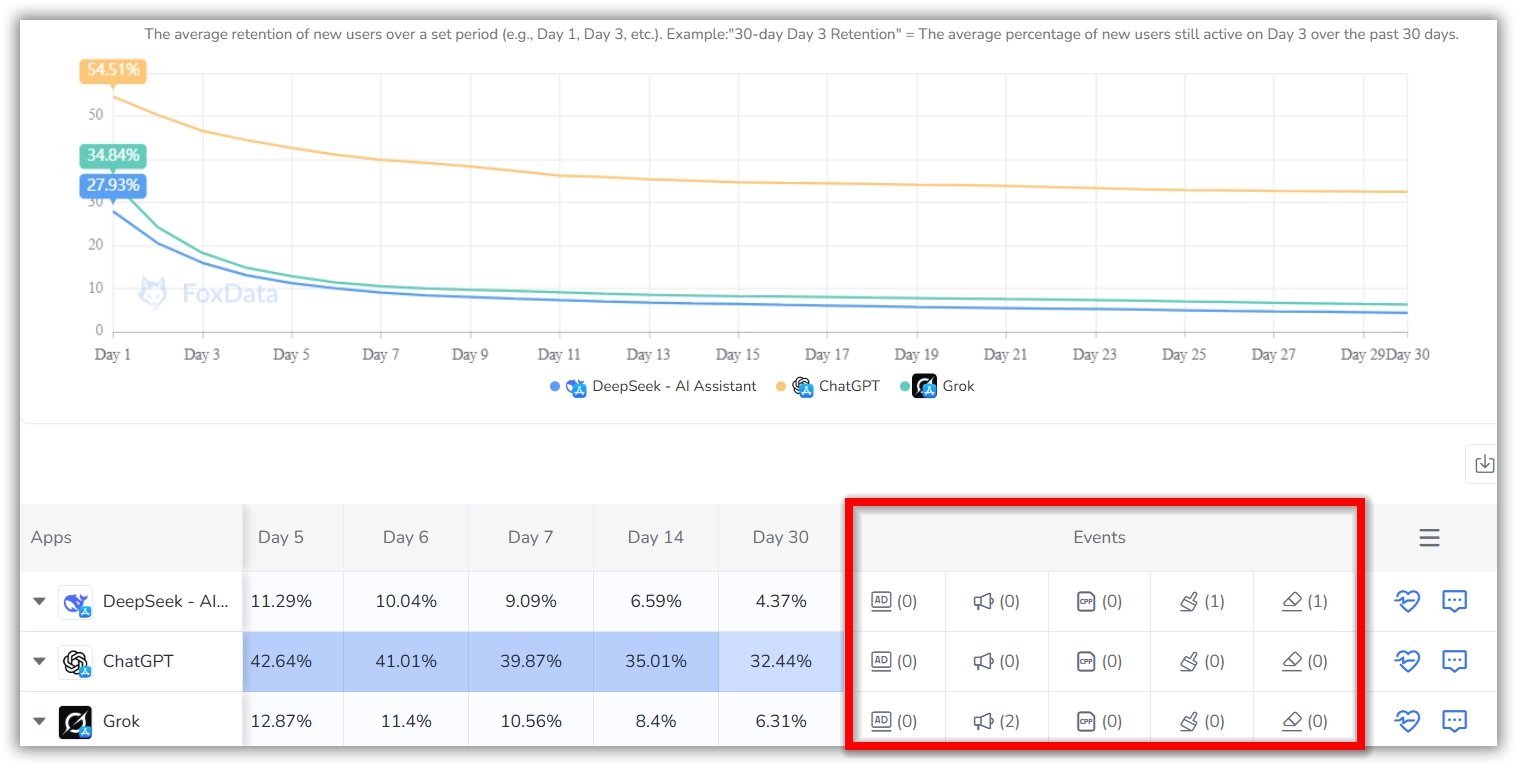
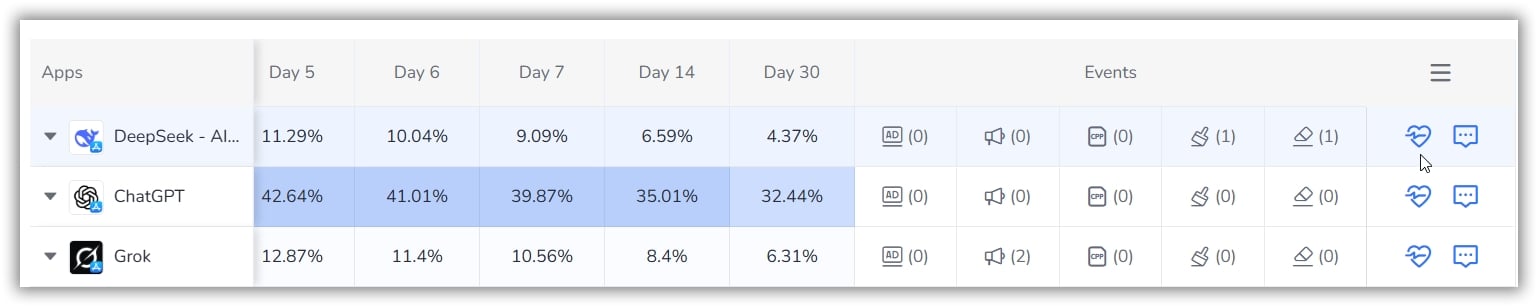
Users can filter and add competitor apps, along with specific countries, for comparative analysis. The top section presents selected applications in a scrollable card format. Each application includes some details such as its logo, name, publisher, and the number of associated apps available on the App Store and Google Play. Additionally, it shows the percentage of retention in Day 1, Day 7 and Day 30.
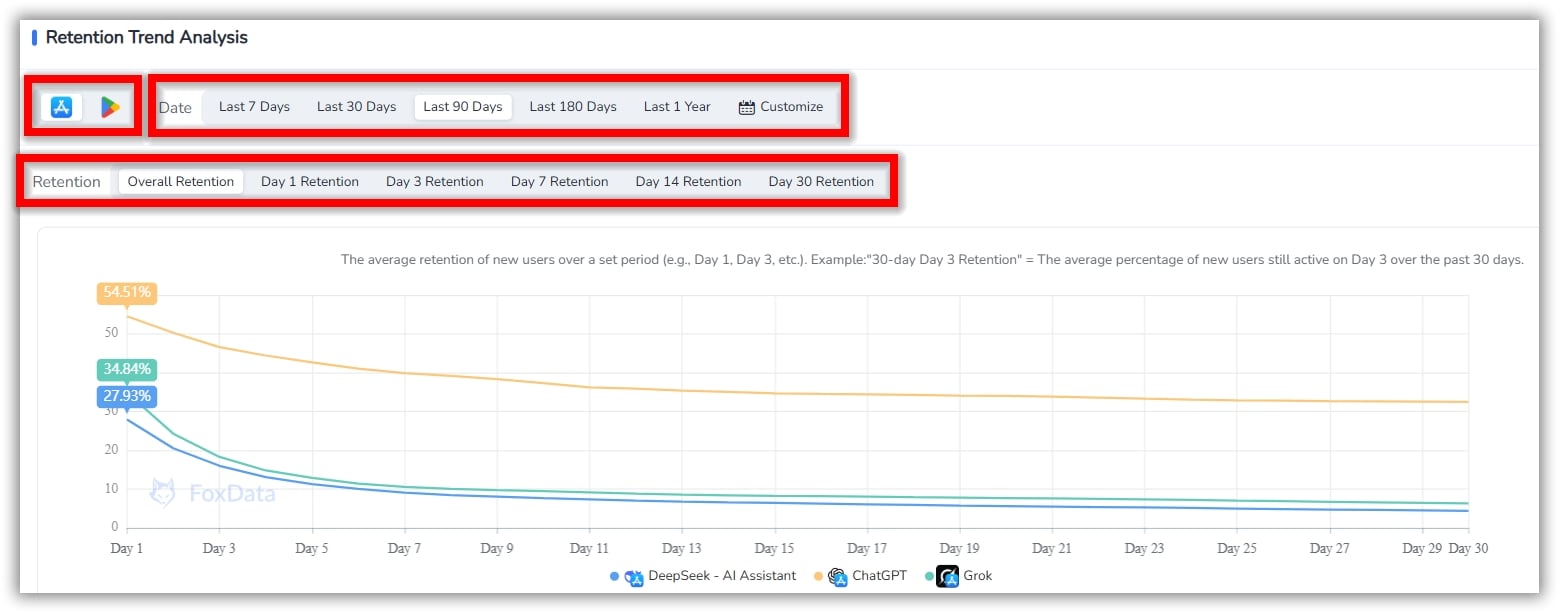
The retention trend chart provides a visual overview of user retention across multiple timeframes:
📒 Note: Example metric - "30-day Day 3 Retention" = The average percentage of new users still active on Day 3 over the past 30 days.
Understanding why users stay or leave is essential for optimizing engagement. This section highlights key events that correlate with retention changes, including:
Clicking on an event provides deeper insights into its impact, helping you make data-driven decisions to improve retention.
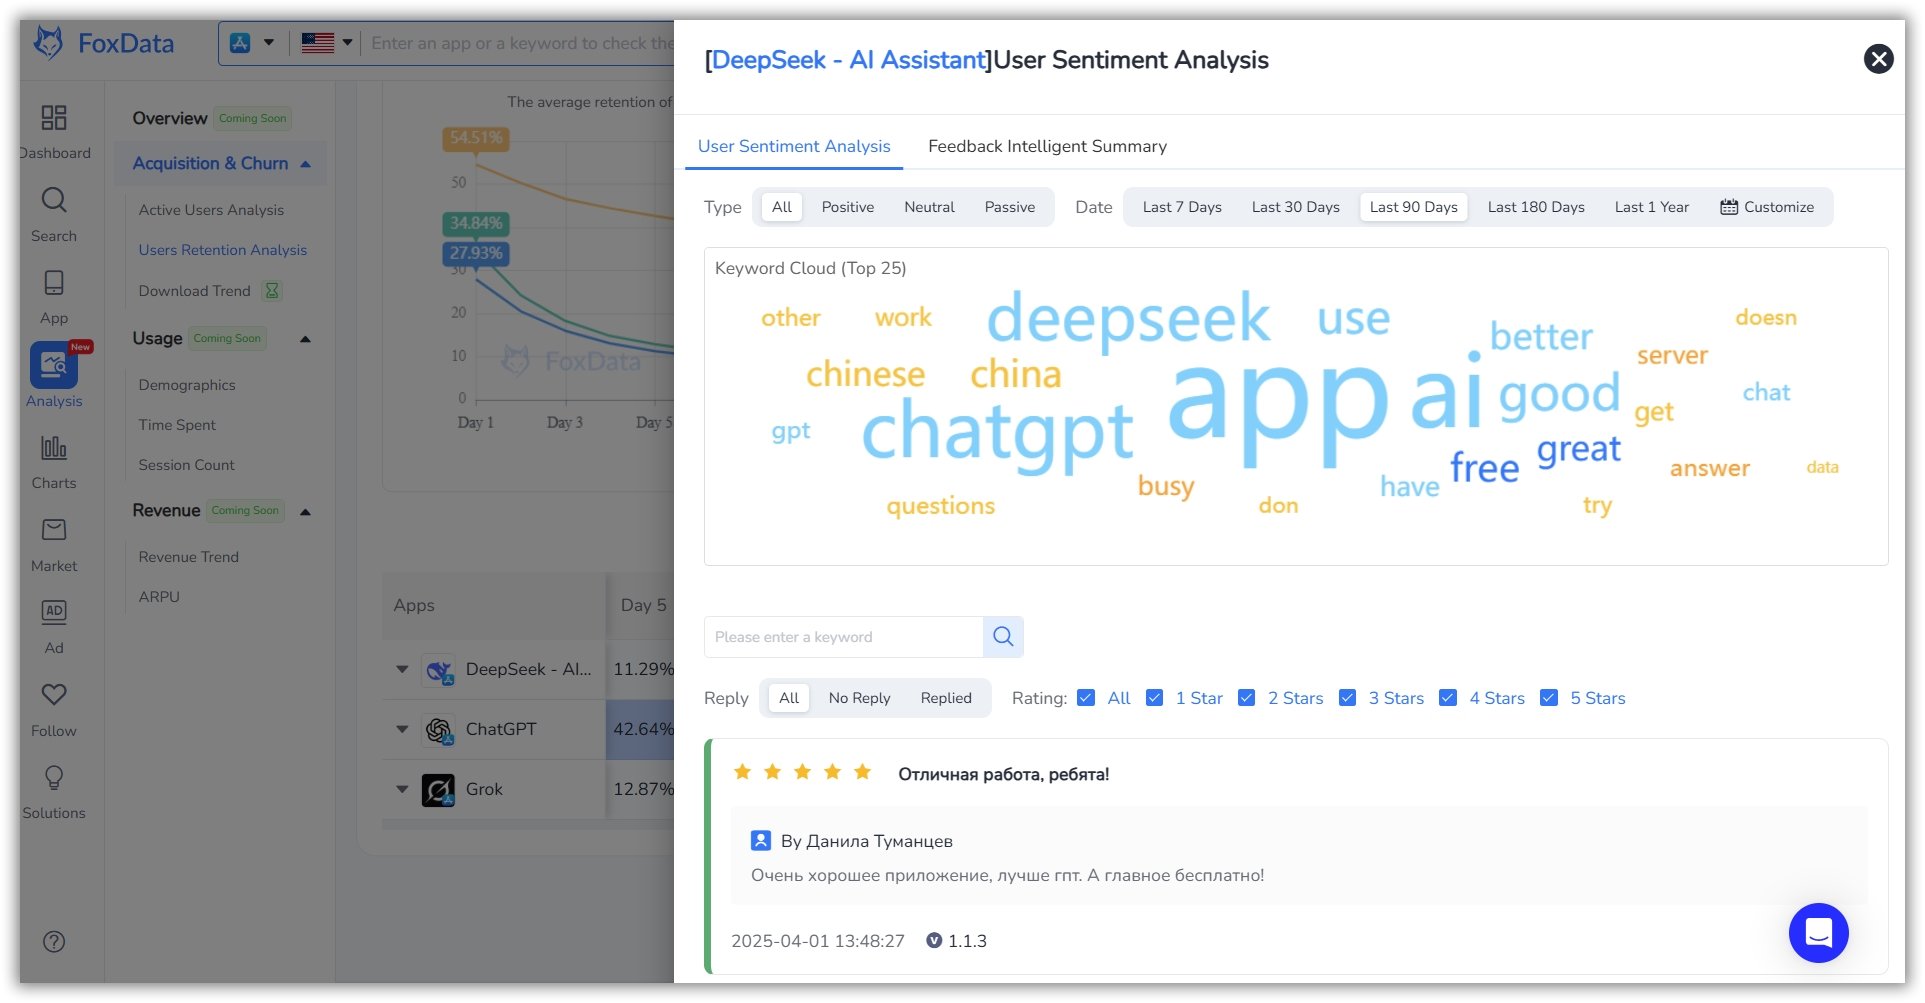
AI-powered user sentiment analysis helps you understand user feedback at a glance:
🔎 Find Out More: How Activity and App Retention Rates Can Benefit App Developers
Understanding retention trends helps you:
💲Learn More: Top Mobile App Monetization Strategies for 2025
A: By analyzing user engagement trends, you can identify and fix issues that lead to churn, ultimately improving user experience and retention rates.
A: Yes! You can filter retention data by demographics, acquisition channels, and in-app behaviors.
A: Yes, you can download reports in CSV or PDF format for deeper analysis and presentations.
A: Yes! FoxData allows you to benchmark your retention metrics against industry standards.
A: Yes, FoxData provides insights for both iOS and Android apps.
A: Yes, FoxData offers detailed tutorials and guides in the FoxData blogs or Help Center to help you maximize this feature.
Start leveraging Users Retention Analysis today to understand user behavior, reduce churn, and boost engagement. Sign up now!
© 2020-2026 FoxData. All Rights Reserved.
