
Explore More Possibilities for Your Business
Full-cycle scenario construction to meet your needs from App research, development, and release to operation.
Ready for your soaring growth

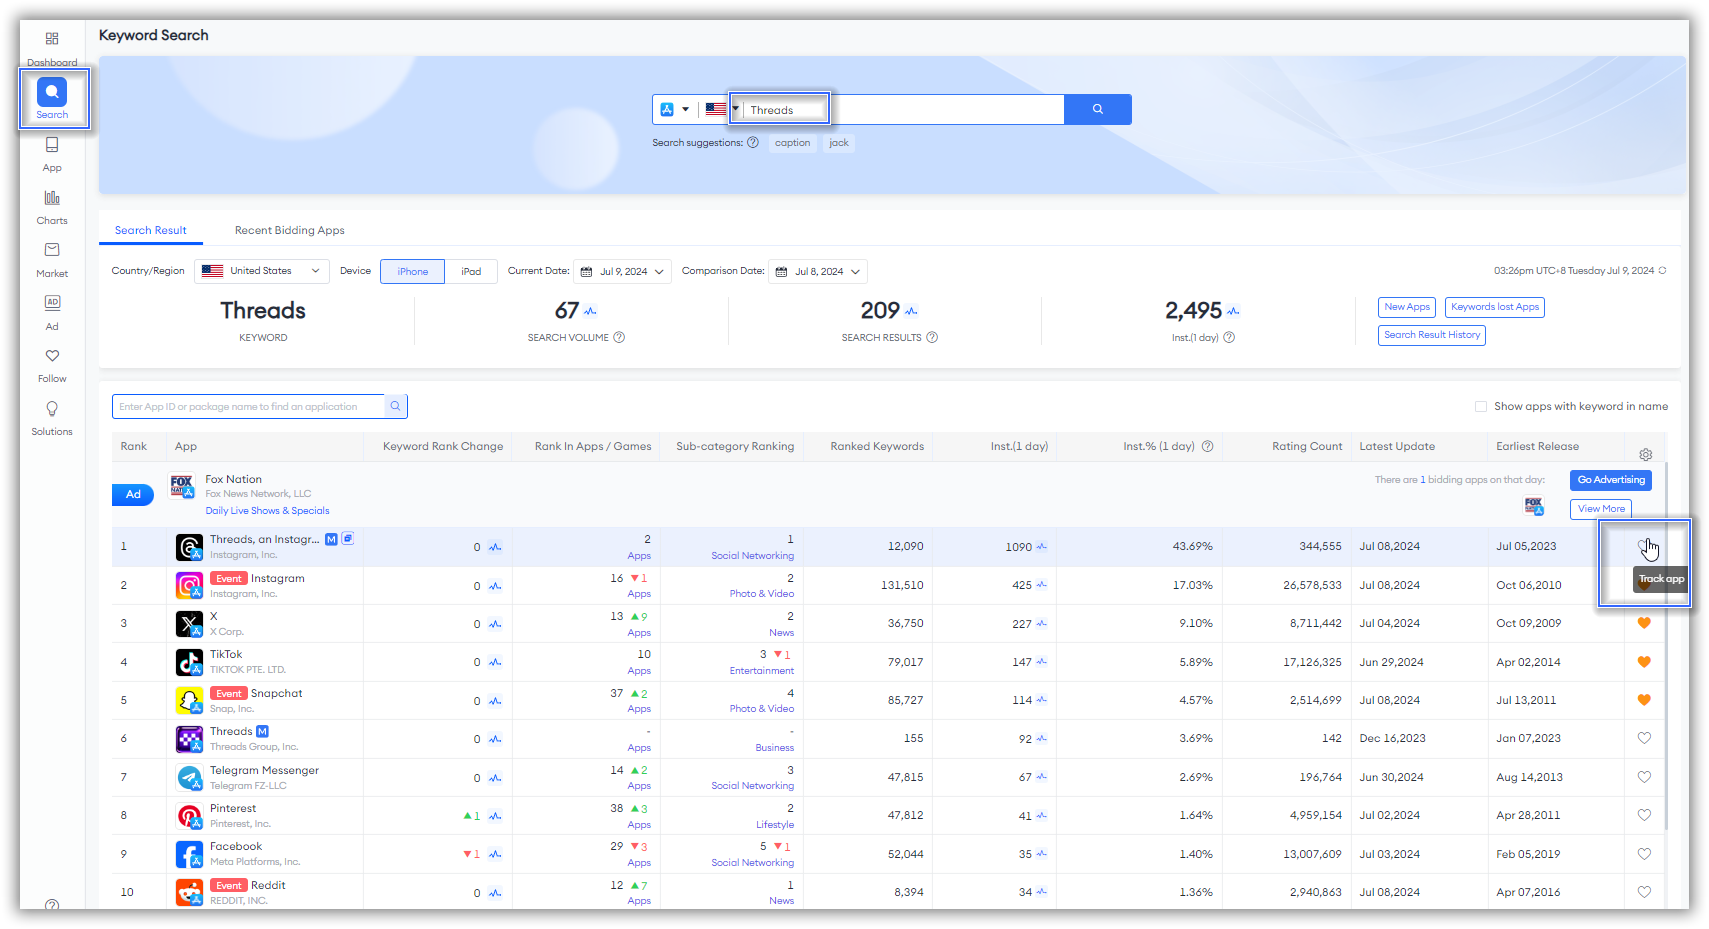
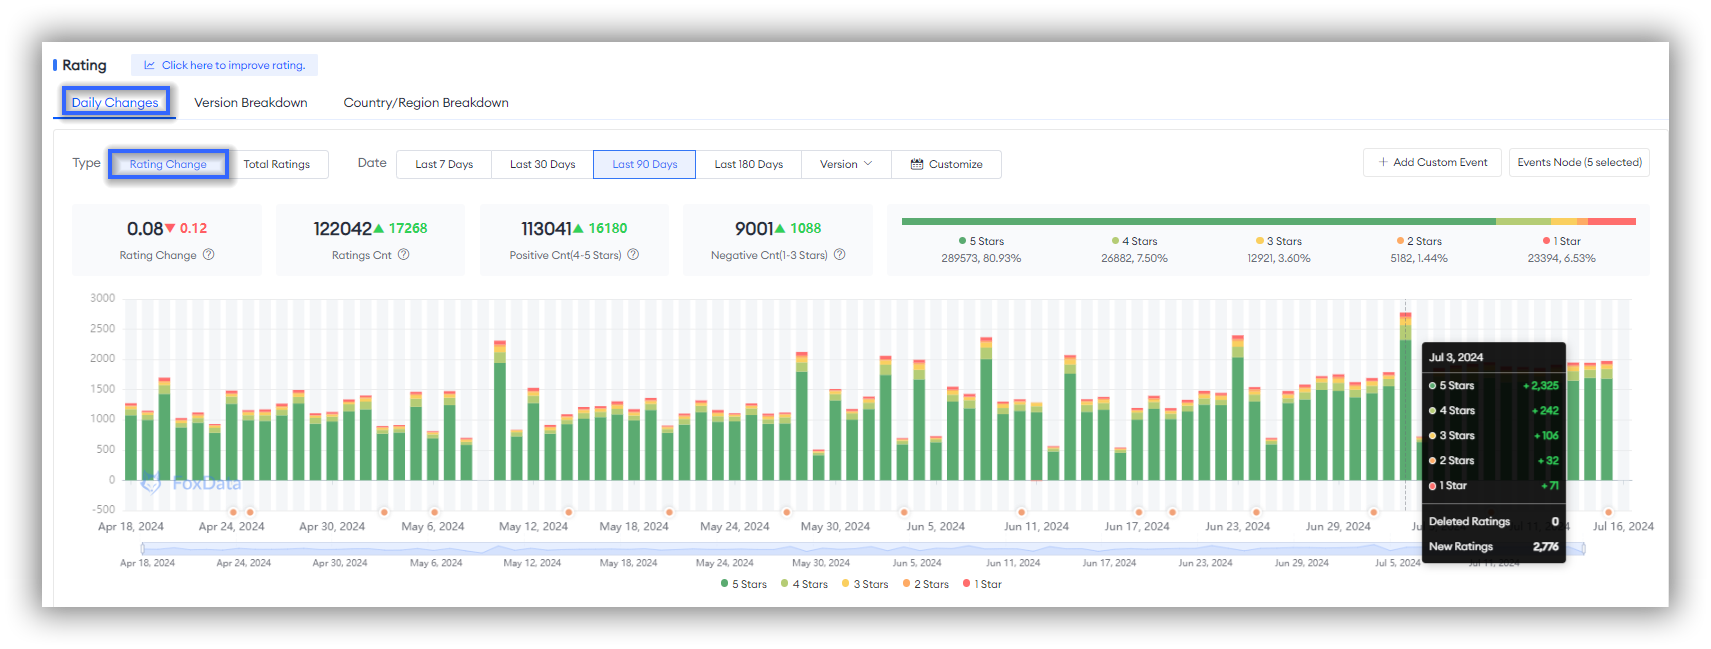
To view key Rating&Reviews metrics and insights:

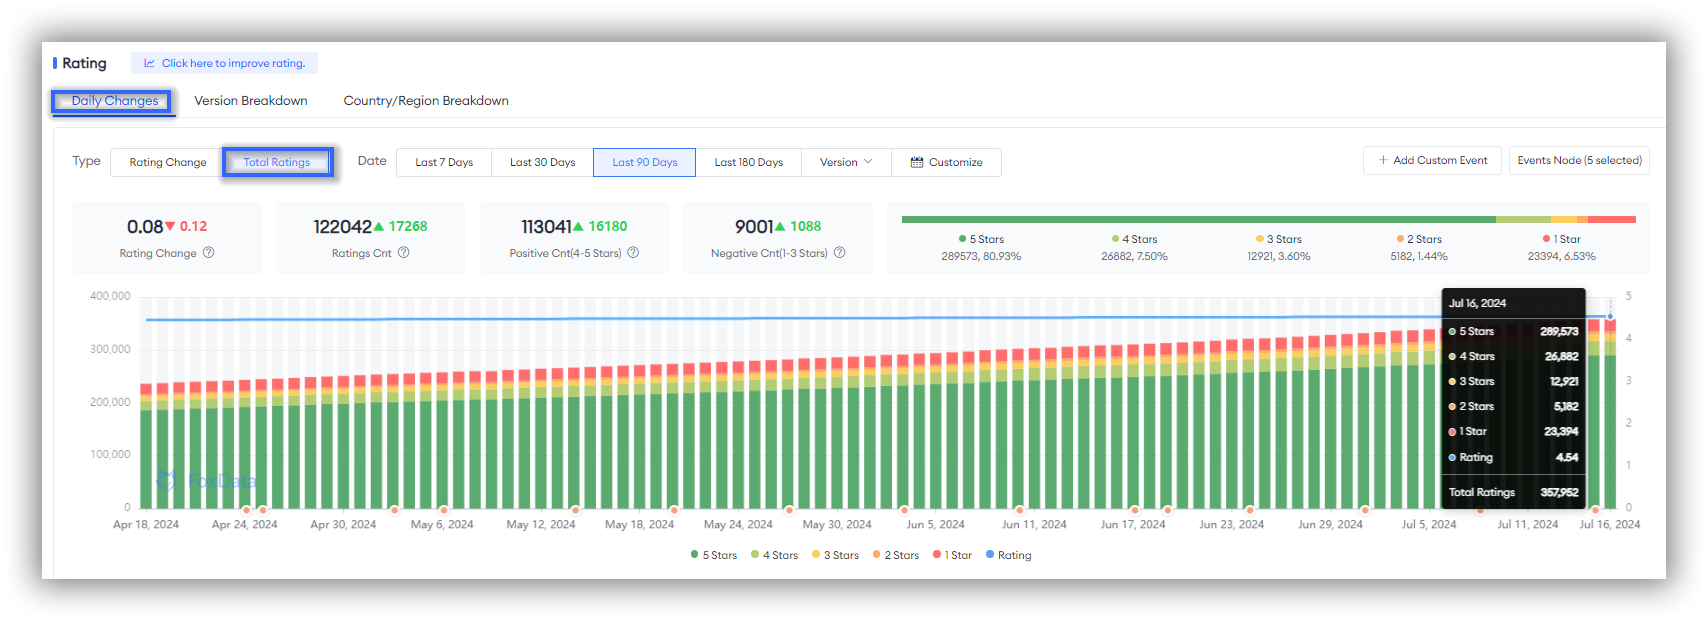
 🗒️ Note: When the time period you select is 90 days or longer, FoxData also supports dynamically and precisely capturing the time points you are interested in by sliding the light blue timeline located beneath the chart with your mouse.
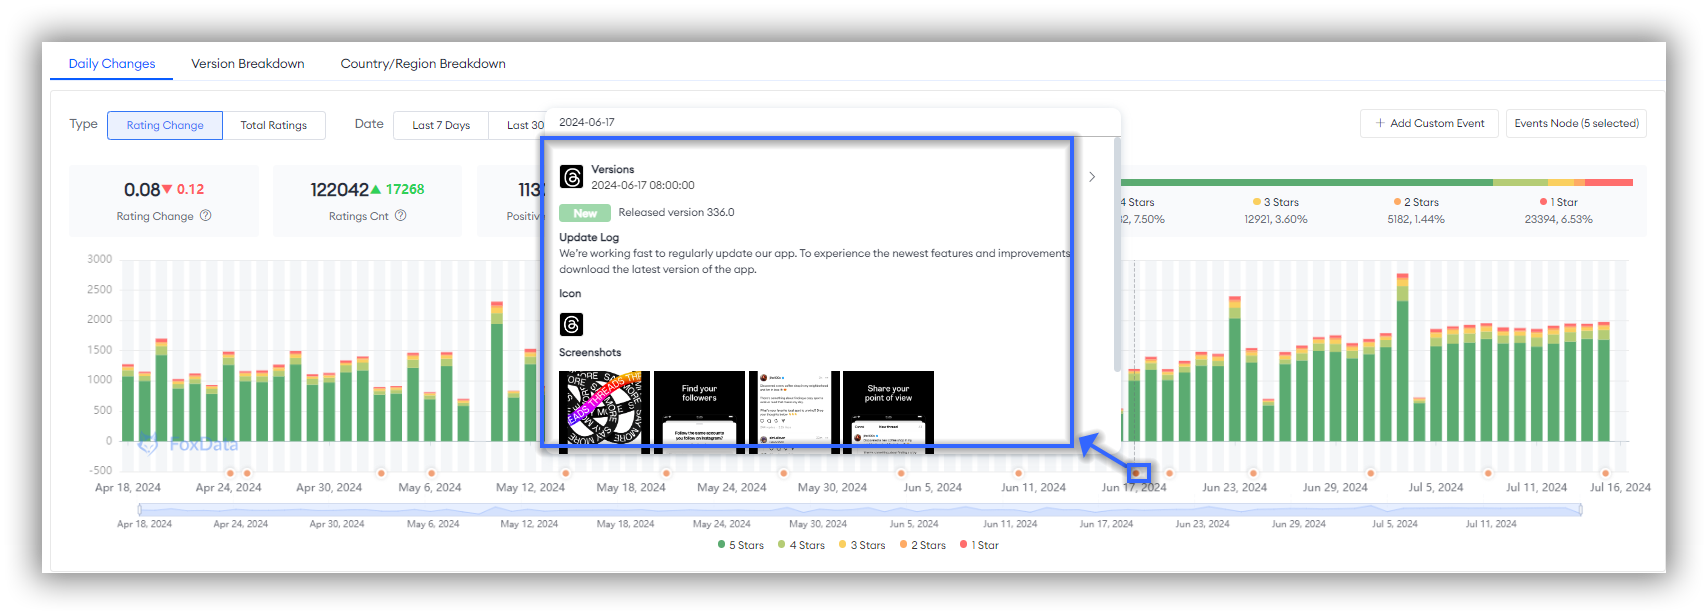
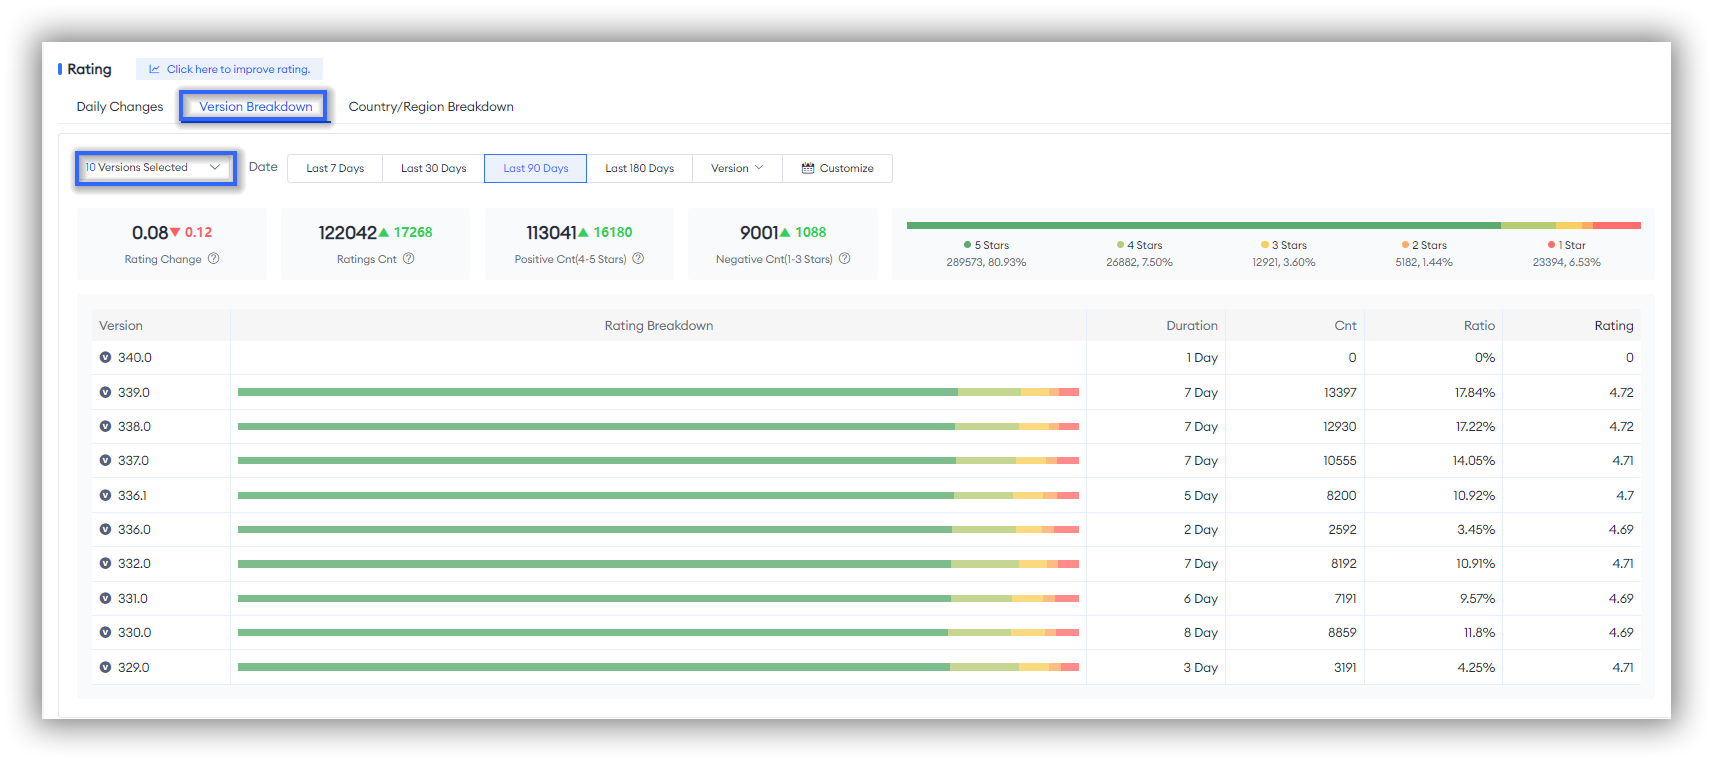 You can filter versions directly using the filter in the upper left corner, and you can even select up to 10 versions for comparison. This helps identify which versions have improved user satisfaction and which may have introduced new issues.
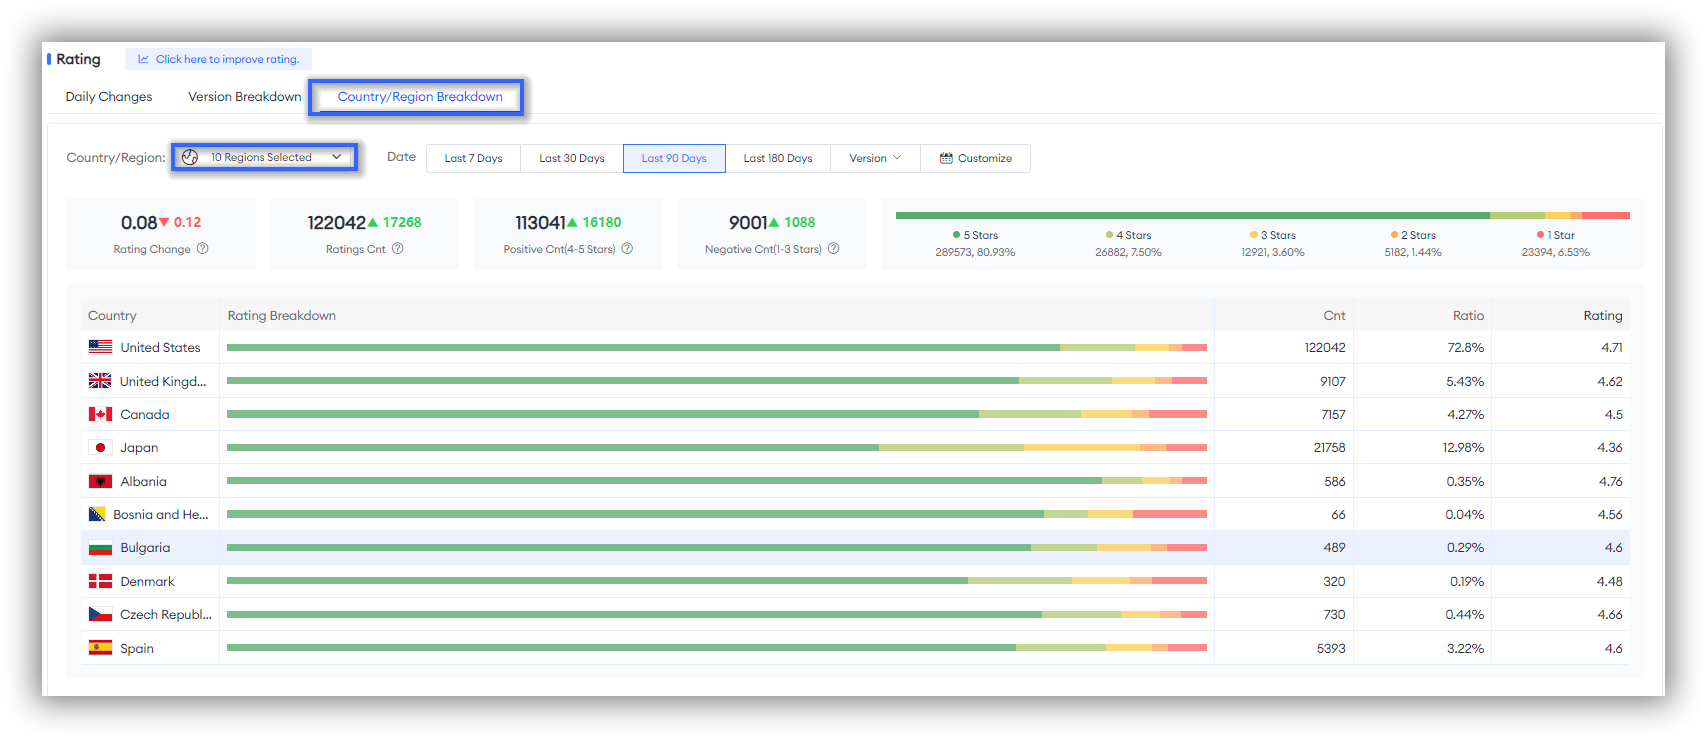 Click on the filter in the upper left corner, and you can choose up to 10 countries to compare rating data.
The data dimensions and specific usage of "Reviews" are essentially the same as those for "Ratings". You can monitor the three dimensions of Daily, Version, and Country/Region to track the performance of the app and adjust strategies accordingly.
🗒️ Note: However, it is important to pay special attention to the fact that we have customized different data dimensions in this section based on the definitions and characteristics of Reviews and Ratings.
The two data points that differ from the Ratings feature are:
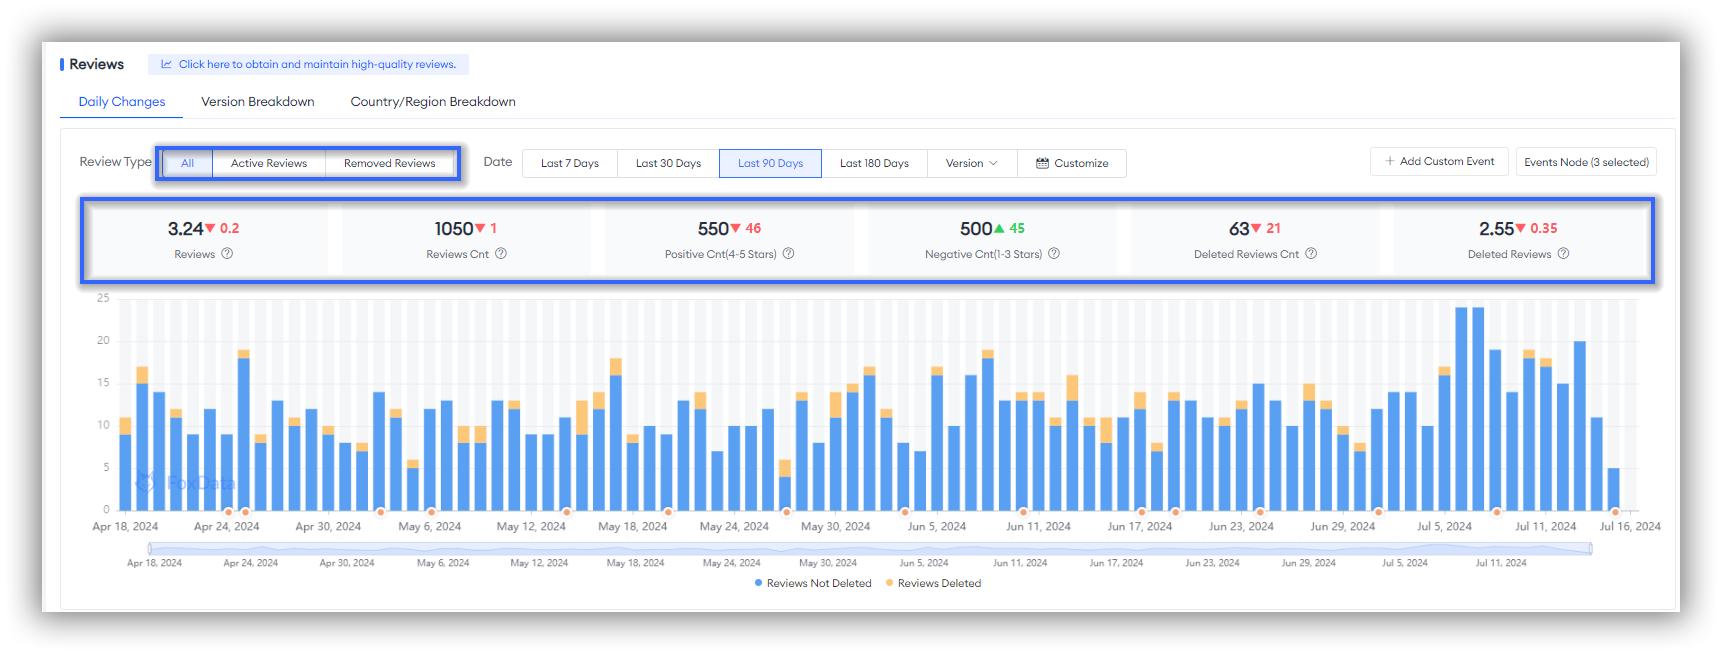
Monitoring the trend of Active Reviews in real-time can help developers quickly identify the timing of unusual trends and pinpoint specific comments. This enables developers to rapidly understand user feedback on the app and address issues promptly.
Monitoring the trend of removed reviews can help developers quickly identify periods when a large number of negative feedback or fake reviews are removed, allowing for swift improvements to the app. Additionally, by comparing the removal of reviews across different apps, developers and researchers can also gain insights into how competitors manage user feedback and user satisfaction.
A comprehensive analysis of all new review trends provides a complete view of user feedback, assisting developers and market researchers in staying up-to-date with changes in user needs and sentiments.
Expert Tips:
If you want to reply to reviews, simply go to the Follow-Connect-Reply to Reviews section. Connect your console and reply to reviews directly on FoxData, eliminating the hassle of navigating multiple platforms.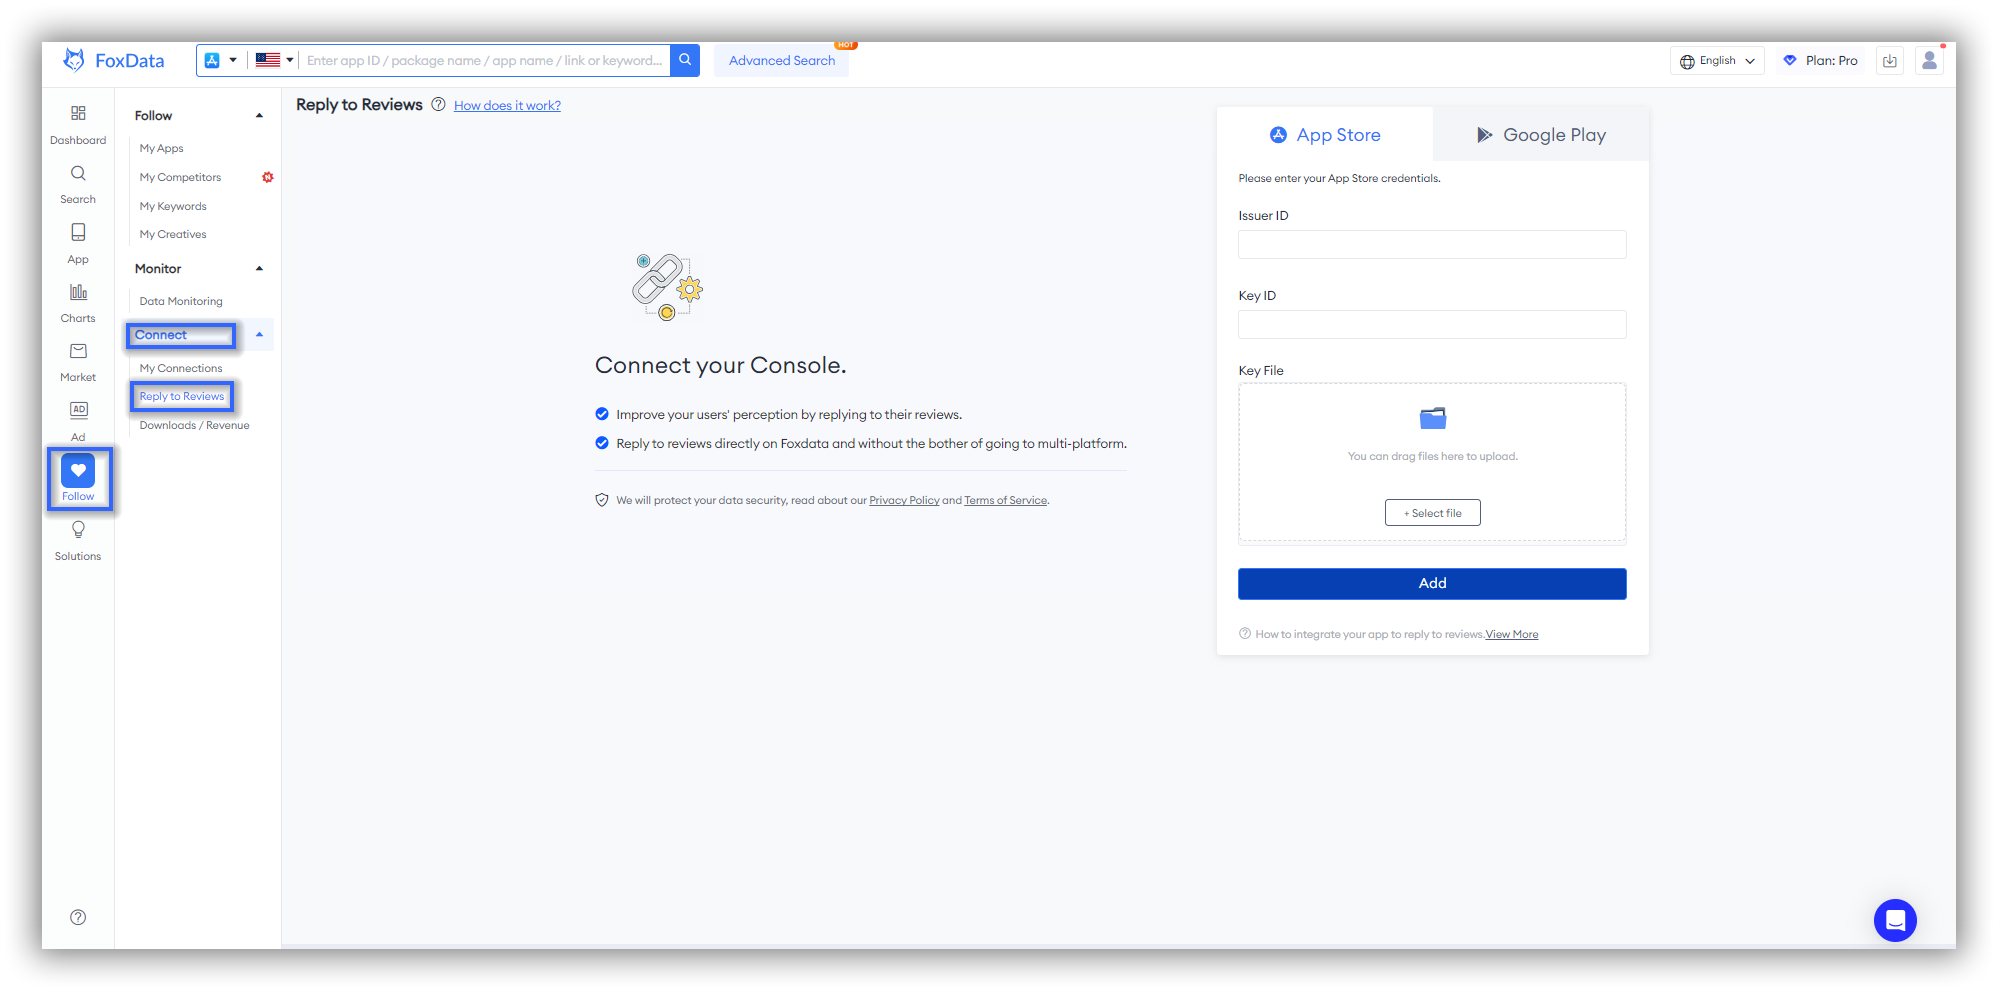
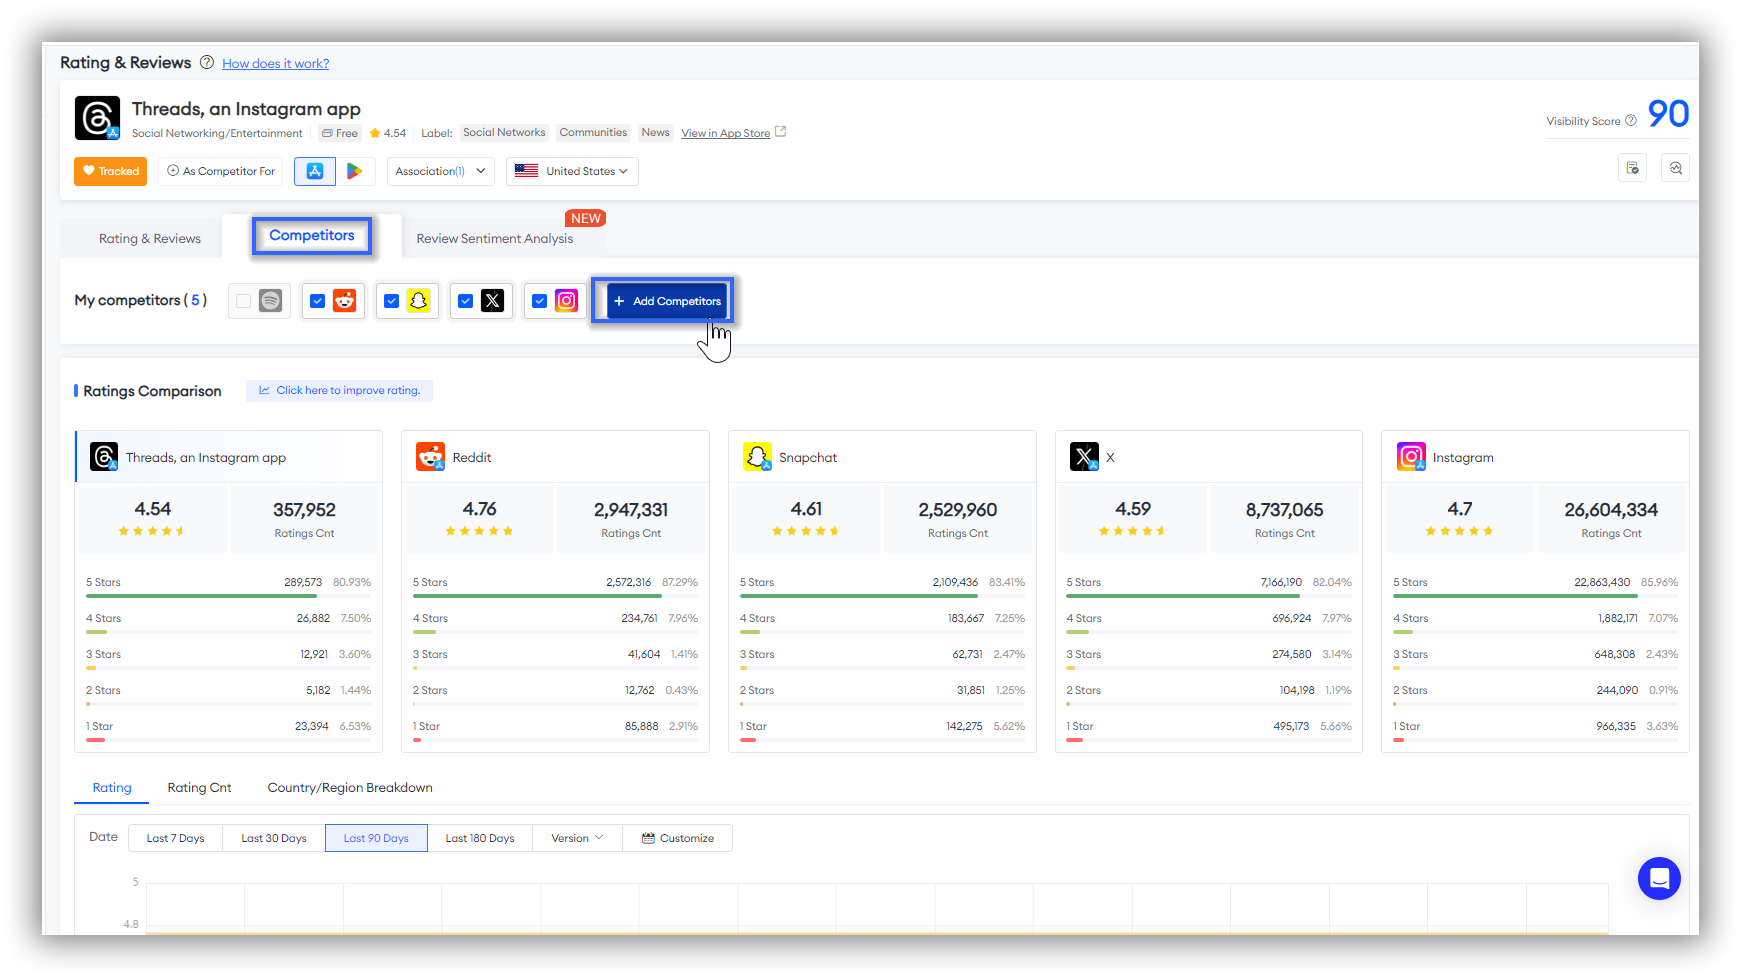
First, you get an overview of competitors' rating data, which helps you quickly assess their market positioning and popularity.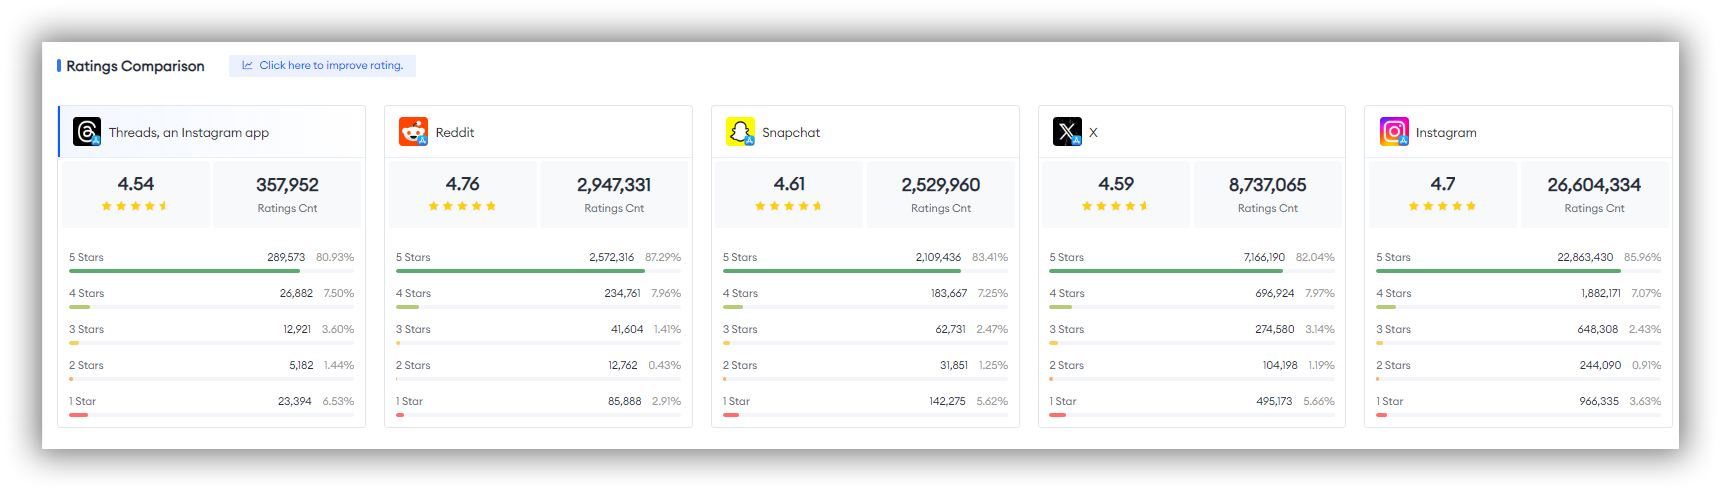 After understanding the basic rating situation of the competitors, FoxData allows you to compare competitors' Rating, Rating Count, and Country/Region Breakdown.
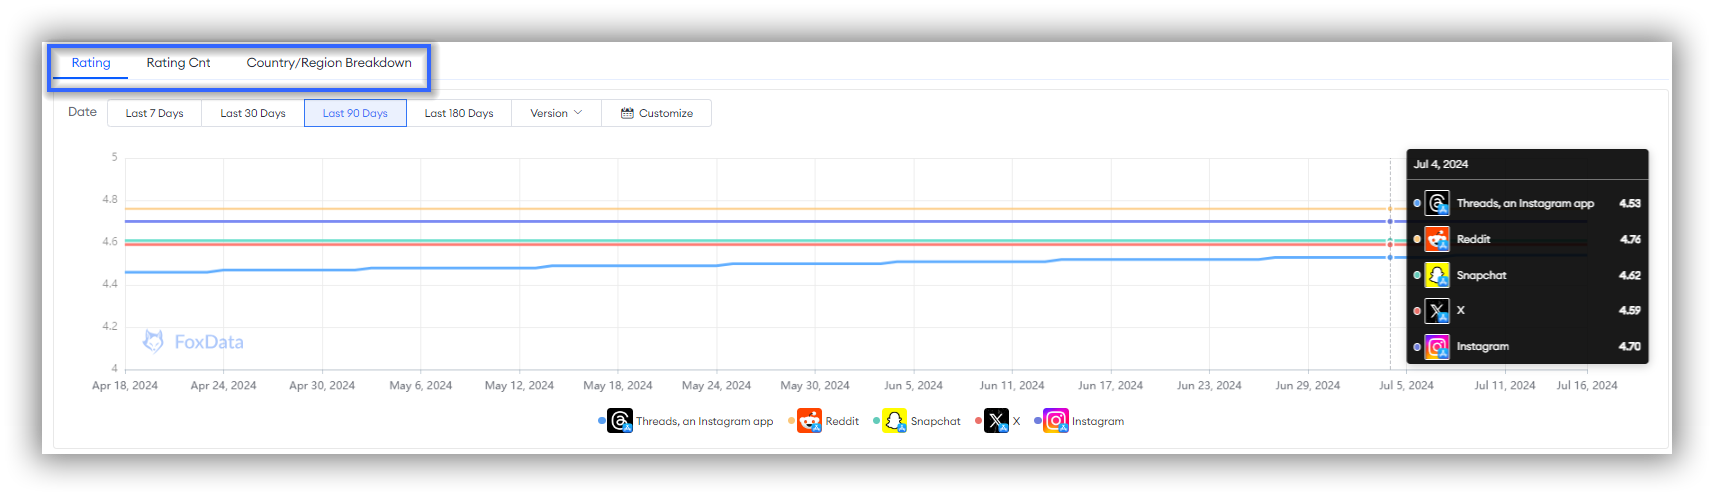
🗒️ Note: We support filtering by date and version across these three dimensions. Additionally, the Country/Region Breakdown dimension allows you to select up to 10 countries to compare rating data, assisting you in evaluating the market value of competitors in different countries.
The "Reviews Comparison" feature is similar to "Ratings Comparison" in terms of data dimensions and usage. You can analyze competitors' data through an overview of comparisons, including Rating with New Reviews, Count, and Country/Region Breakdown.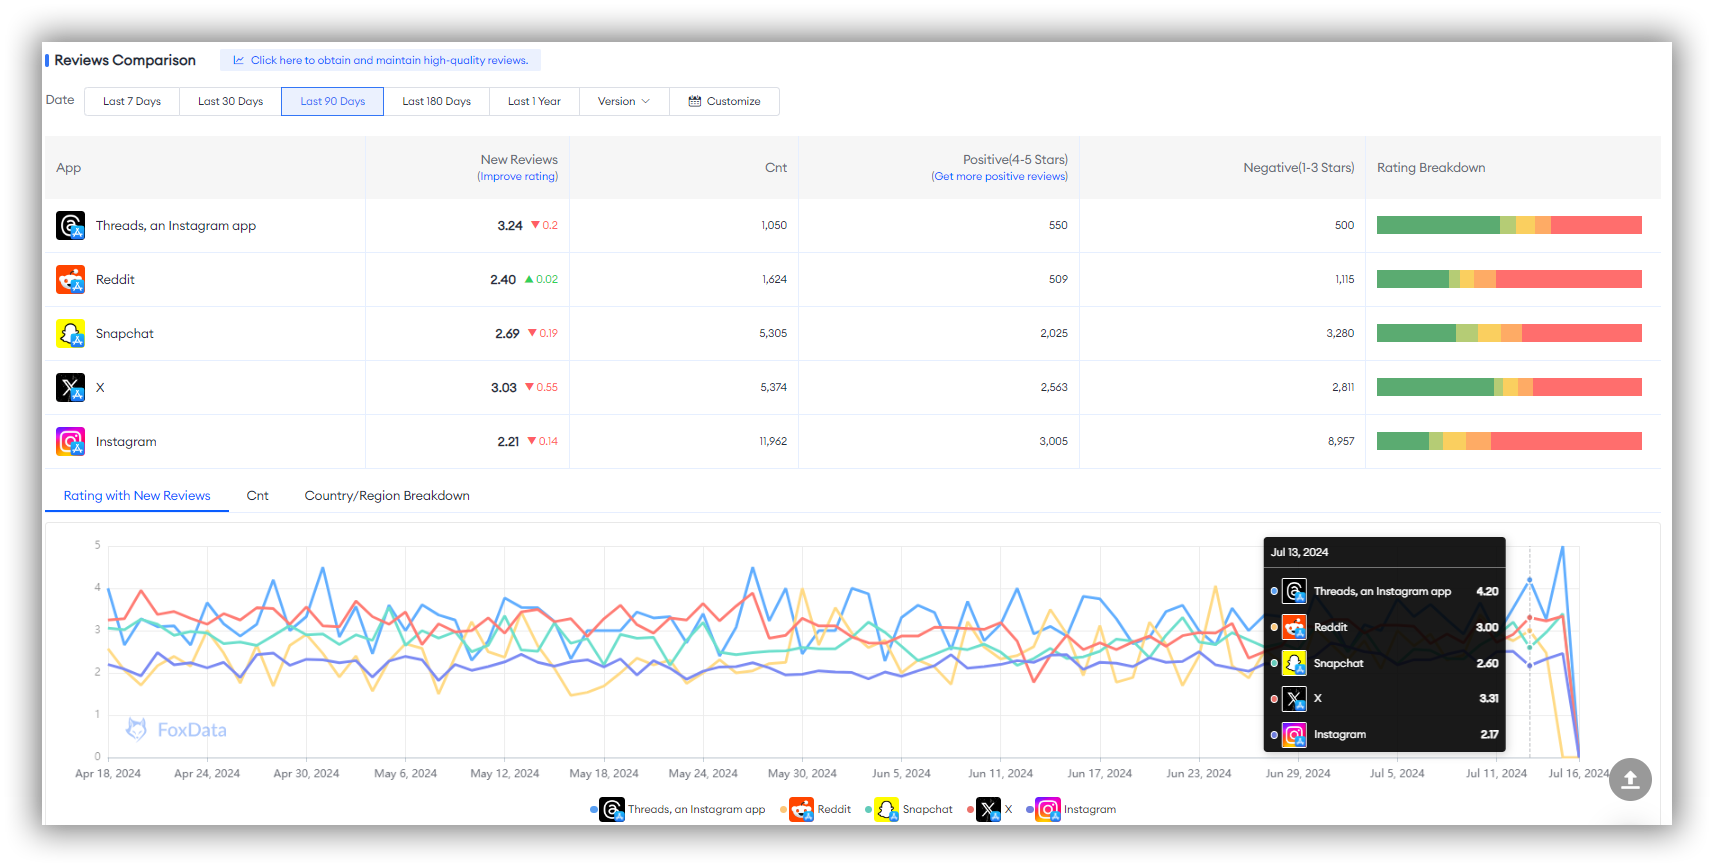
🗒️ Note: It is important to note that while all comparison dimensions in Ratings Comparison pertain to total ratings, all comparison dimensions in Reviews Comparison pertain to new reviews.
Review Sentiment Analysis is a method that determines the emotional inclination expressed in reviews by analyzing and evaluating their content.
It uses natural language processing techniques and algorithms to process the text and recognize the sentiment, determining whether the review is positive, negative, or neutral.
This helps understand users' emotional attitudes towards an app or game, aiding developers in better understanding user needs, improving products or services, and making appropriate responses.
This feature is mainly divided into three sections: "Rating & Reviews Overview", "Keywords Cloud", and "Details of Keywords".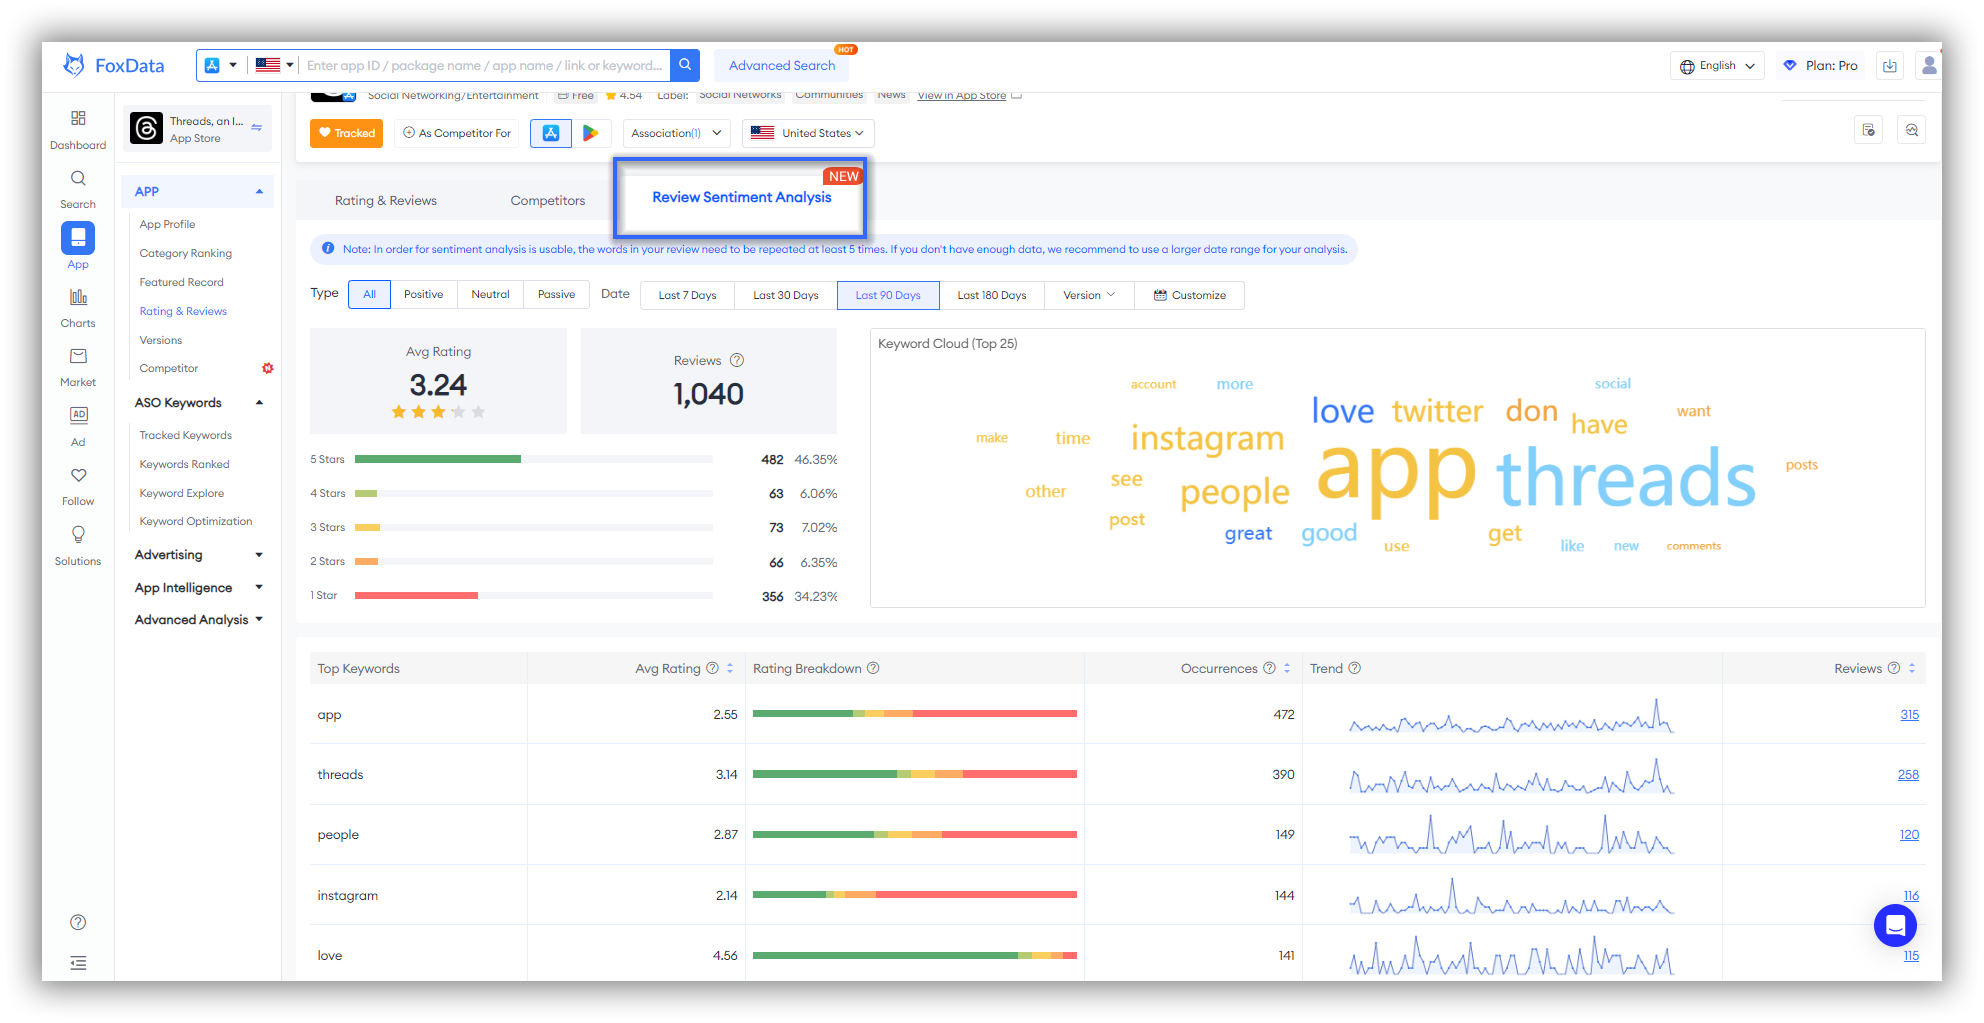
🗒️ Notes: These three sections are interconnected. Don't forget to select specific Type and Date in the filters to locate the data you are interested in across these sections.
Beyond that, In order for sentiment analysis is usable, the words in your review need to be repeated at least 5 times. If you don't have enough data, we recommend to use a larger date range for your analysis.
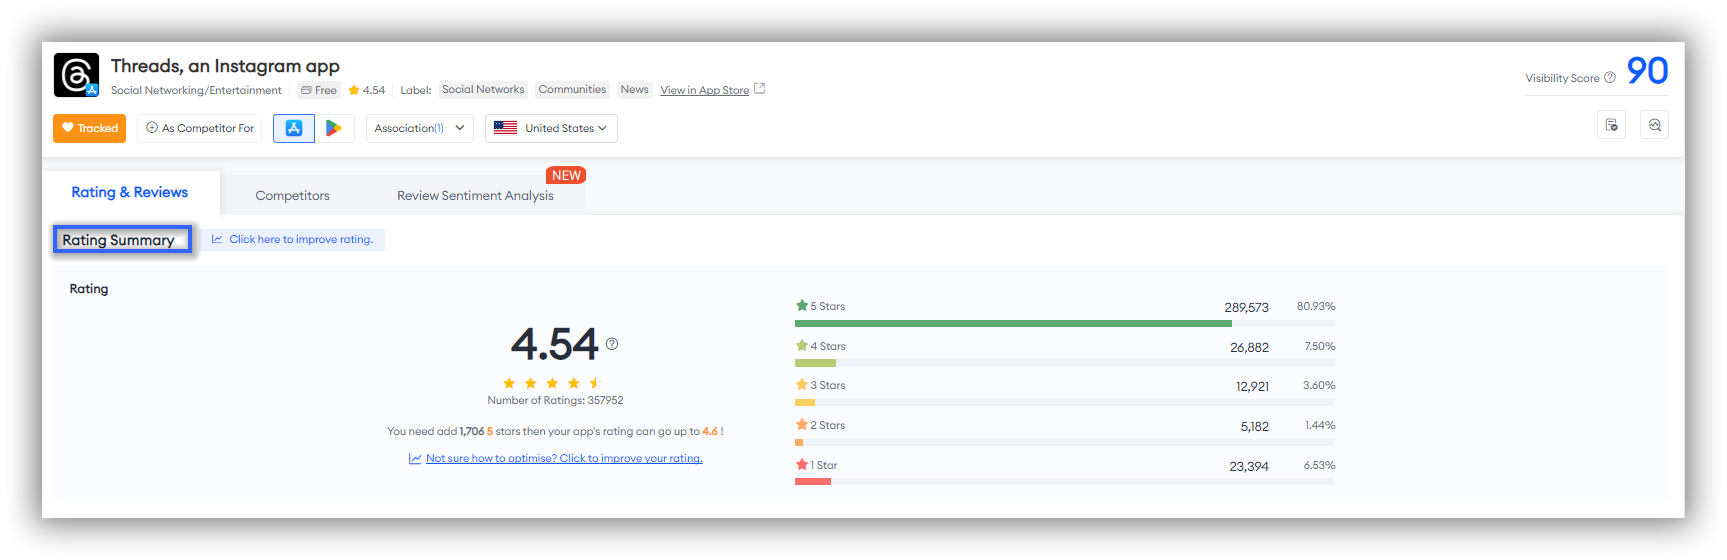
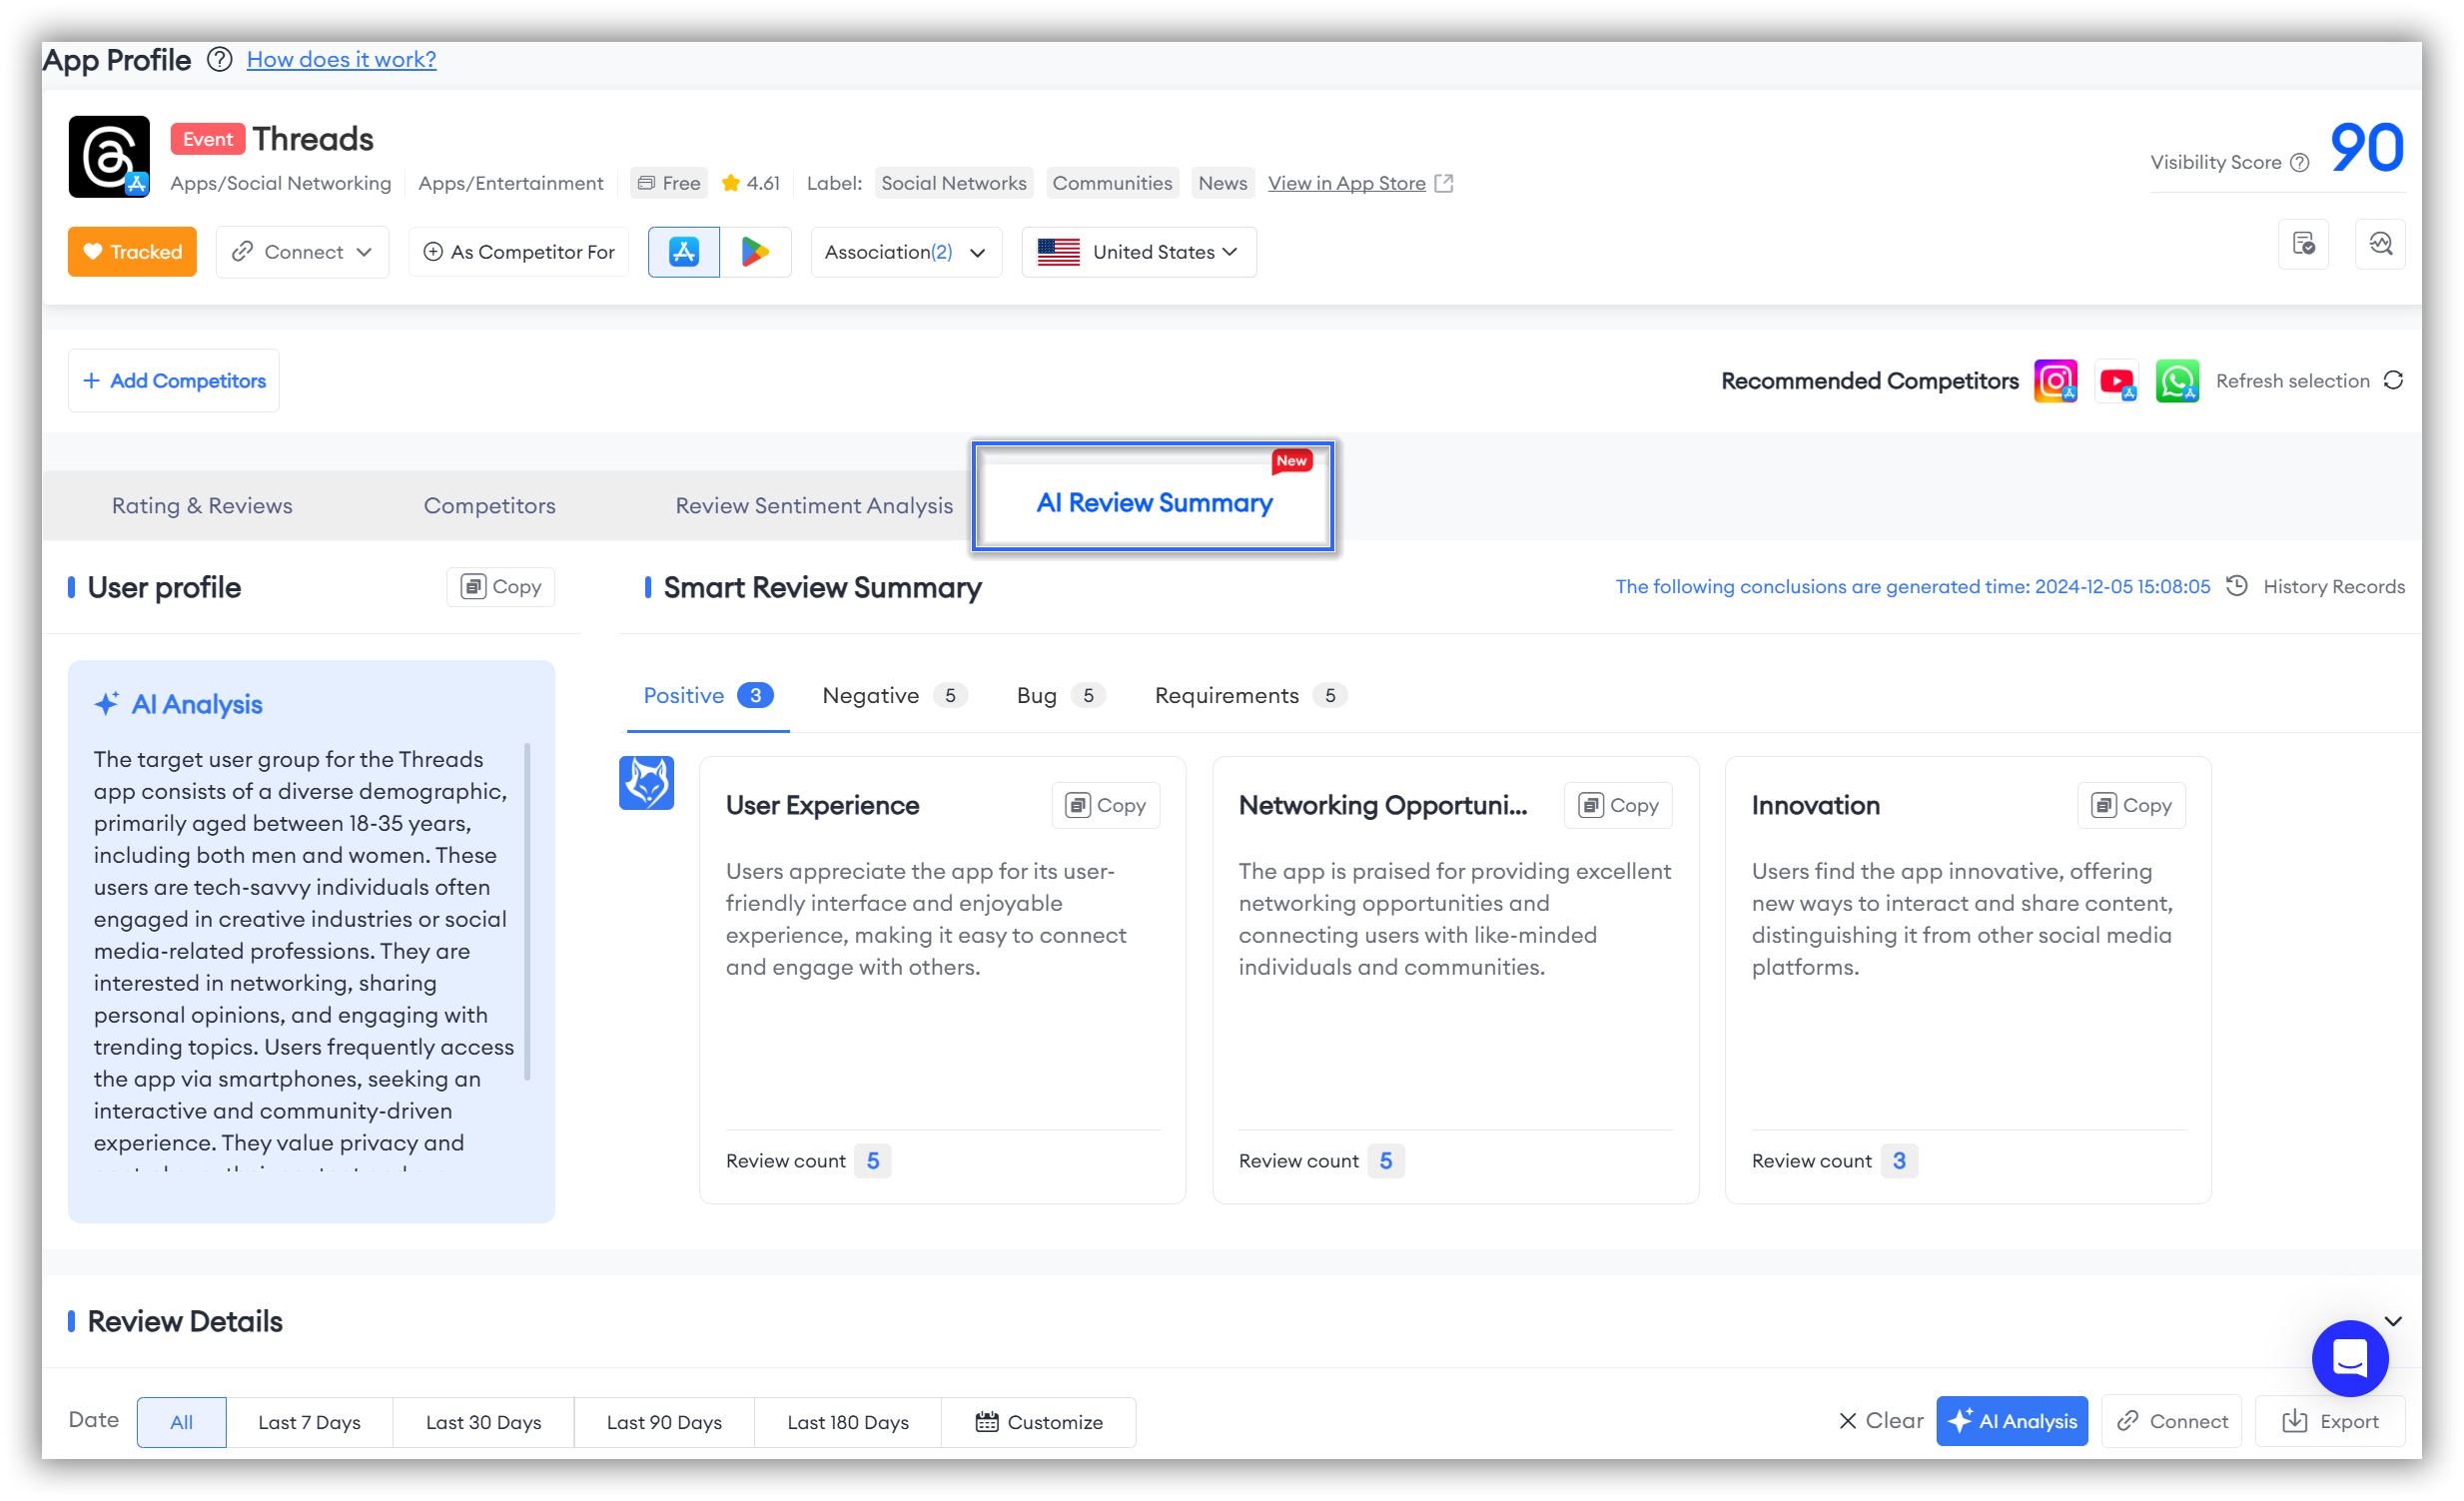
In the top left corner, you'll find the "Rating & Reviews Overview". After you filter for the desired type and time period, this section will provide the app's average rating, reviews, and star distribution for that specific period and type. This foundational data supports your subsequent analysis.
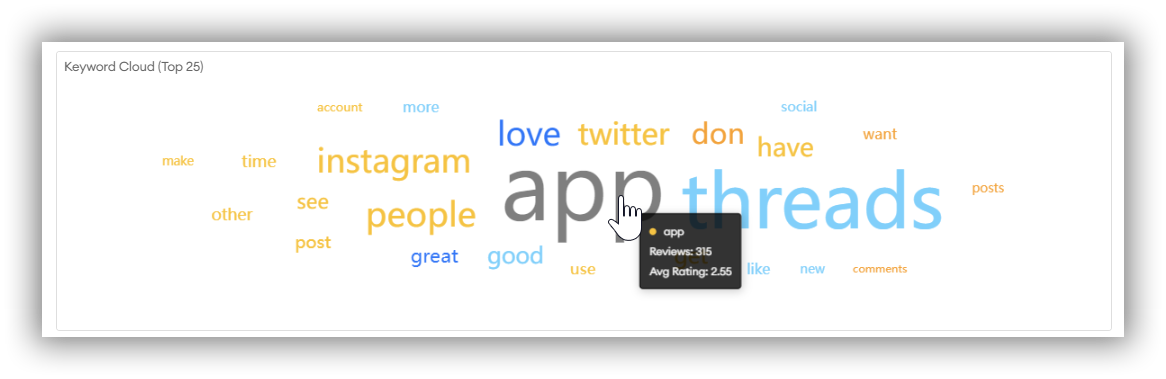
In the top right corner, you'll see the "Keywords Cloud". The color of the word cloud indicates sentiment: blue for positive, red for negative, and orange for neutral.
The font size represents the frequency of the keywords, with larger fonts indicating higher frequency. The cloud displays the top 25 most frequently occurring keywords.
Hover over a keyword to view its average rating and review count.
At the bottom, you'll find the "Details of Keywords" section. Here, you can examine specific keywords in detail, including their average rating, rating breakdown, occurrences, trend, and reviews.
Both the Rating Breakdown and Trend dimensions provide specific values that you can see by hovering over the icons.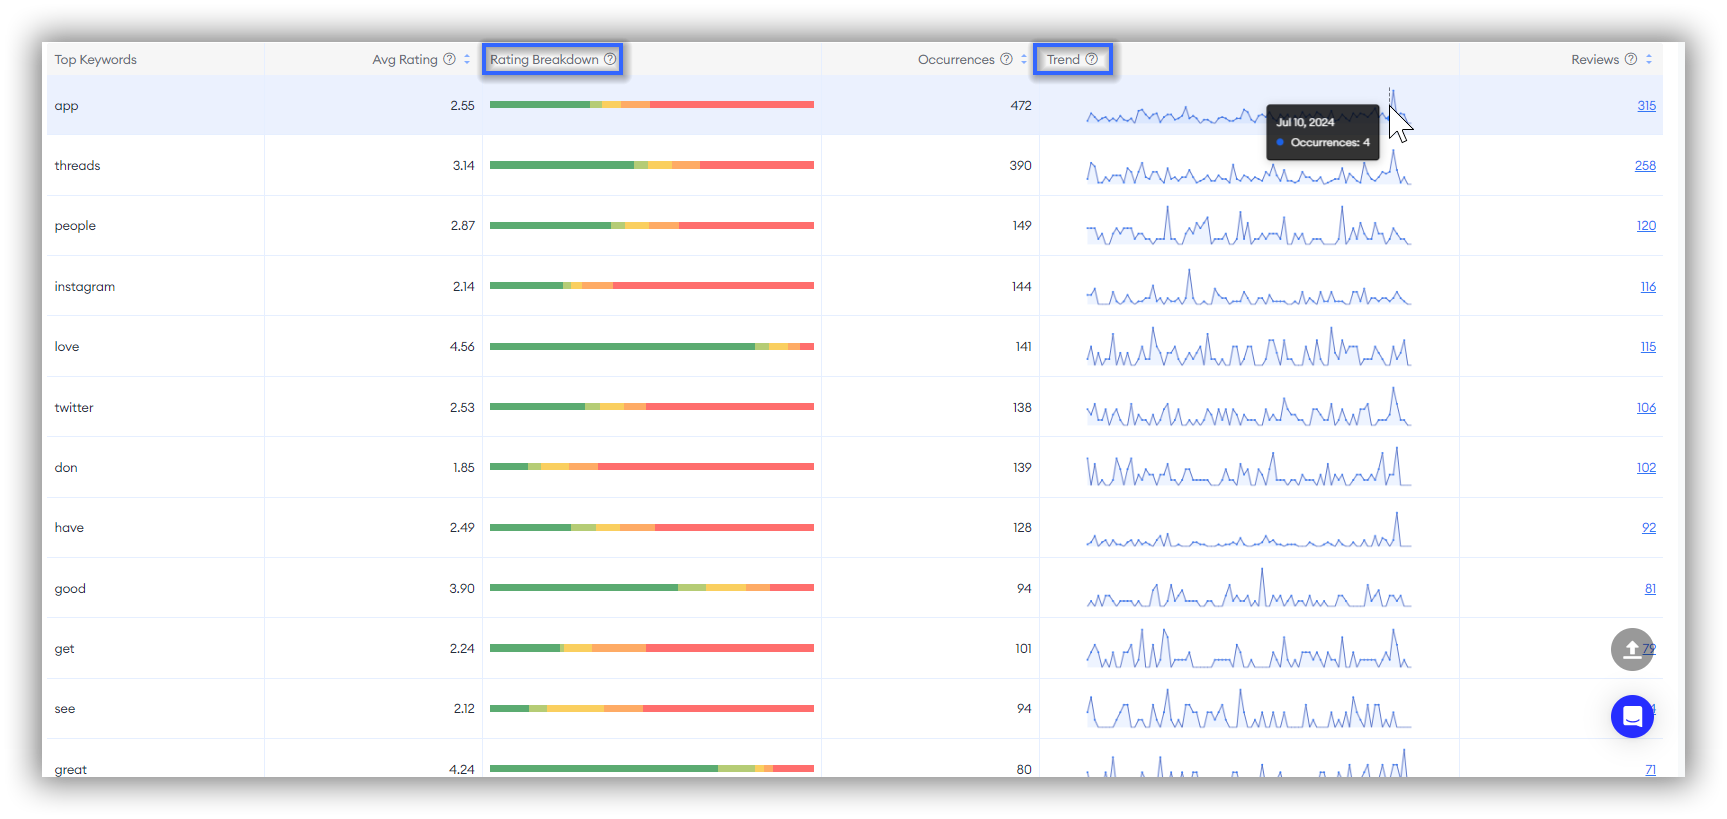
🗒️ Note: The default sorting is based on the review count. FoxData allows you to sort according to your needs, as Average Rating, Occurrences, and Reviews all support sorting.
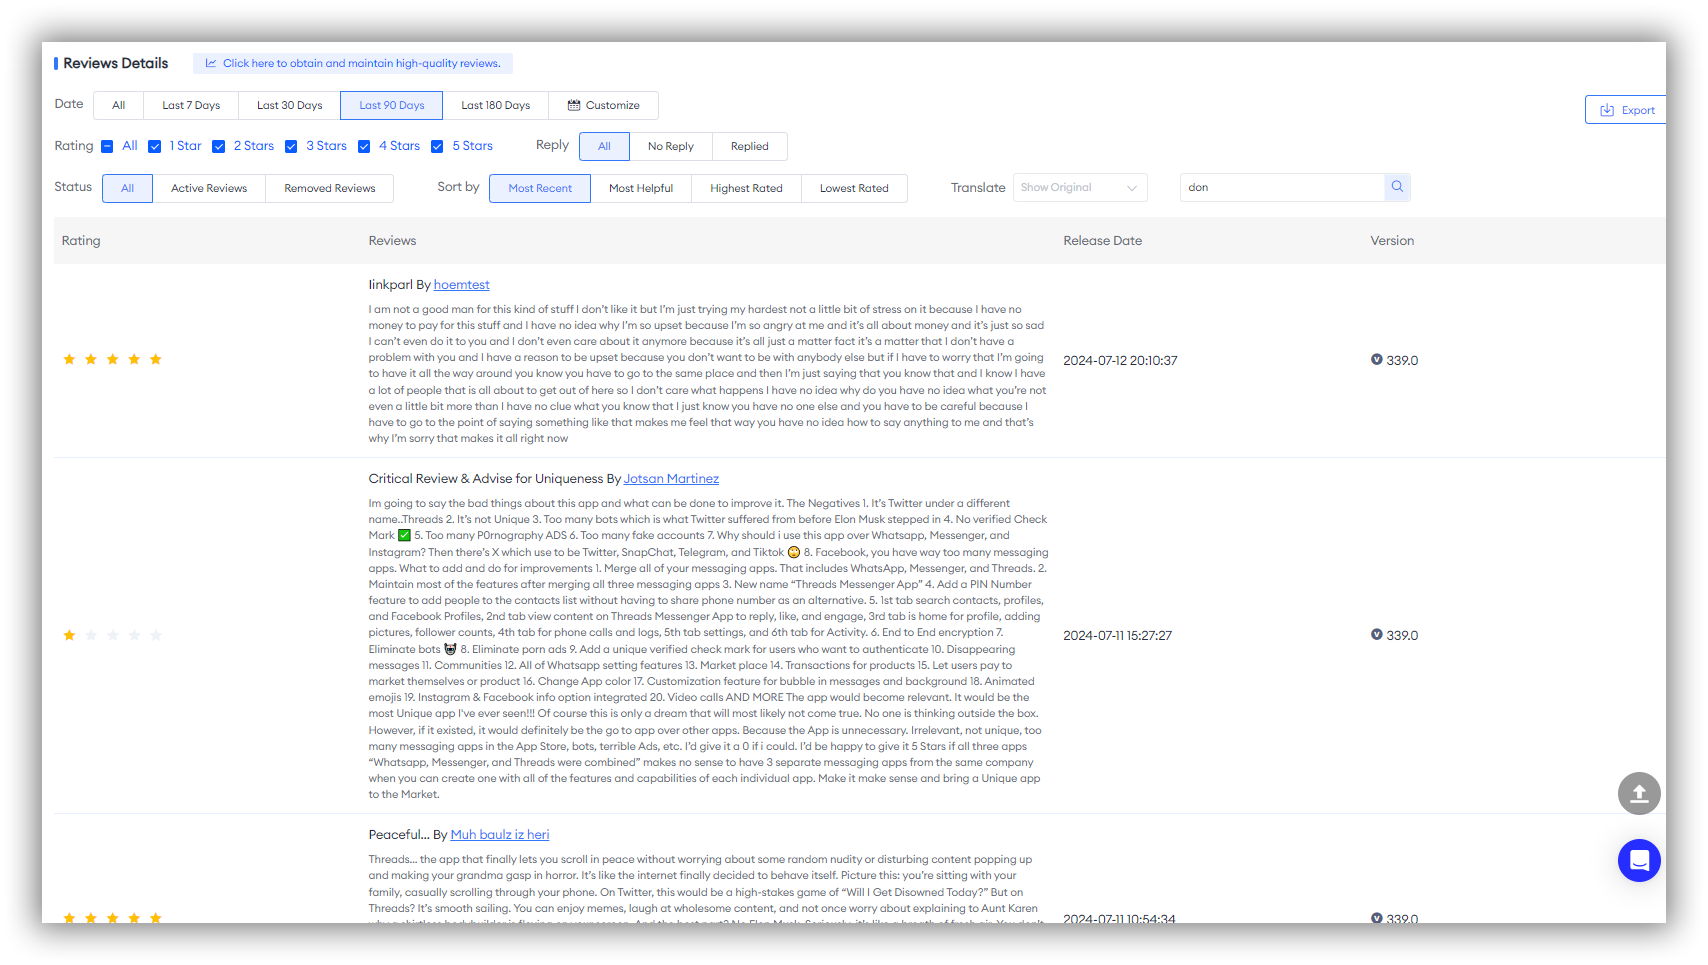
When you study the data for positive, neutral, and negative keywords, you'll likely want to find the specific reviews corresponding to those keywords for further analysis.
You might wonder if you need to manually sift through the comments section to find these reviews.
There's no need for such a cumbersome process! Our feature allows you to directly jump to specific user reviews associated with negative keywords.
Simply click on the review count corresponding to a particular keyword in the table, and you will be redirected to view the detailed reviews.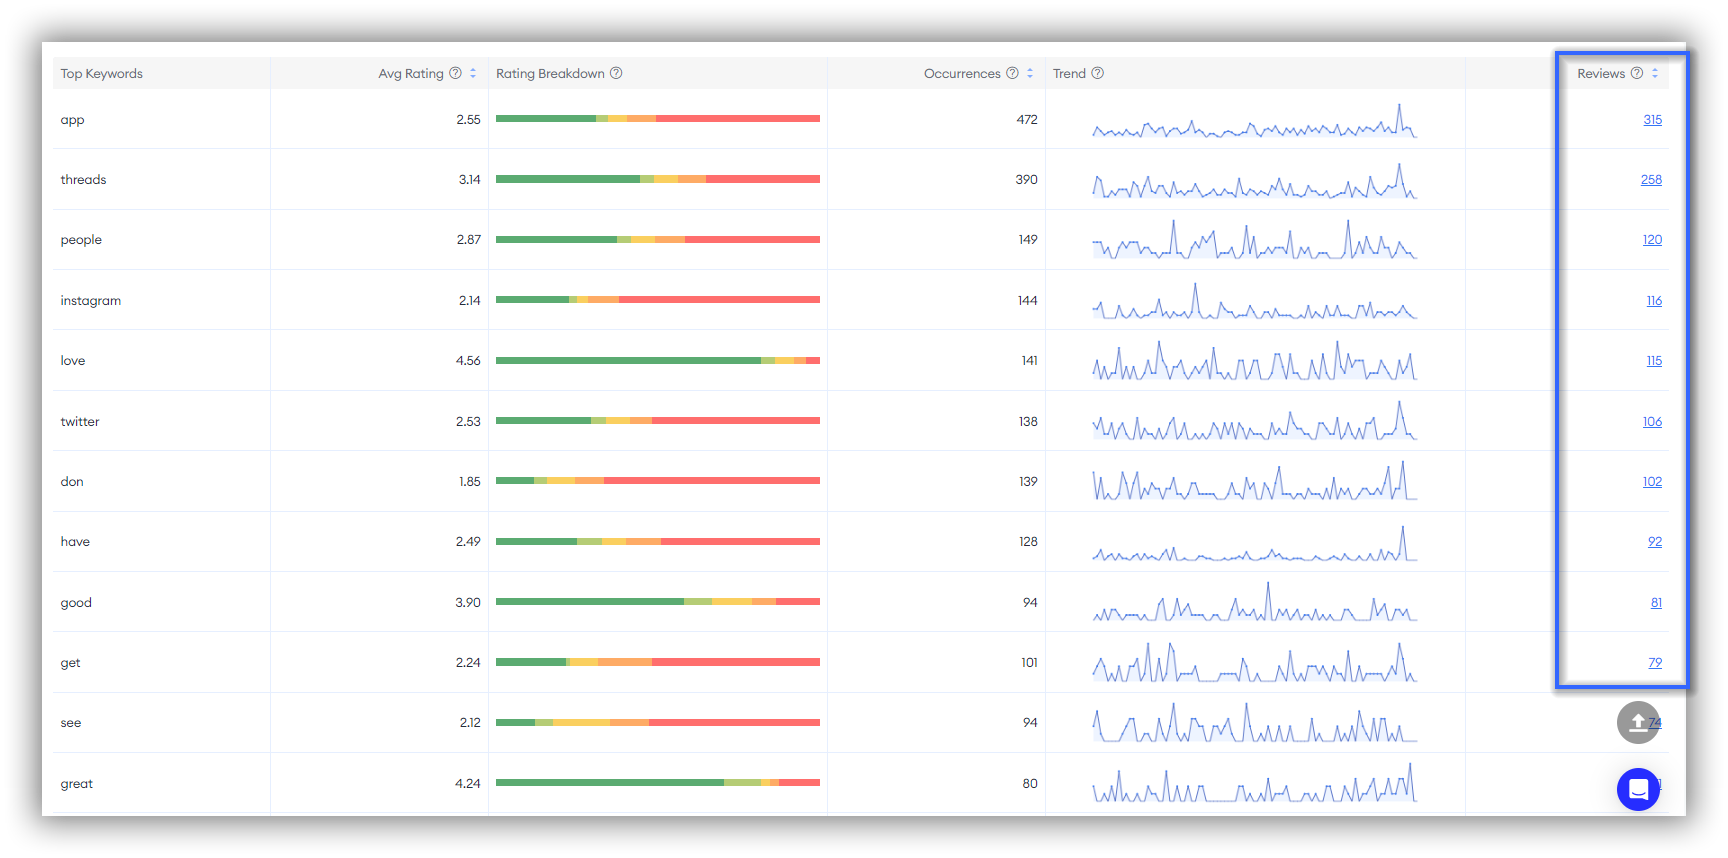
Expert Tips:
If you want to study and understand "Review Sentiment Analysis" more , welcome to read more 👉What's Going on Inside Your Users' Minds? Review Sentiment Analysis Helps You Find Out.
By utilizing FoxData's "Rating & Reviews" feature, you can comprehensively monitor app performance, quickly identify and resolve issues, formulate precise market strategies, and gain deep insights into user needs and emotional changes, thereby aiding in the continuous optimization and improvement of your product.
A: The "Review and Ratings" feature visualizes data to help users easily track app performance, identify market trends, and improve products based on user insights.
A: Yes, FoxData's "Review and Ratings" feature supports both iOS and Android platforms, providing insights for apps across both ecosystems.
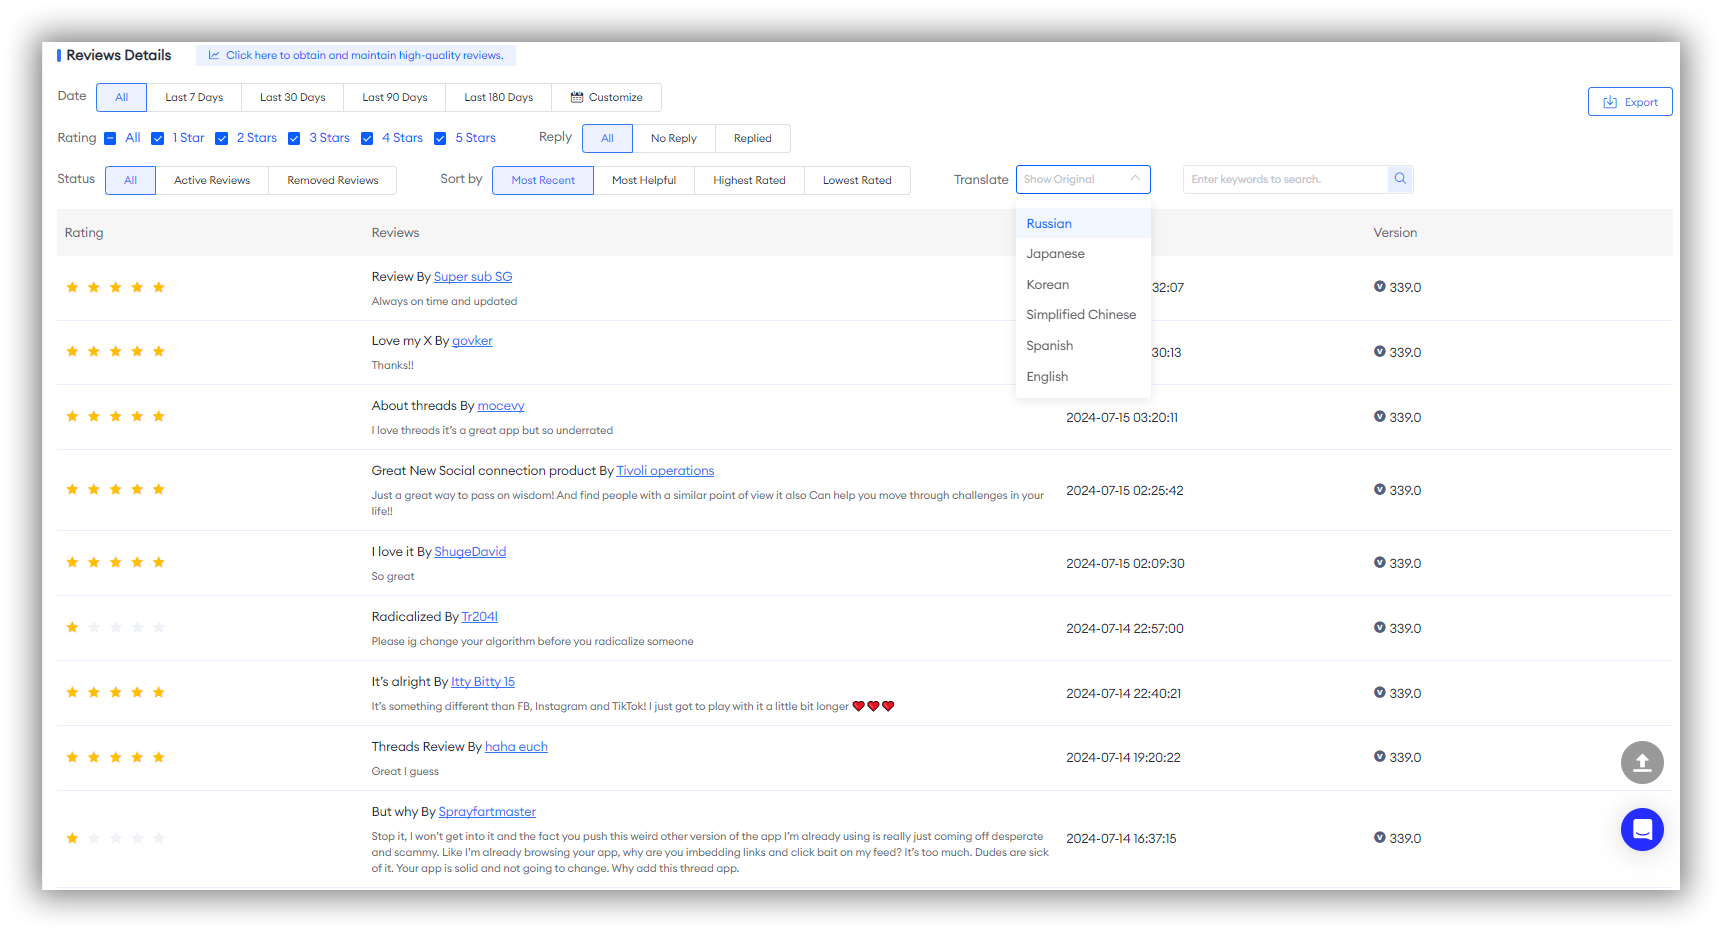
A: Absolutely. In the "Reviews Details" section under "Review and Ratings," there is an "Export" button in the top right corner. Click it to export the relevant data.
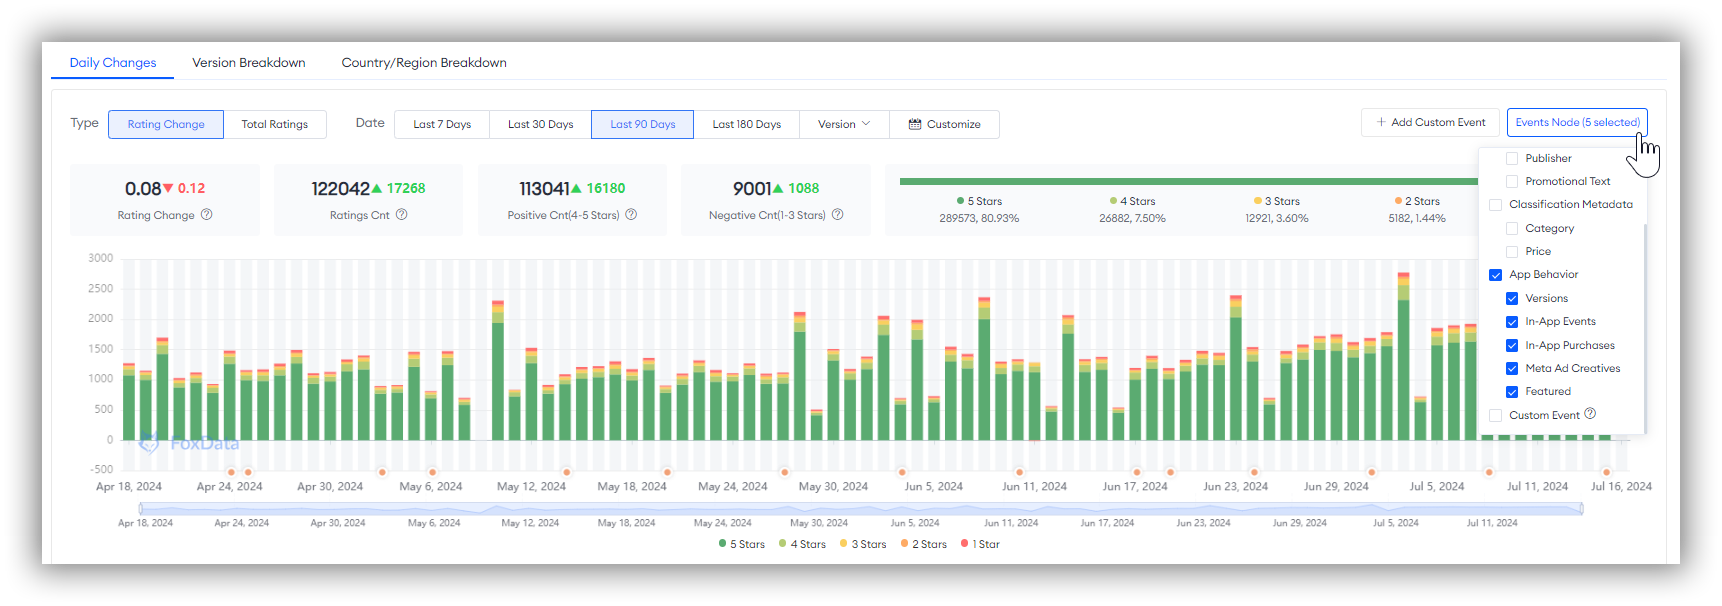
A: There are two possible reasons: either there were no app node for the app during the selected period, or you haven't checked the "Events Node." If it's the former, try extending the date range. If it's the latter, simply click the "Events Node" checkbox in the top right corner of the chart to select the event types you want to focus on.
A: FoxData allows you to compare up to four competitors.
A: Of course. After the date filter option, there is a "Customize" label and icon that allows you to select a custom date range.
A: For "Review Sentiment Analysis" to be effective, the words in your reviews need to be repeated at least five times. If you don't have enough data, we recommend using a larger date range for your analysis.
A: Yes, FoxData offers comprehensive tutorials and support documentation to help you make the most of the "Review and Ratings" feature. You can find them in FoxData blogs or help center.
© 2020-2026 FoxData. All Rights Reserved.
