

Explore More Possibilities for Your Business
Full-cycle scenario construction to meet your needs from App research, development, and release to operation.
Ready for your soaring growth
The mobile app market is not slowing down. Global consumer spending on apps reached approximately $167 billion in in-app purchases alone in 2025, up over 10% year-over-year. At the same time, the Apple App Store hosts around 2.19 million apps, and Google Play contains over 2 million apps as of early 2026.
That is a crowded field. And it is getting harder to stand out.
For most app teams, the instinct is to focus inward. They track their own ratings, downloads, and revenue. But without knowing how competitors are performing, your data tells only half the story.
This is where mobile app performance benchmarking becomes critical. It shifts your focus from "how are we doing?" to "how are we doing relative to the market?" That shift in perspective can completely change your growth strategy.

Discover how FoxData enhances data protection and security standards to keep your analytics safe and reliable.
Gut instinct is not a strategy. In a market where user acquisition costs are rising and competition intensifies by the month, every decision needs a data foundation.
Consider this: over 65% of all App Store downloads start with a search query, according to Apple. That means your ranking for the right keywords directly drives installs. If competitors are capturing those keywords and you are not, you are losing organic traffic that you may not even know exists.
There is also a conversion gap to consider. Apps rated below 4.0 stars see significantly reduced visibility, and research shows that 90% of featured apps on the App Store hold a 4.0 rating or higher. If a competitor has better ratings and more reviews, they convert better at the same ranking position. You will not spot this gap unless you benchmark.
Additionally, data from AppsFlyer shows that global user acquisition spend reached $78 billion in 2025, up 13% year-over-year. This means your competitors are spending more and smarter. Benchmarking tells you where their spend is focused, what is working for them, and where you have room to compete more efficiently.
In short: data does not just inform decisions. It reveals the blind spots your competitors are exploiting.
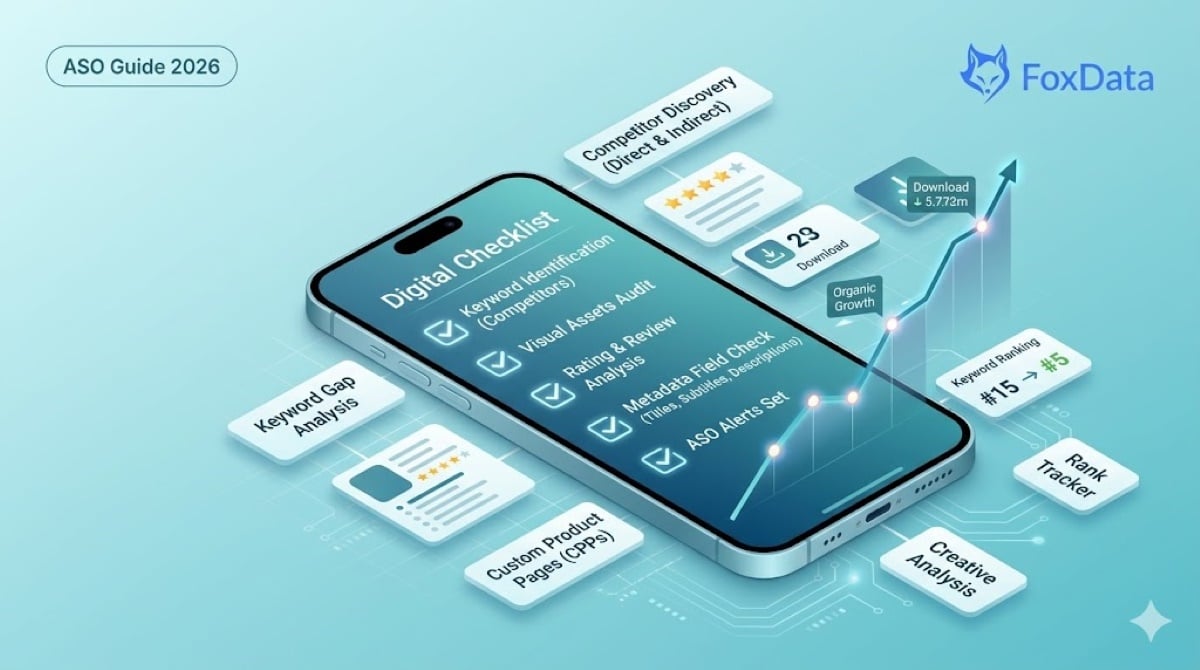
Before diving into how to do it, let us be precise about what app benchmarking means in practice.
App benchmarking is the process of measuring your app's key performance indicators — keyword rankings, download velocity, category ranking, ratings, metadata quality, and user acquisition strategy — and comparing them systematically against direct competitors and category leaders.
It is not a one-time audit. It is an ongoing intelligence practice.
Effective benchmarking covers several dimensions:
Keyword Coverage: Which keywords are competitors ranking for that you are not? Where do you overlap, and who is winning those overlapping positions?
App Market Share Analysis: What percentage of category downloads and revenue goes to top competitors? Are their shares growing or shrinking?
Visual and Metadata Quality: How do competitors structure their titles, descriptions, screenshots, and preview videos? Are they testing creatives more frequently than you?
Ratings and Review Velocity: Are competitors generating more fresh reviews? Are they responding to negative reviews faster?
Update Frequency: Research shows that top apps update screenshots two to four times per year, with top games on Google Play updating up to eight times annually — and those apps rank higher as a result. How does your cadence compare?
Each of these dimensions tells a different story. Together, they paint a complete picture of where you stand and where the opportunity lies.
Here are the specific metrics every mobile marketer and UA manager should track during a benchmarking exercise:
Map your keyword rankings against two or three direct competitors. Look for high-volume keywords where competitors rank in the top 10 but you do not appear at all. These are your fastest-growth opportunities — terms that already have demand and proven search intent.
Track weekly rank movements in your primary and secondary categories. A competitor's sudden rise often signals a new creative test, a feature update, or a paid push. Catching these signals early lets you respond before the gap widens.
Estimated download data helps with app market share analysis. If a competitor doubled their installs over 90 days and you did not, you need to understand why. Did they change metadata? Run a new campaign? Launch in a new market?
Comparing revenue estimates reveals which monetization models are working in your category. If a competitor shifted from one-time purchases to subscriptions and their revenue grew, that is data worth acting on.
Conversion rate — the percentage of store page visitors who install — varies widely by category and by listing quality. Understanding where your conversion rate sits relative to competitors shows whether your creative assets are doing their job.
Knowing what to measure is one thing. Having the tools to do it at scale is another. This is where FoxData's ASO and mobile analytics platform delivers real competitive advantage.
FoxData is built specifically for developers, marketers, and publishers who need deep, actionable competitive intelligence — not just surface-level rankings.
Use FoxData's keyword intelligence tools to map where competitors rank versus where you rank. You can identify keyword gaps quickly — terms that drive real traffic for competitors but where your app has no presence. This is the starting point of every effective ASO benchmarking exercise.
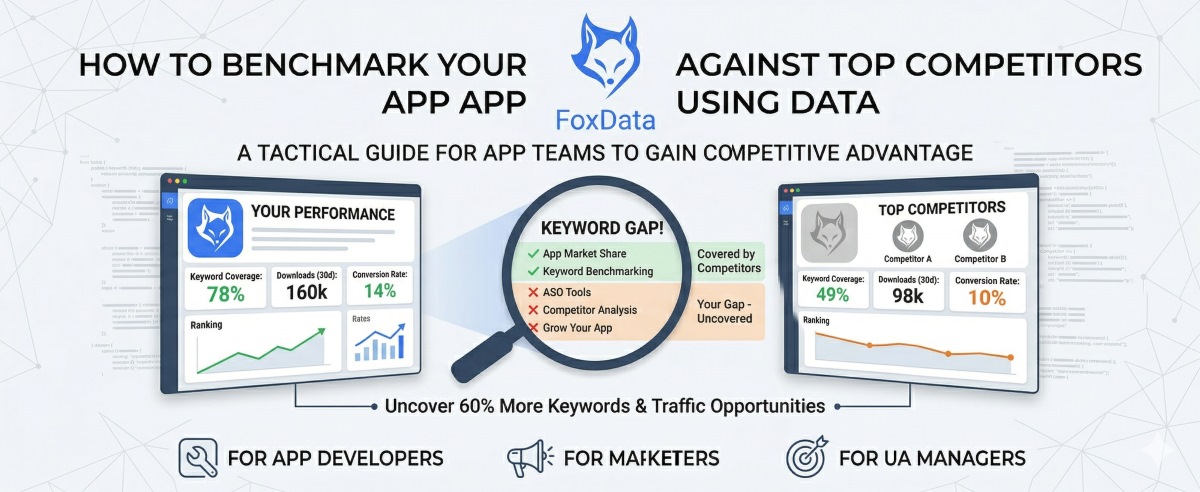
A real example of what this looks like in practice: a fitness app using FoxData's ASO tools increased keyword coverage by 60% and reduced acquisition cost by 28%. That is not a theoretical outcome — it is a documented result from systematic benchmarking and keyword optimization.
FoxData lets you monitor competitor metadata changes over time. When a top competitor updates their title, icon, or screenshots, you will see it. This tells you what they are testing and what the market is responding to — without spending your own budget on those tests first.
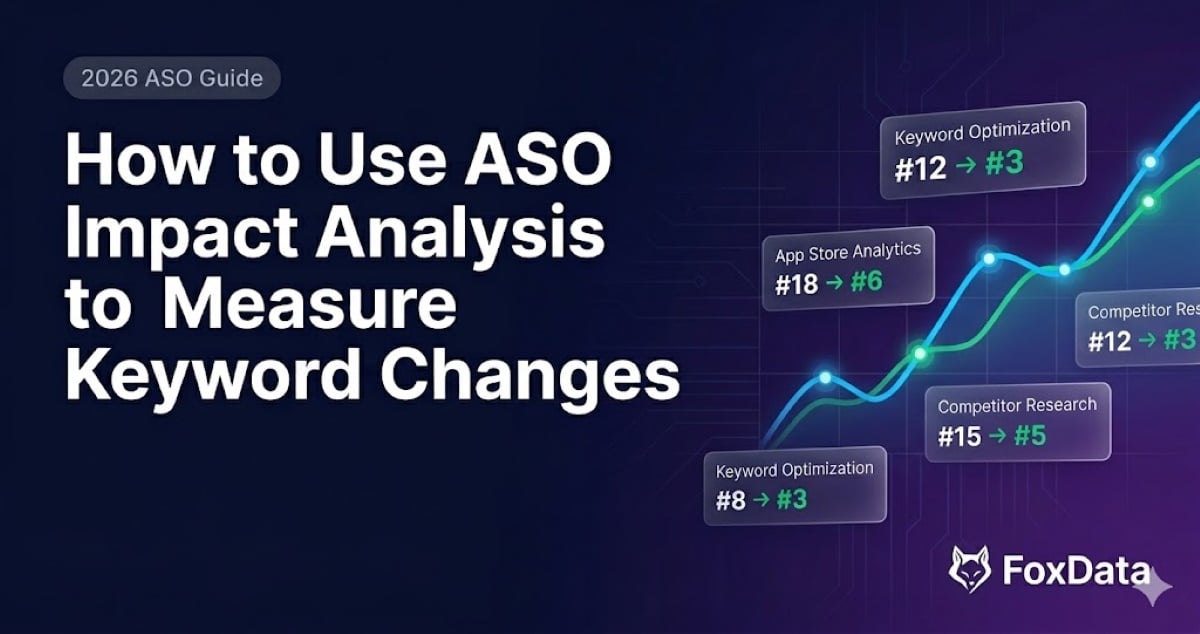
FoxData's ASO impact analysis tools help you measure the before-and-after effect of metadata changes. When you update keywords or visuals, you need to know if it moved the needle. Impact analysis closes the feedback loop that many teams leave open.
For publishers and UA managers, FoxData's global mobile app market research tools provide a macro view of your category. You can track whether your share of organic downloads is growing or declining relative to the top five players — and spot the exact moment a competitor begins gaining ground.
Benchmarking is not useful as a one-off exercise. Industry data suggests reviewing ASO benchmarks quarterly at minimum, aligned with product updates and seasonal trends. FoxData's dashboards are designed to support this cadence, making it easy to run monthly competitor snapshots and track changes over time.
For indie developers and smaller teams, FoxData's ASO tools for indie developers offer the same competitive intelligence at an accessible price point — removing the advantage that only large studios used to have.
Even teams with good benchmarking intentions make avoidable errors. Here are the most damaging ones:
The app store competitive landscape shifts fast. A quarterly review is a minimum, not a ceiling. Top competitors are updating metadata, testing creatives, and adjusting keyword strategies continuously.
Your benchmark set should include direct competitors in your category and category leaders above you. Do not limit benchmarking only to peers — study the leaders to understand what top performance actually looks like.
Many teams focus exclusively on keywords and ignore creative assets. Yet studies indicate that improving screenshots and preview videos can increase conversion rates by 10 to 30% in some cases. If competitors are running A/B tests on screenshots and you are not, you are leaving conversions on the table.
Research consistently shows that ratings below 4.0 reduce visibility significantly. Benchmarking your rating trajectory against competitors — not just your absolute score — shows whether you are gaining or losing ground in one of the algorithm's most important signals.
Running benchmarks without measuring the impact of your subsequent changes means you are optimizing blind. Every change to metadata or creative should be followed by a measurement window to assess whether it moved your rankings, conversion, or downloads.
A: At minimum, conduct a full benchmark review every quarter. For high-velocity categories like gaming or social apps, monthly reviews are more appropriate. Many top teams run lightweight weekly checks on keyword rankings and competitor metadata changes.
A: Start with keyword gap analysis. Identifying high-volume keywords where competitors rank but you do not gives you immediate, actionable opportunities without requiring any product changes — only metadata improvements.
A: Yes. Tools like FoxData are designed to serve indie developers alongside enterprise publishers. The data and methodologies are the same. Smaller teams may benchmark fewer competitors at once, but the strategic value is identical.
A: By identifying where organic keyword opportunities exist, benchmarking helps teams capture installs without paid spend. When organic coverage improves — as with the fitness app case where keyword coverage rose 60% — the reliance on paid UA drops, which directly lowers blended acquisition cost.
The mobile app market rewards teams that operate on data, not assumptions. With over four million apps across the major stores and user acquisition costs still rising in 2026, benchmarking is no longer optional — it is a core growth discipline.
The teams winning in their categories are not just building great products. They are watching competitors closely, identifying gaps in keyword coverage, monitoring conversion signals, and acting on what the data reveals. That intelligence cycle — observe, analyze, optimize, measure — is what separates sustained growth from stagnation.
Benchmarking does not require a massive team or an enterprise budget. It requires the right tool and a consistent process.
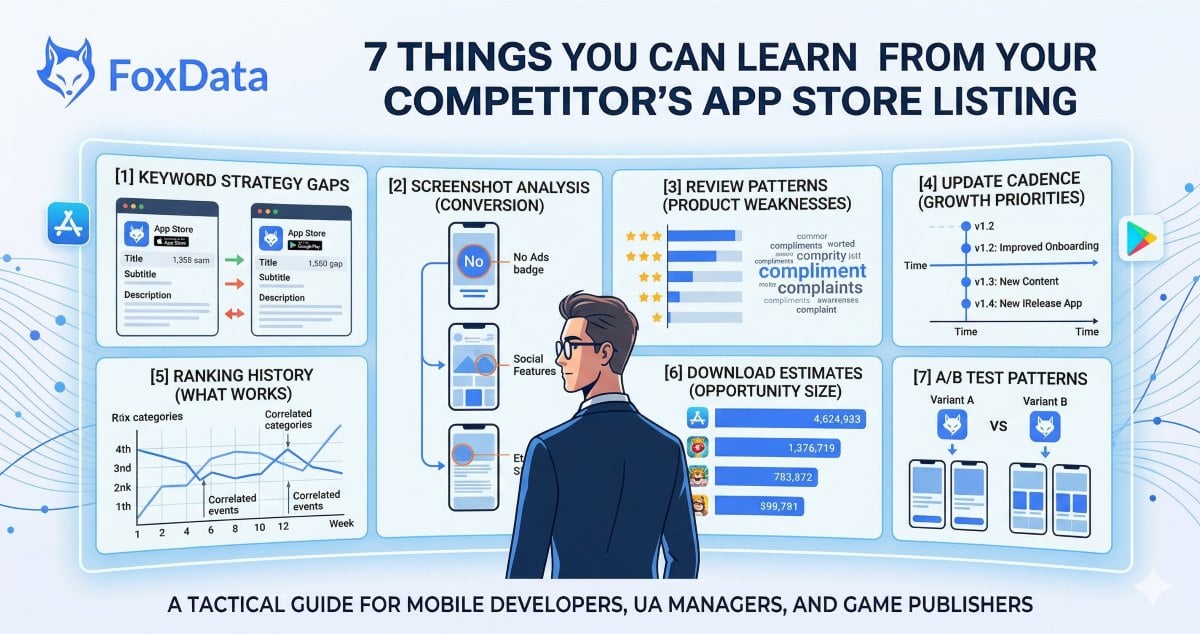
Ready to see exactly where you stand against your top competitors? Explore FoxData's full suite of app analytics and ASO benchmarking tools and start turning competitive data into measurable growth. Whether you are a solo developer or a global publisher, FoxData gives you the intelligence to compete smarter. You can also learn more in FoxData's practical guide to conducting a mobile app competitor analysis and their breakdown of 7 things you can learn from competitor app listings to sharpen your strategy further.
© 2020-2026 FoxData. All Rights Reserved.
