How FoxData's New Features Deepen Your Market Research
Great news! FoxData has recently rolled out two major updates!
Next, let's dive into these two features, Mobile App Global Benchmarks and Trends Report and Market Segment!
Mobile App Global Benchmarks and Trends Report
FoxData provides you with the latest real-time global app market data in App Store or Google Play to help you uncover new growth opportunities.
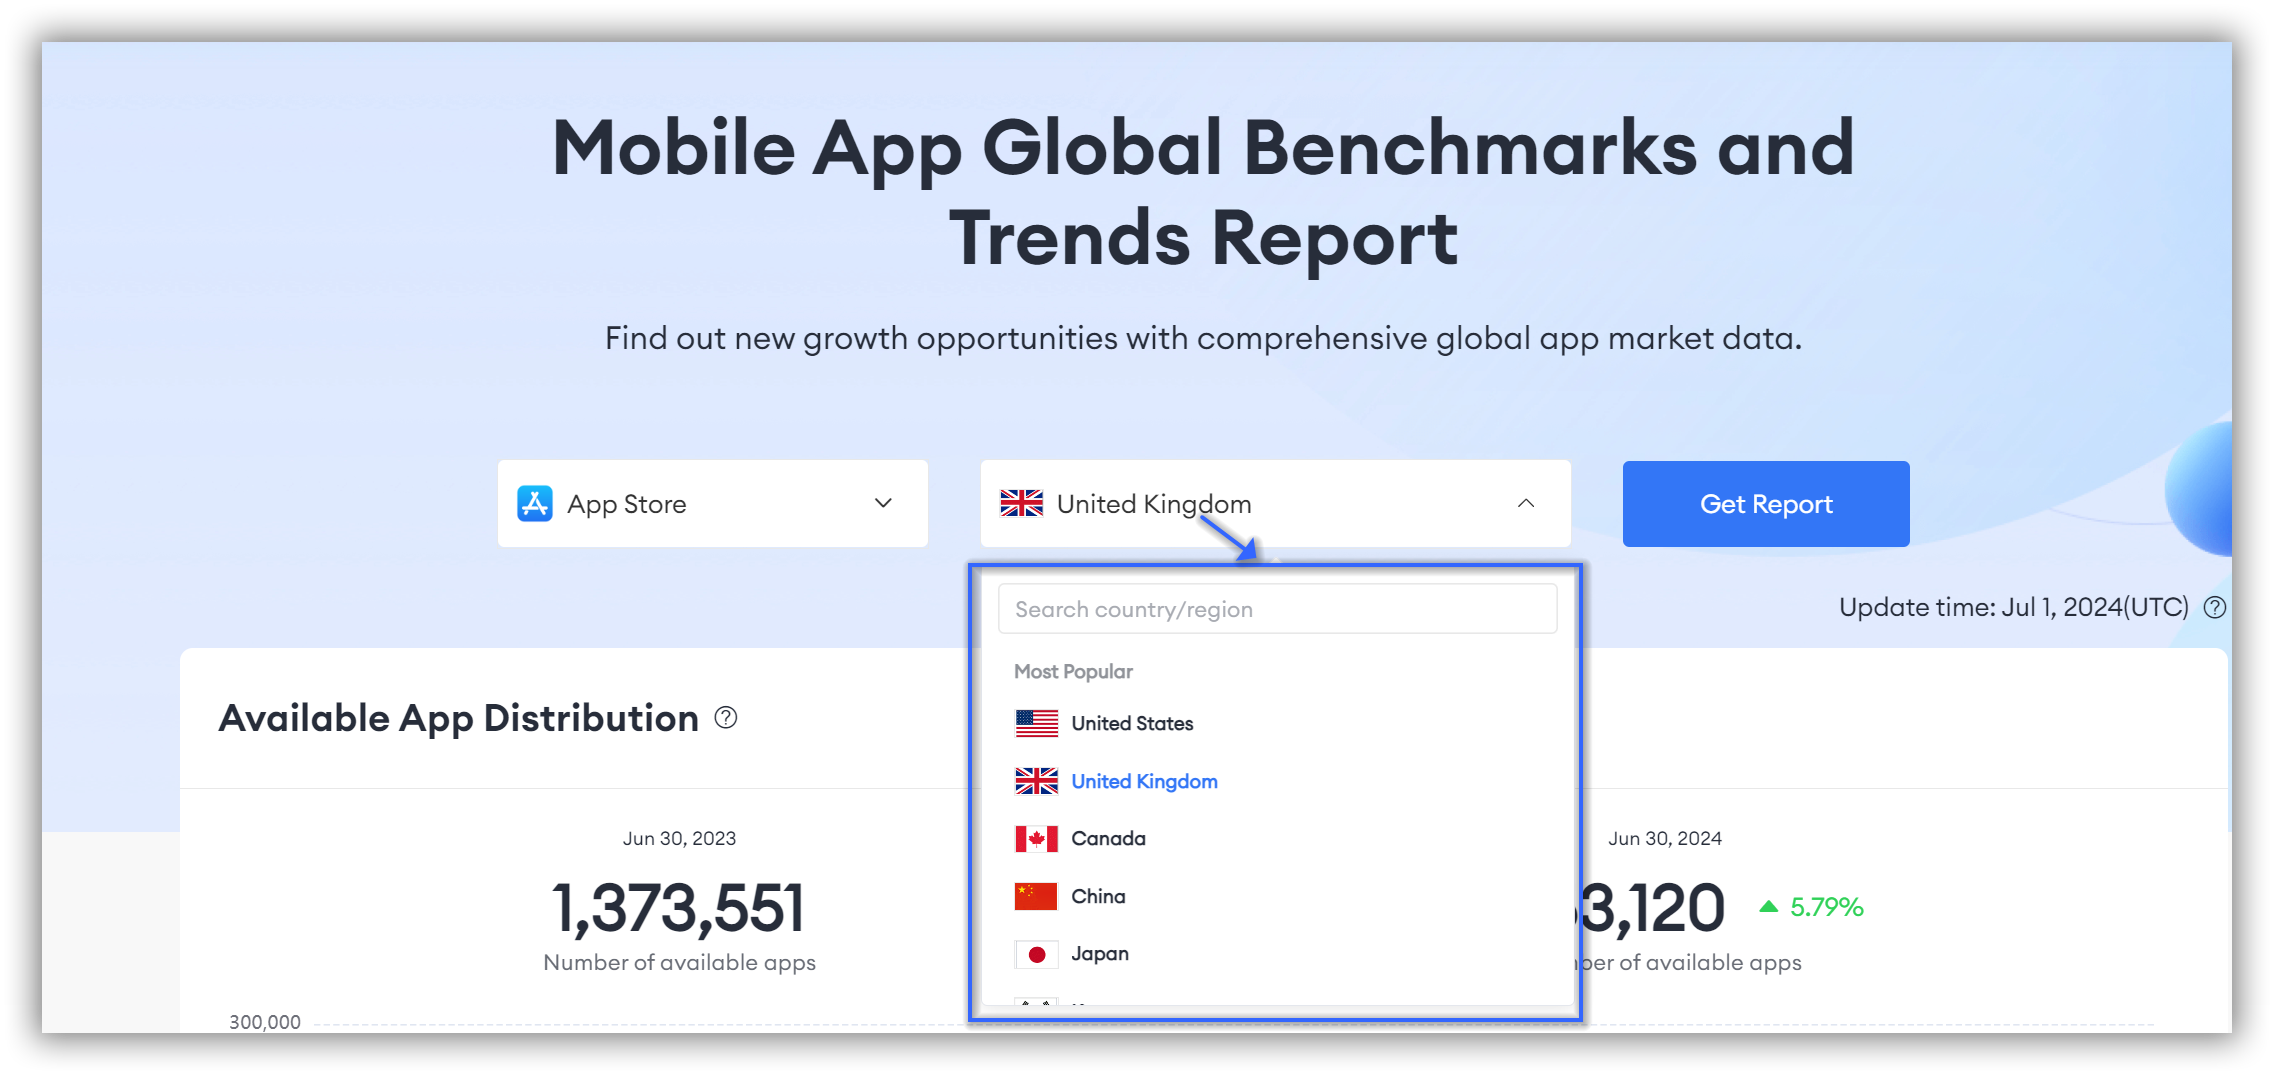
The Mobile App Global Benchmarks and Trends Report will provide you with Available App Distribution, Statistics of Release/Remove Apps in Category, Number of Pre-order Apps, Monthly Update Frequency, Average Rating, Search Top Keyword Analysis, and App Price Proportion.
Available App Distribution
Here, we display the number of available apps in the store and country on the last day of the previous month, along with the specific app category counts compared to the same day last year.
- The horizontal axis shows the app categories.
- The vertical axis displays the number of available apps.
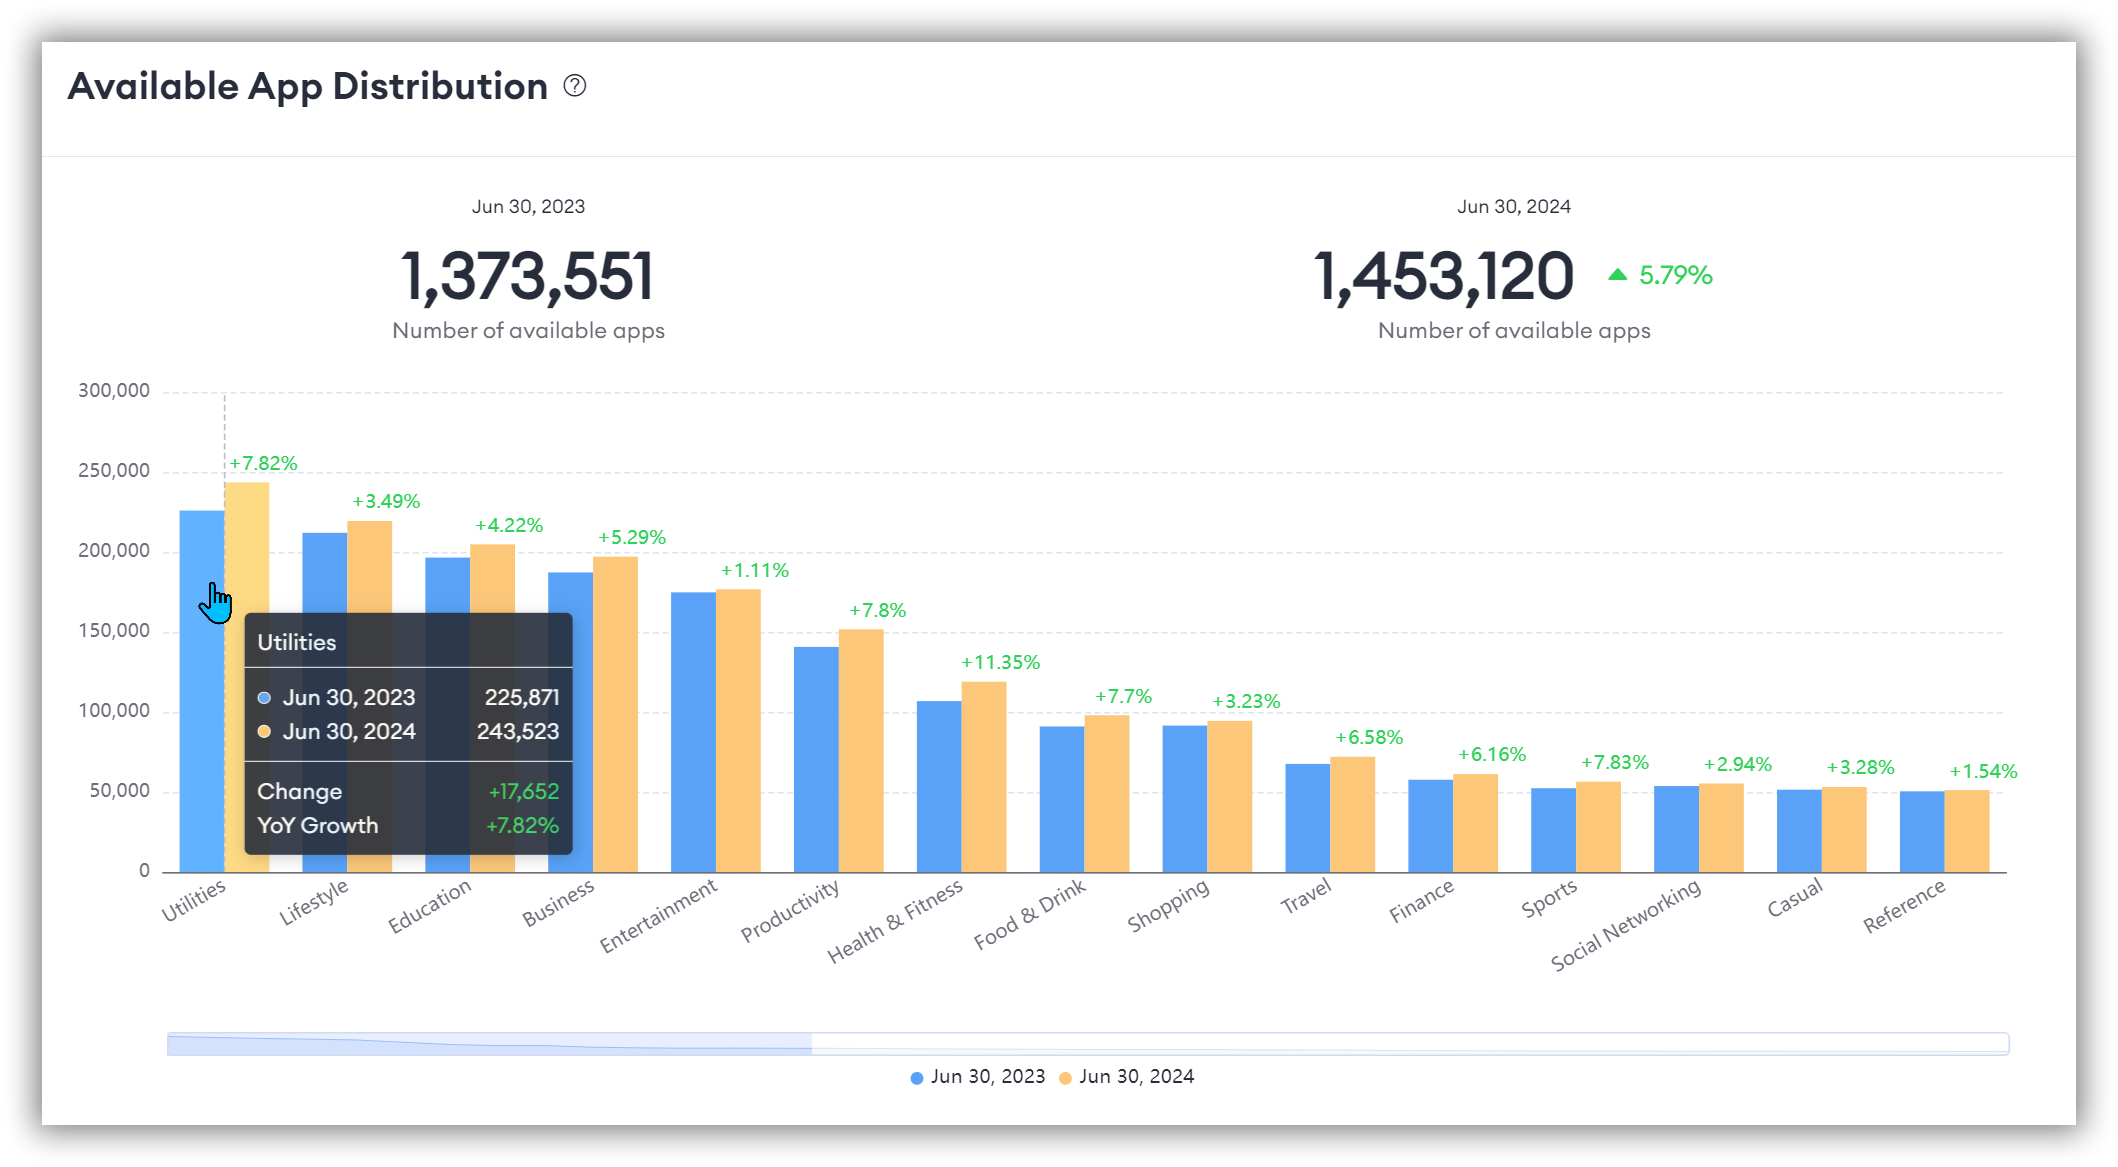
By looking at the number of available apps in the store and country on the last day of the previous month, users can understand the app distribution in a specific market.
Comparing this data to the same day last year can help users analyze market trends and changes, identifying growing or declining markets.
You must have noticed the blue data axis at the bottom. By sliding your mouse to the right, you can directly access more data on available apps.
💡 Note: The bar chart here defaults to a descending trend. Categories with more available apps are positioned at the front, indicating a larger market share in the app store.
Statistics of Release/Remove Apps in Category
Scroll down to get the Statistics of Release/Remove Apps in Category.
It shows update statistics on the number of new apps released and removed in each application category for the current month.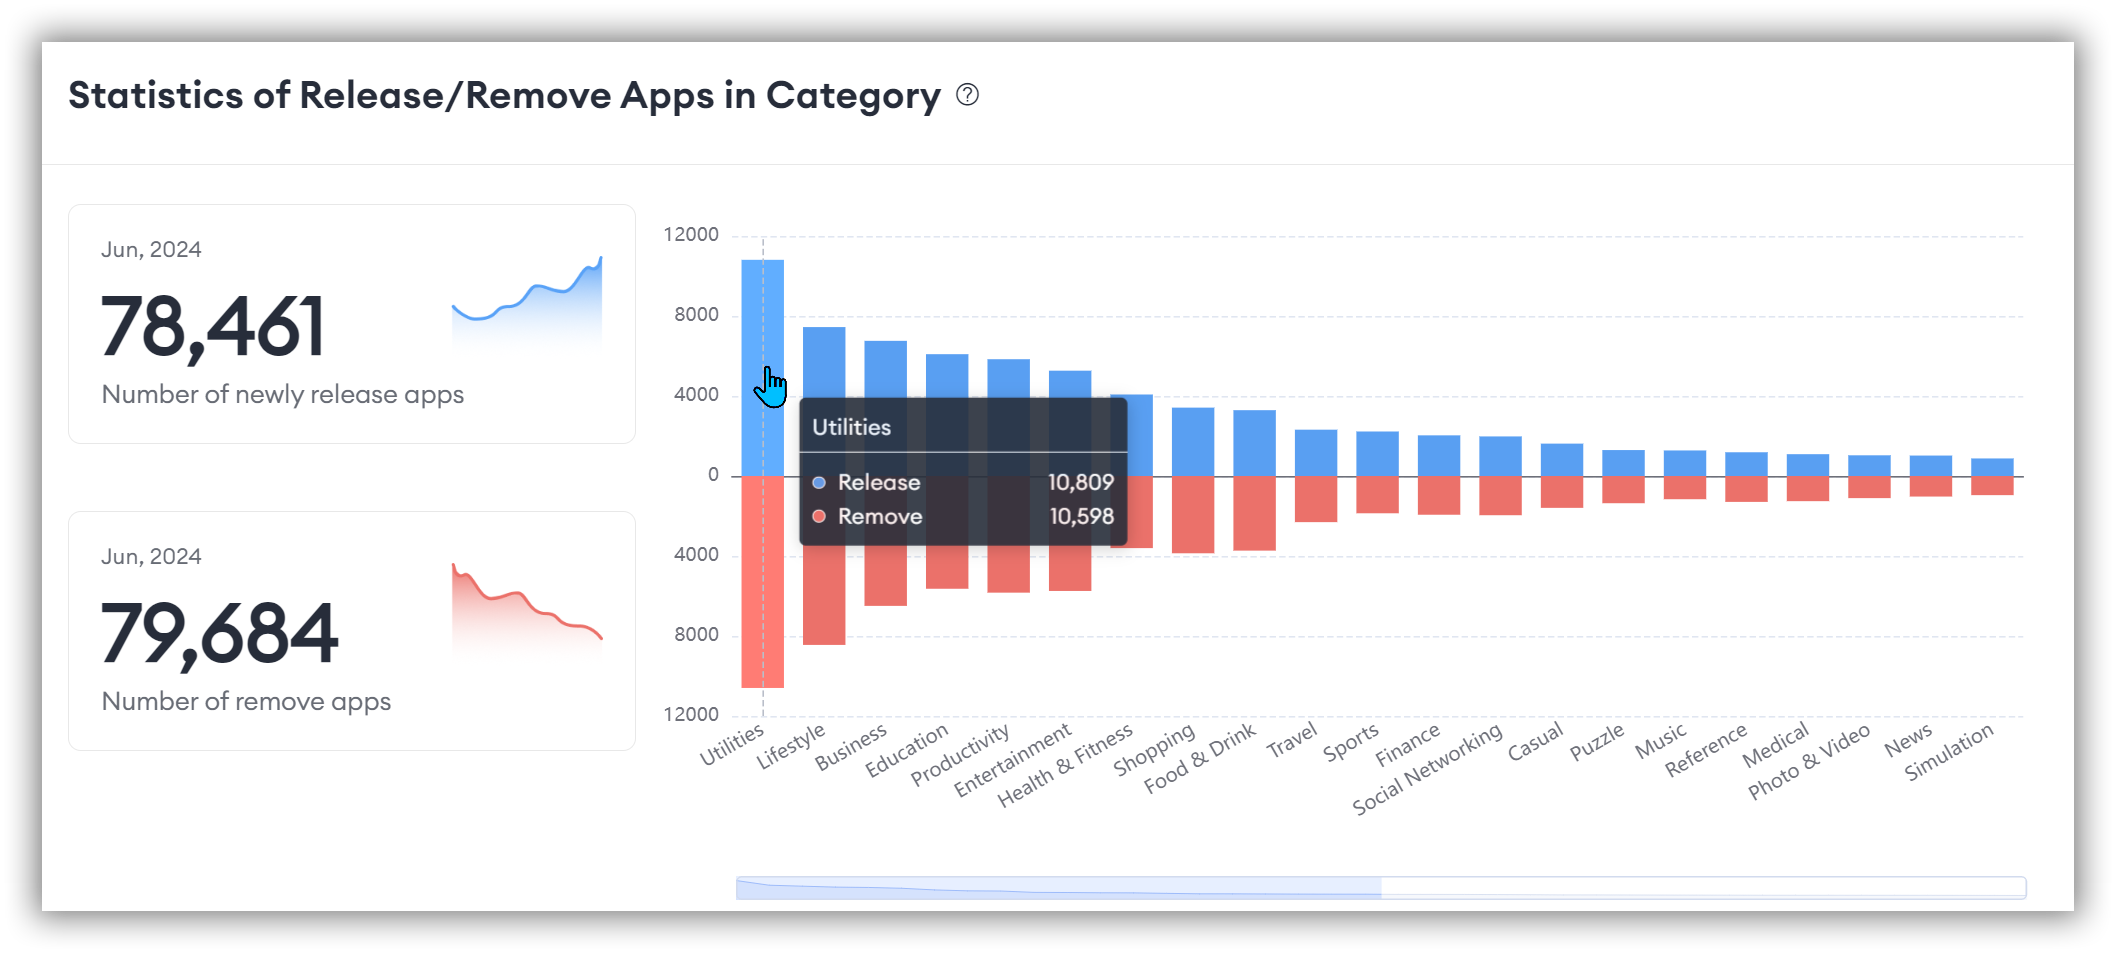
Monthly data on app releases and removals, especially the numbers within specific categories, can help users understand the dynamic changes in the market.
By identifying which categories have more new apps released or old apps removed, you can gauge the level of market competition.
💡 Note: Don't forget to slide your mouse to the right to directly access more app data.
Number of Pre-order Apps
If you're an app developer, you definitely don't want to miss this feature section!
It shows the trend changes in scheduled app launches for the current month.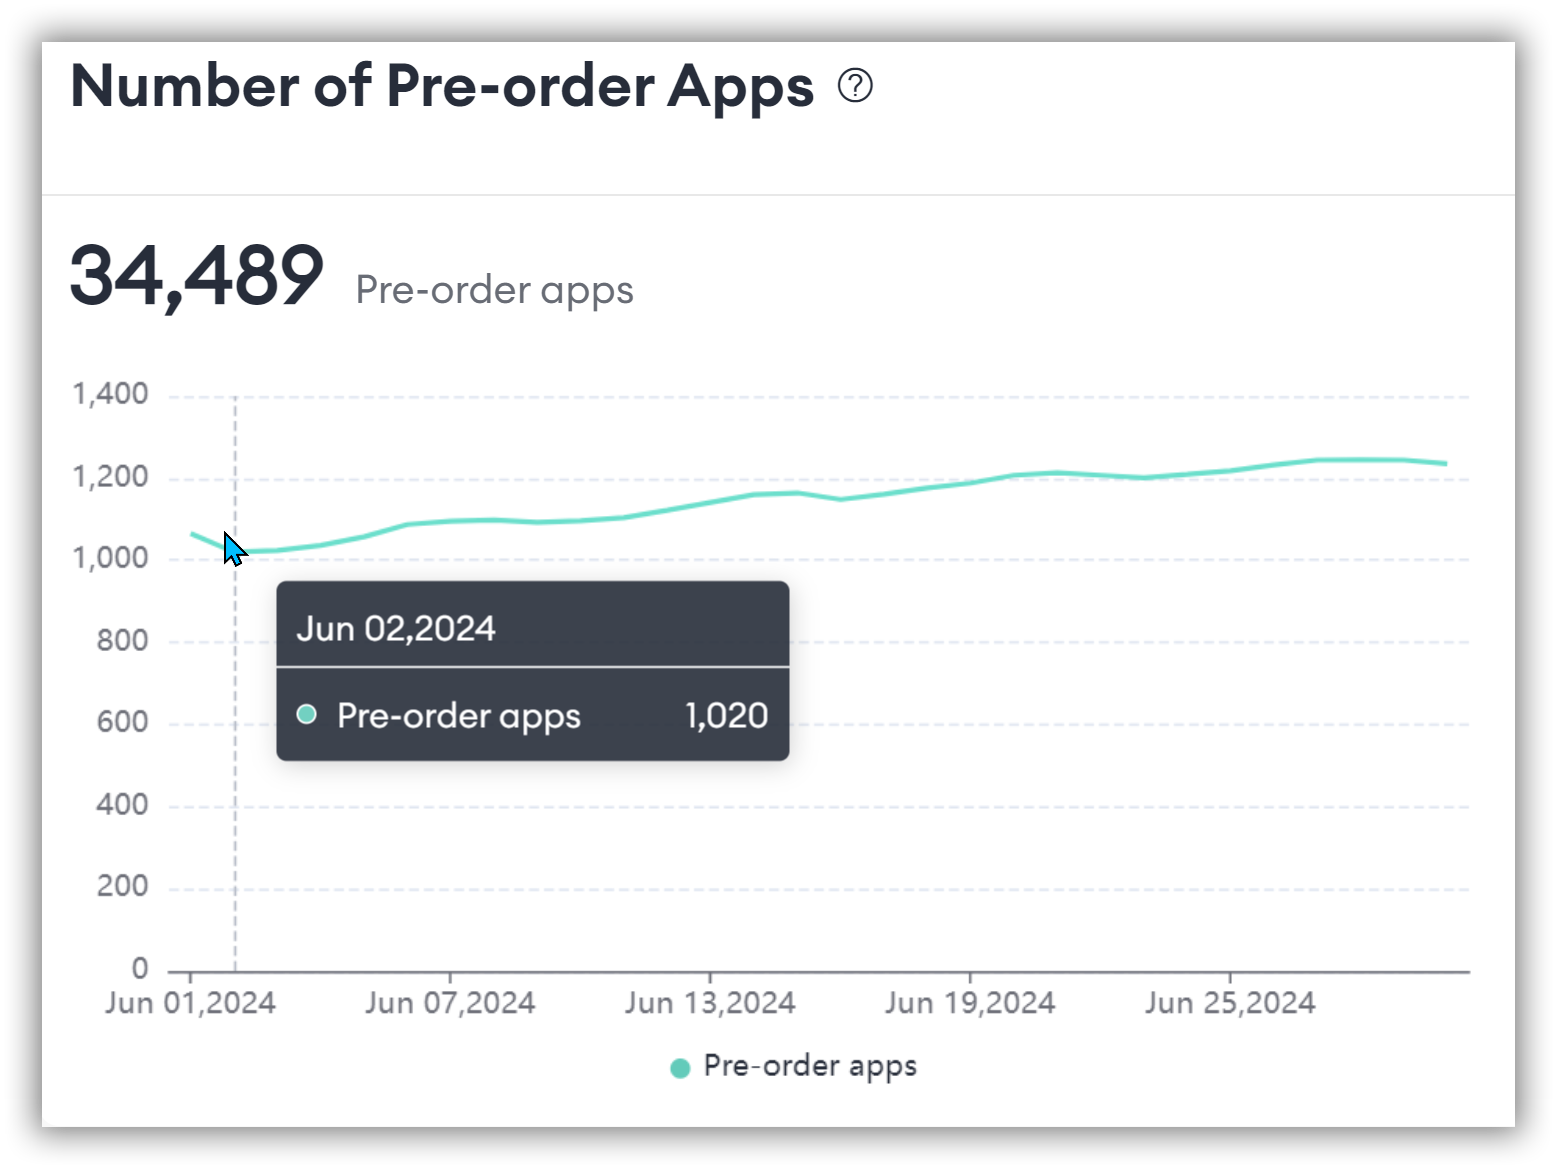
Based on the pre-order trends, users can adjust their market strategies to prepare for upcoming competition.
For market researchers, daily pre-order app data and summary statistics can also help predict future market changes.
Monthly Update Frequency
The graphic shows updated statistics on the average frequency of application updates within each category for the current month.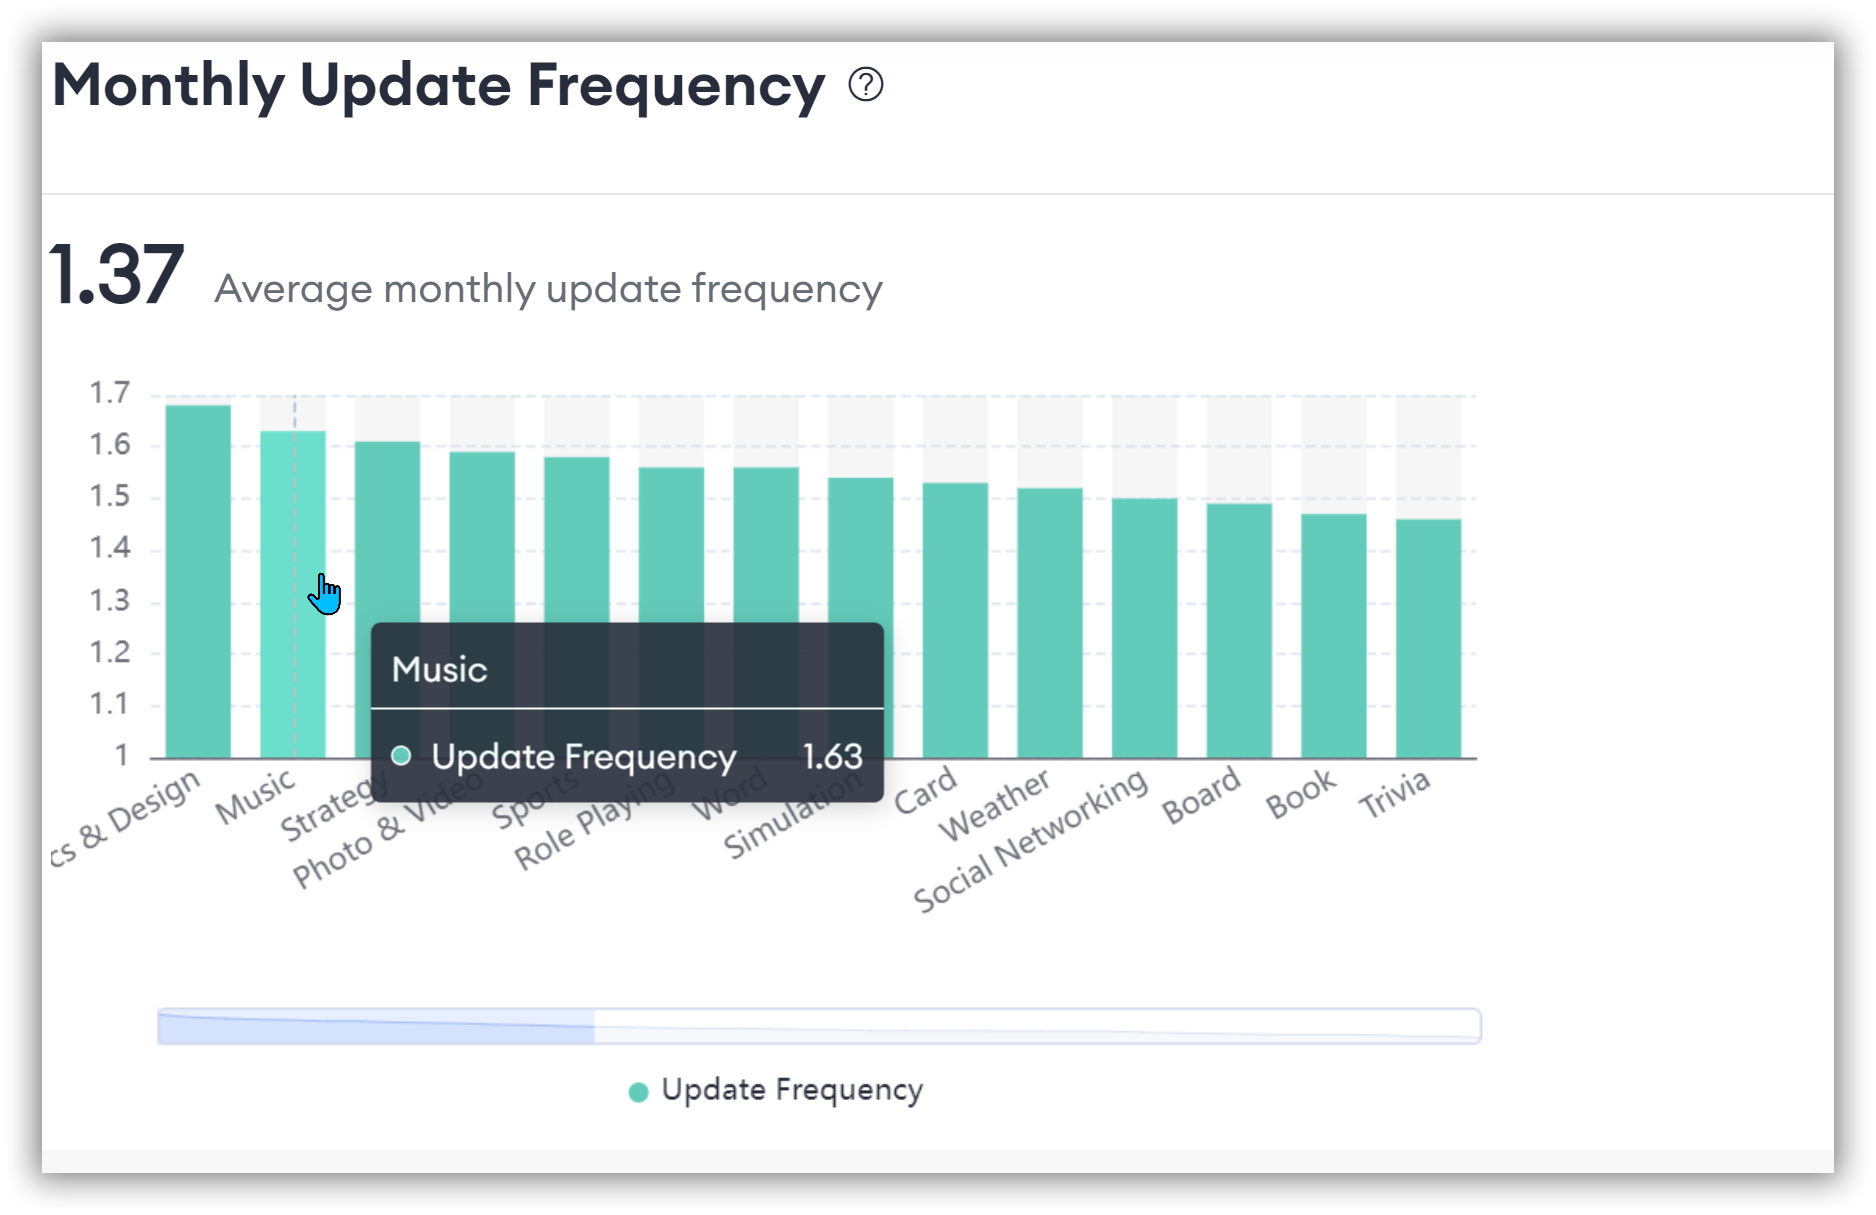
By examining the monthly update frequency of apps within a category, users can assess the activity level of that category.
Frequently updated apps may indicate higher quality and user satisfaction, which can be valuable for users choosing partners or investment targets.
Average Rating
The Average Rating section consists of two parts:
- App Average Rating (on the left)
- Average Rating of Specific Category (on the right)
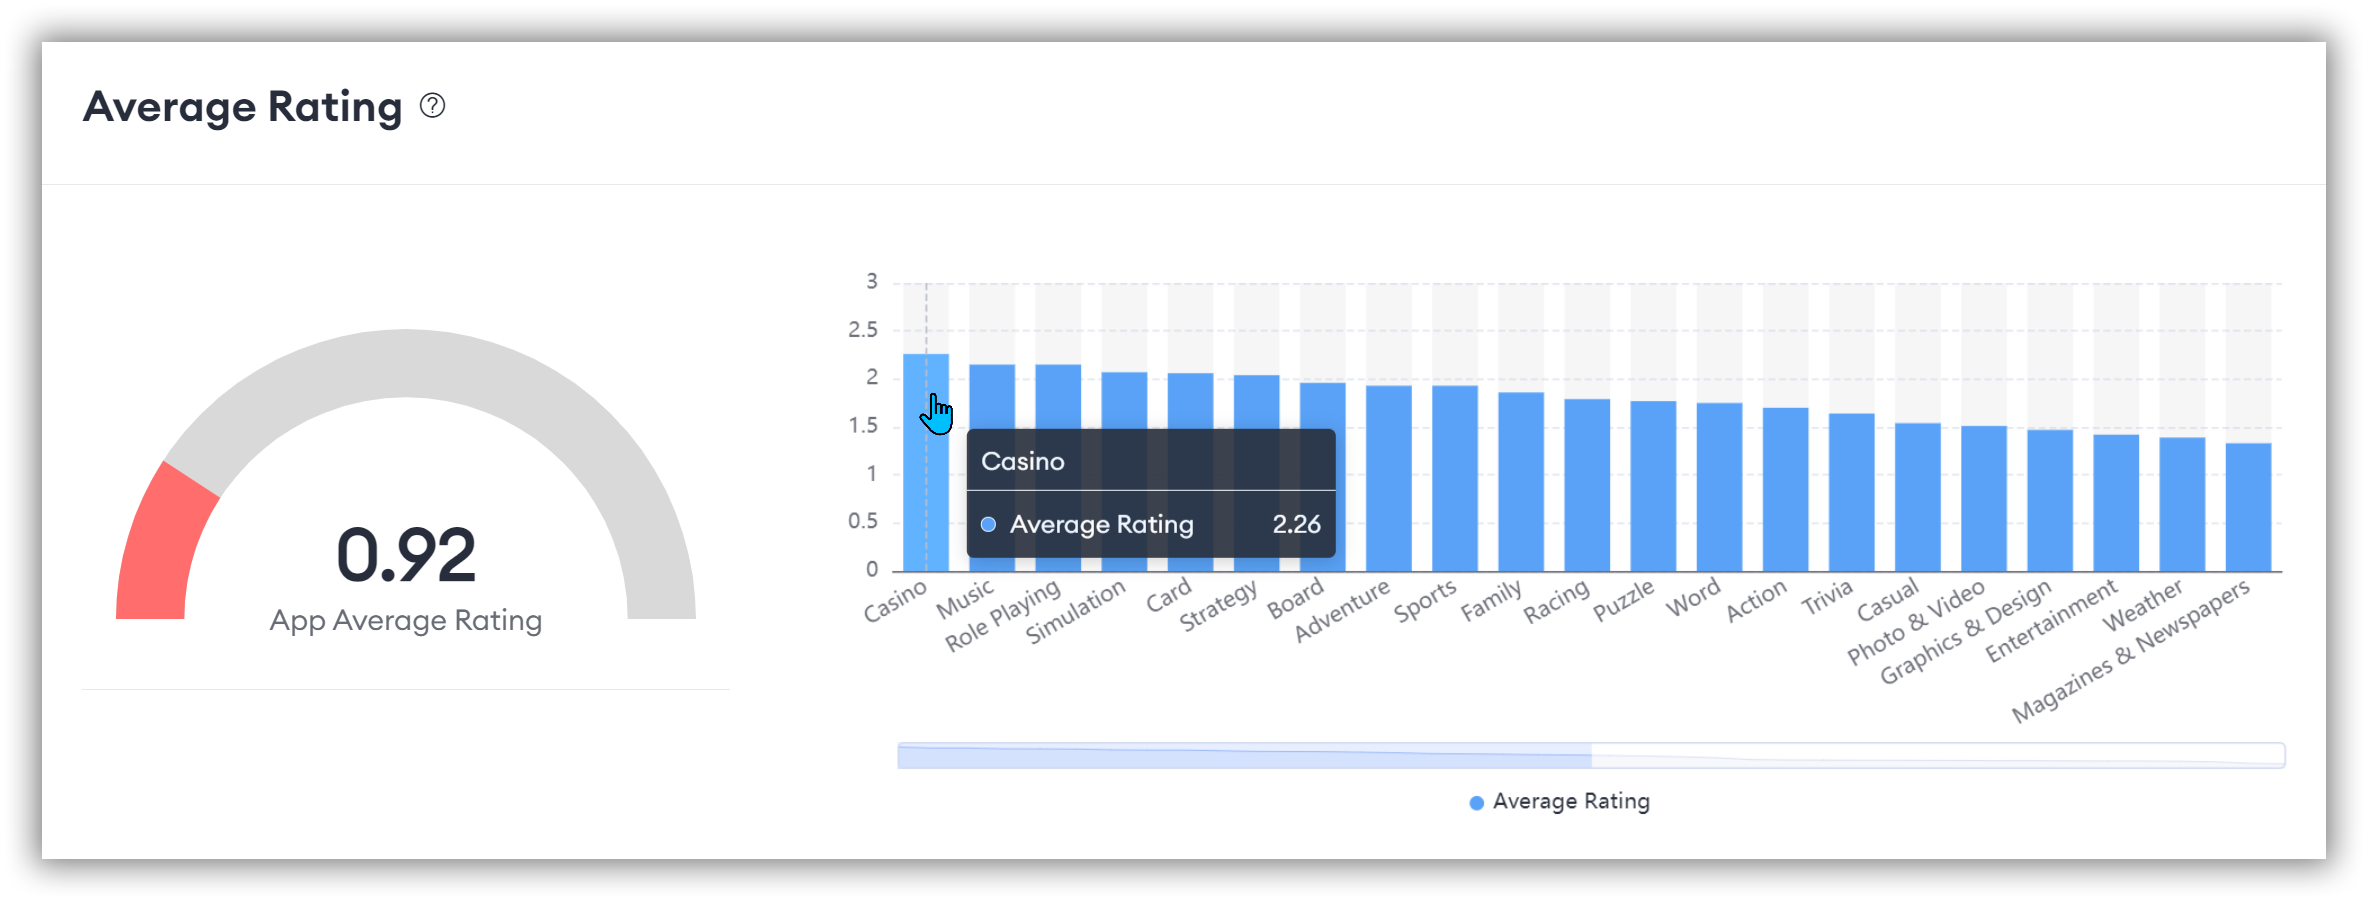
These two sections complement each other, providing users with a comprehensive quality assessment tool from overall to niche markets.
App Average Rating provides the average rating of all apps, helping users evaluate the overall quality level of apps in the market.
Average Rating of Specific Category allows for in-depth analysis and comparison within niche markets.
By examining the average ratings of different categories, users can more effectively target their market positioning and product development. For instance, categories with higher ratings may indicate higher user demand and better market opportunitie
Search Top Keyword Analysis
It displays the top keywords in the target platform and country. You can directly filter the category you want to view using the filter box in the upper left corner.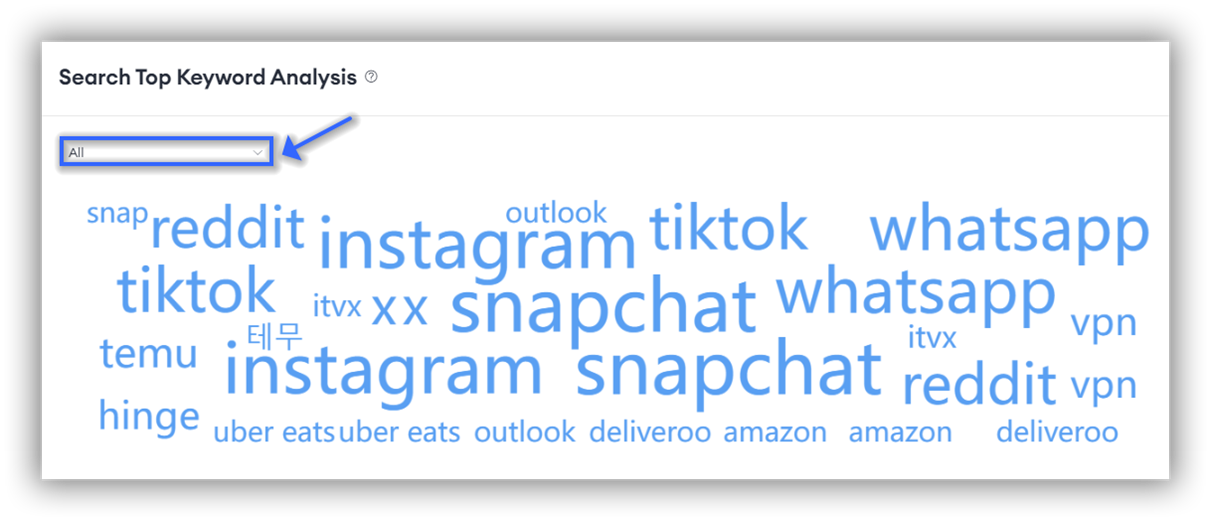 Through Search Top Keyword Analysis, users can understand current market user demands and interests.
Additionally, based on the hot keyword data, users can optimize their app descriptions and keywords to improve search rankings and download volumes.
App Price Proportion
App Price Proportion displays the proportion of paid or free apps among available apps in the selected country and market on the last day of the monthly update.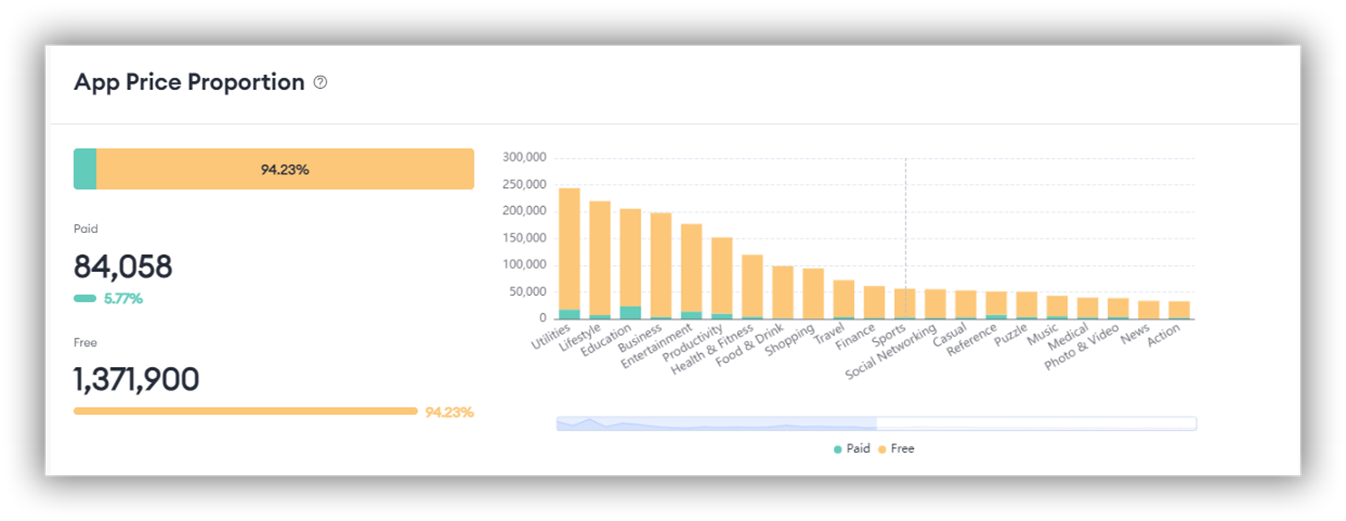
Displaying the proportion of paid or free apps among available apps in the selected country and market on the last day of the monthly update can help users formulate reasonable pricing strategies.
By understanding the app price proportions in different markets, users can perform market segmentation and launch different products and pricing strategies tailored to different markets.
Market Segment
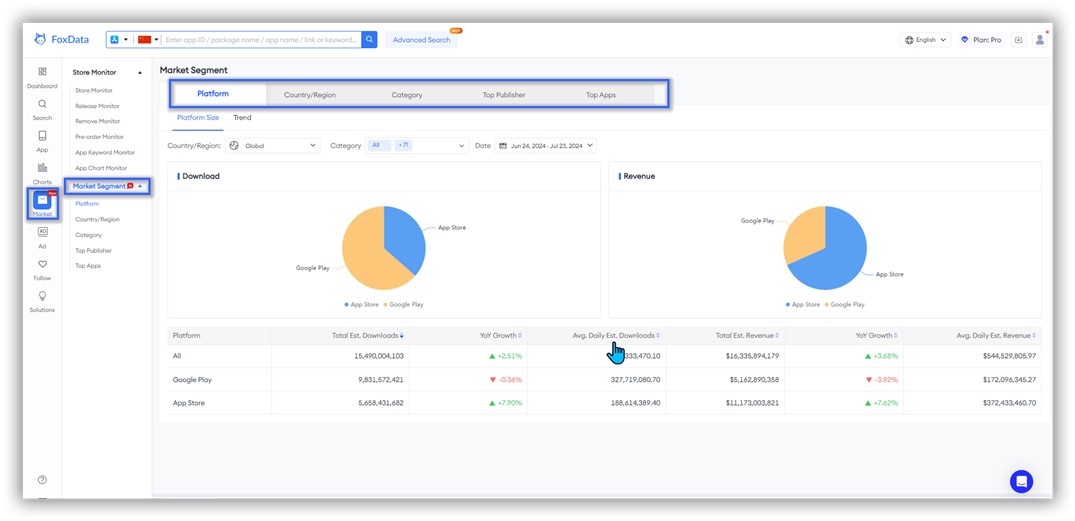
Our platform has also added the Market Segment feature to assist you further in market research. You can combine this feature with the previous sections to simplify your market research process and deepen your market insights.Market Segment will provide size and trend data across five dimensions: Platform, Country/Region, Category, Top Publisher, and Top Apps.
💡 Note: All five dimensions can be filtered by platform, country, and date.
Platform
Understanding the market size and trends across different platforms (such as iOS and Android) can help users decide where to launch or optimize their apps.
Platform Size
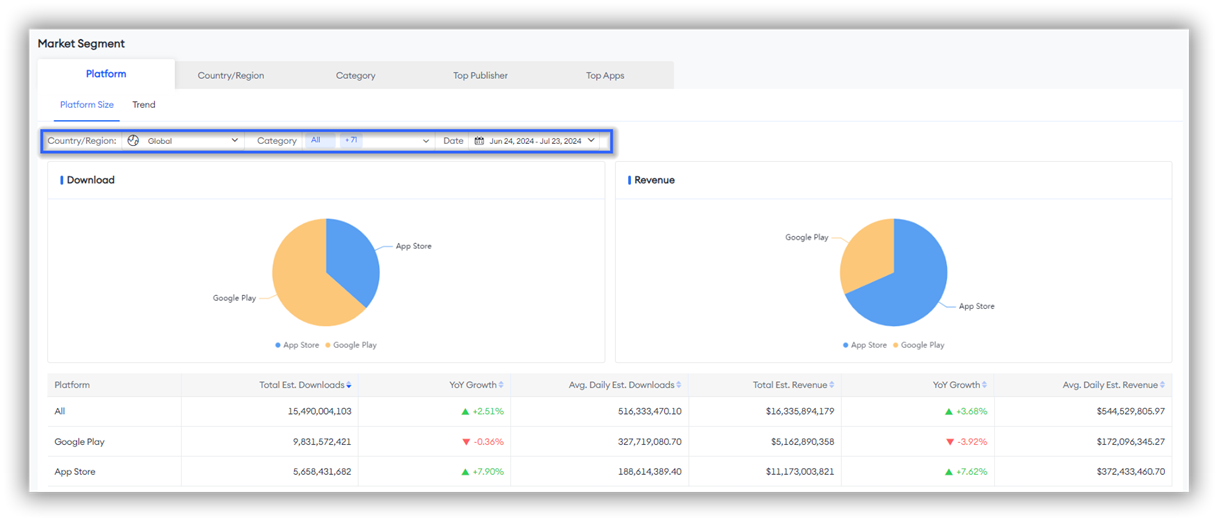
You can view Download and Revenue data for all apps or specific categories on the App Store and Google Play globally or in different countries.
Simply filter by Country/Region, Category, and Date to get clear pie charts and the specific data you need.
Trend
After understanding the specific platform size, you can also view the trends over time. This will help users predict future market changes and adjust their strategies accordingly.
- Downloads are represented using bar charts.
- Revenue is represented using line charts.
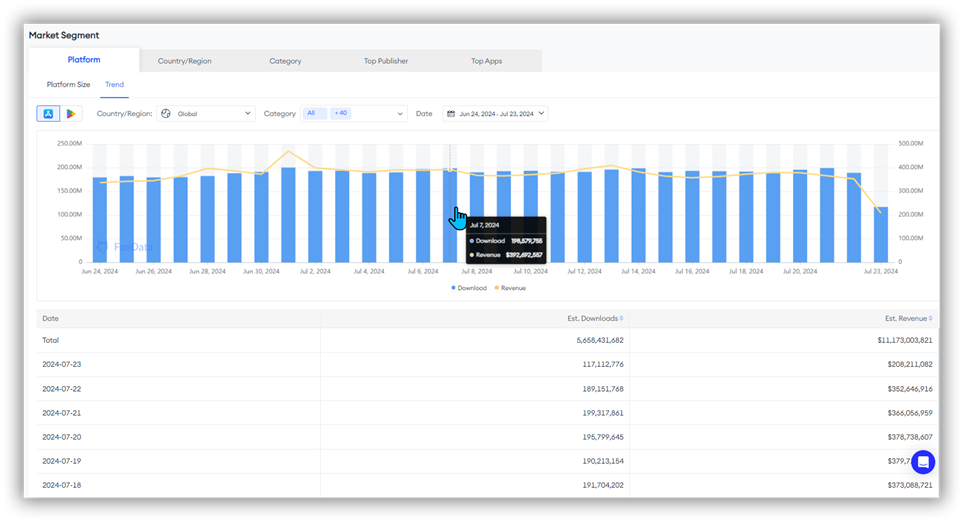
In addition to the specific trend charts, detailed time-corresponding data is provided below to assist you in in-depth market research.
Country/Region Analysis
Analyzing market data from different countries or regions can help users identify high-potential markets and develop targeted market entry strategies.
Country/Region Size
This chart displays the Download/Revenue data for the selected country.
Simply filter by Platform, Download/Revenue, Country/Region, Category, and Date to get clear pie charts and the specific data you need.
The data blocks on the left correspond to the map on the right. You can hover over the map sections on the right to get specific Download/Revenue data.
Conversely, hovering over the data blocks on the left will darken the corresponding map sections.
Scrolling down will provide you with detailed data.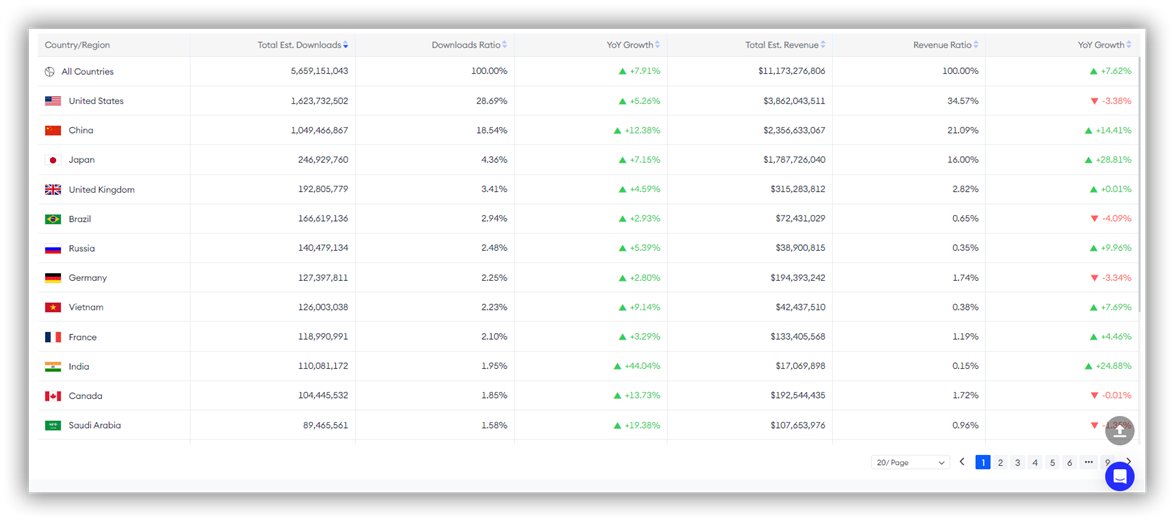 💡 Note: The default display shows Download data. If you want to view Revenue data, don't forget to switch using the filter option in the upper left corner.
Trend
If you have specific countries you want to focus on or have identified potential markets through the Country Size analysis, be sure to try the Trend feature. TThis can help you monitor market trends further, identify high-potential markets, and make more informed market decisions.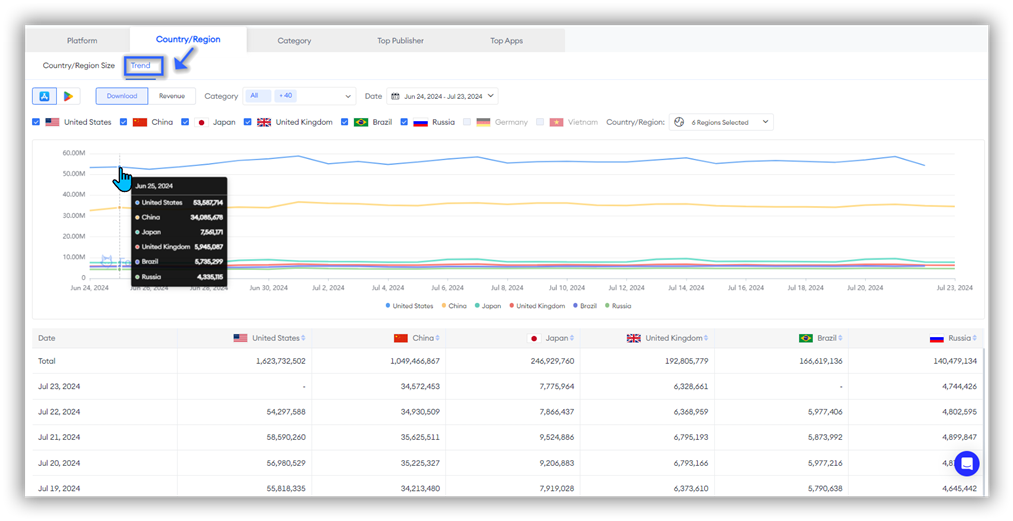 💡 Note: This feature currently supports viewing trends for up to 6 countries.
👏 Expert Tips: If you have identified a target market but are unsure about the category of apps to develop or invest in, or if you have identified both the target market and app category but want to gather more insights, we recommend combining your research with the Mobile App Global Benchmarks and Trends Report. This report will help you discover new growth opportunities with comprehensive app market data.
The Mobile App Global Benchmarks and Trends Report provides Available App Distribution, Statistics of Release/Remove Apps in Category, Number of Pre-order Apps, Monthly Update Frequency, Average Rating, Search Top Keyword Analysis, and App Price Proportion.
Additionally, you can continue your research with the Category dimension of this feature, which will be introduced next.
Category Analysis
Understanding the market size and trends across different app categories can help users identify market opportunities within specific categories.
Category Size
Filter by Platform, Download/Revenue, Country/Region, Category, and Date to get clear data charts and the specific details you need.
💡 Note: Besides filtering by Category, you can also scroll the blue data axis below to view more category data directly.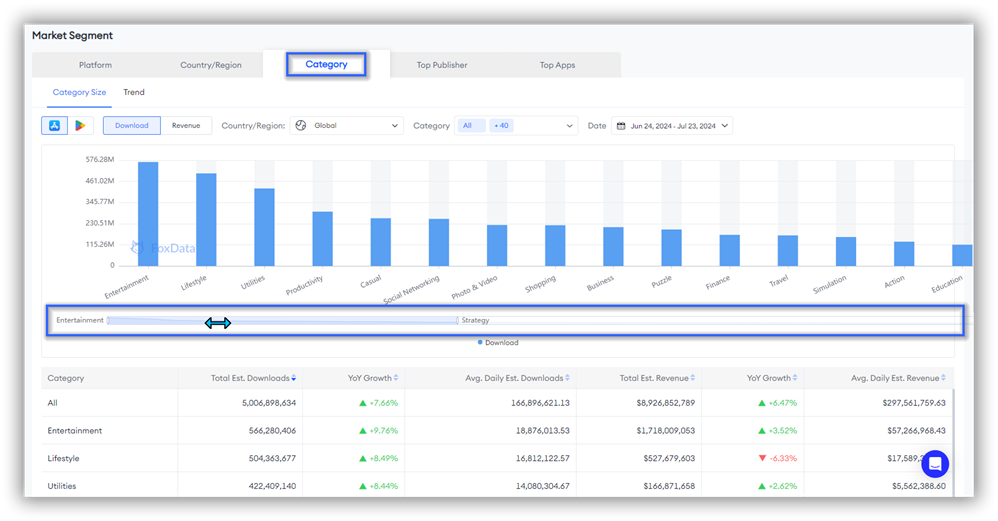
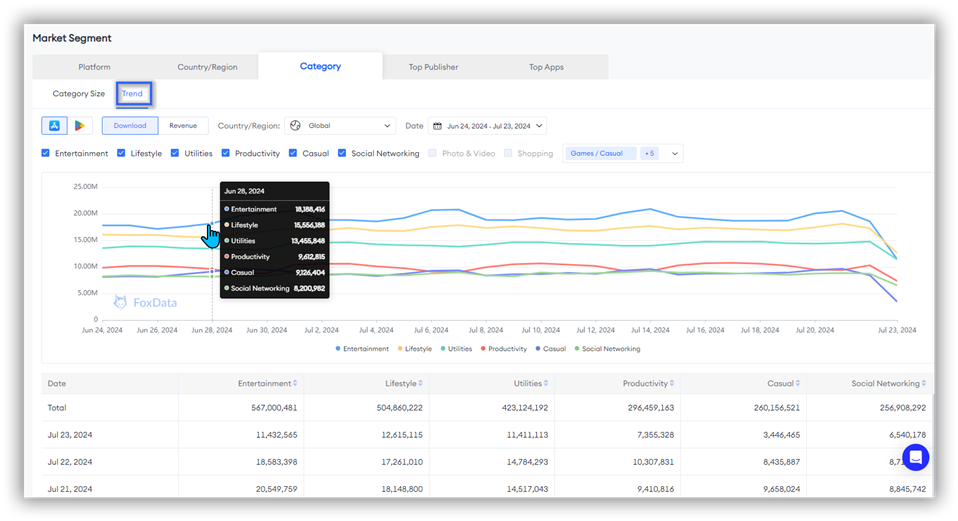
Trend
You can select up to 6 categories to further study the trend changes in Download/Revenue for your target categories.
Top Publisher
This dimension helps users identify top publishers, understand their successful strategies and market influence, and provide references for their market strategies.
Top Publisher Size
By analyzing data on top publishers, users can assess the distribution of market share, understand market concentration, and the competitive landscape.
Additionally, it can provide potential partners or investment targets, helping users expand business collaborations.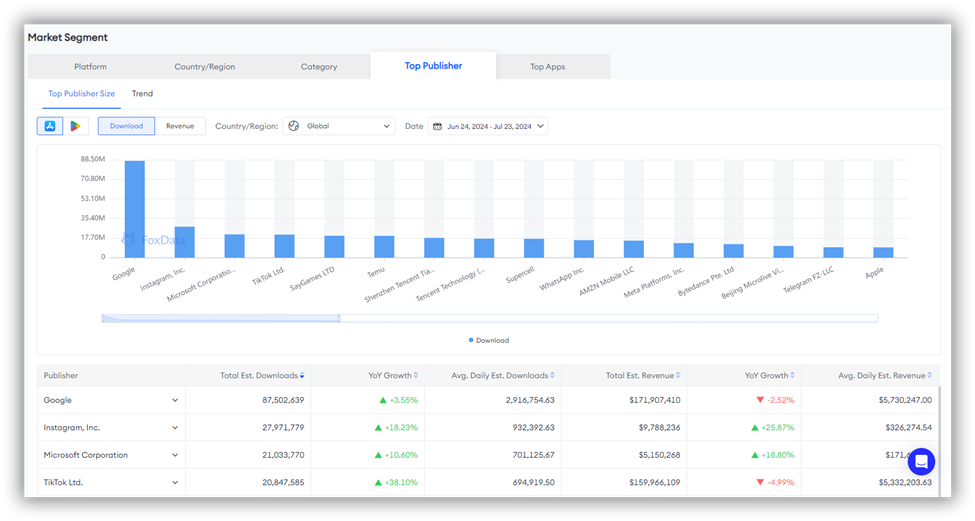 👏 Expert Tips: If you aim to study the strategies of top publishers for reference, the default view usually shows global publishers.
We recommend not forgetting to filter for the target market at the top of the chart to view the top publishers in the target market. The market strategies of top publishers in the target market will be more valuable for reference.
By studying the success stories and market strategies of top publishers, users can learn from their experiences to optimize their own market strategies and product development.
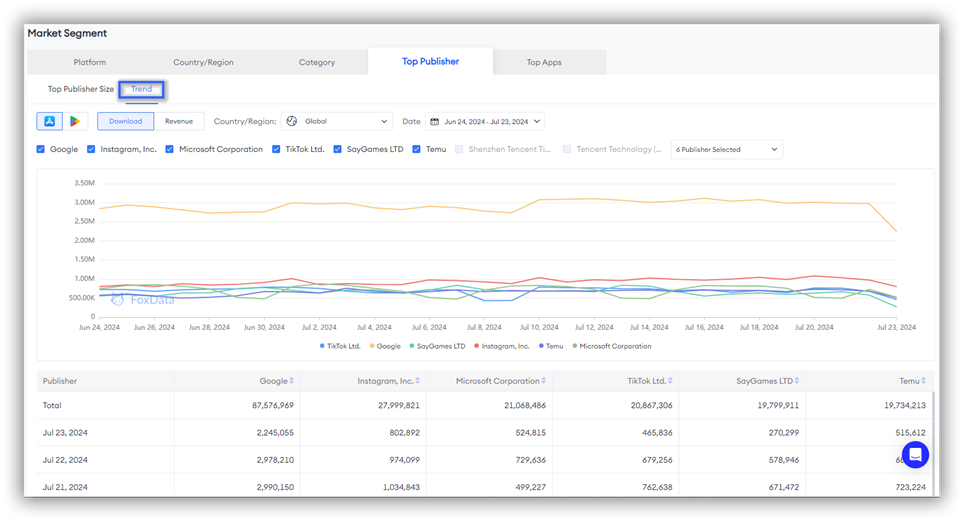
Trend
By combining trend data of top publishers, users can further predict future market changes, plan ahead, and seize market opportunities.
You can select up to 6 publishers to view the specific trend changes in their Download/Revenue over a certain period.
Top Apps
Top Apps Size
By analyzing the market size of top apps, users can understand the most popular app types and features in the current market, identify user needs, and market trends.
If you have a specific target market and target category, do not forget to filter at the top of the chart.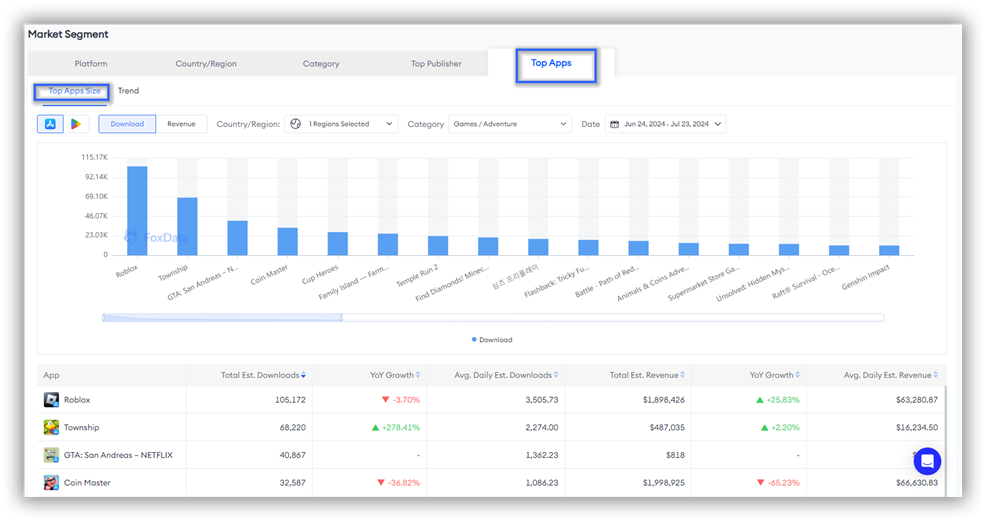
Trend
FoxData also supports providing trend data for the downloads and revenue of top apps.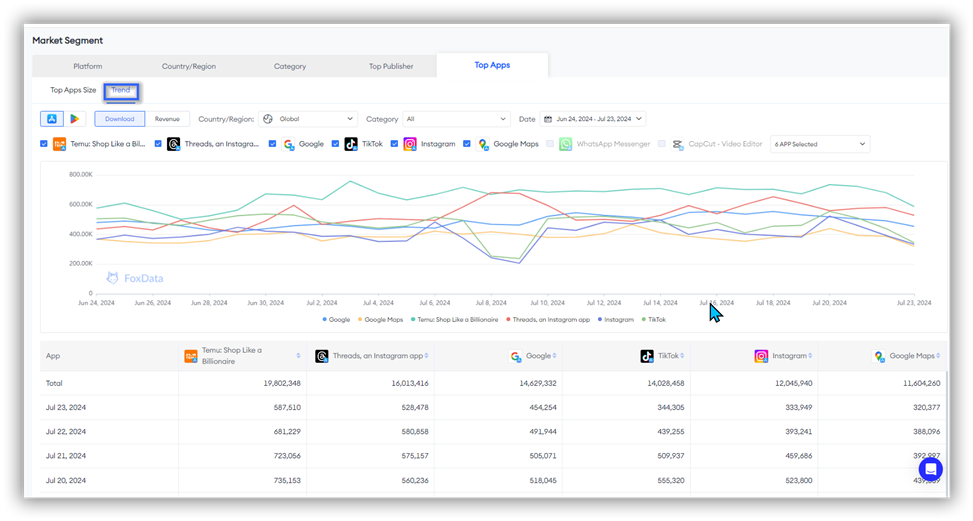
After selecting the dimensions you want to focus on, such as Download/Revenue, Country/Region, Category, and Date, you can use trend charts to identify fluctuation points in the downloads and revenue of top apps. These fluctuation points may correspond to market activities, marketing campaigns, version updates, or other external factors.
You can start from here to analyze the market performance of top apps, develop more effective competitive strategies, and increase your market share.
👏 Expert Tips: We recommend combining Top Publisher and Top Apps data. This allows users to gain comprehensive market insights from both the publisher and app levels, understanding the overall competitive landscape and the specific performance of segmented markets.
These two features are the main additions in this update. They not only help you assess the overall quality and user satisfaction of the market but also enable in-depth analysis and comparison of niche markets. Additionally, they assist you in adjusting product development and market strategies to improve user satisfaction and market competitiveness.
Don't hesitate—dive in and try out Mobile App Global Benchmarks and Trends Report. and Market Segment now!


