Managing ASO, whether as a solo manager or part of a team, involves keeping track of updates to your app listings in various countries all year. It can be challenging to identify which updates have had a real impact on your business and focus on optimizing those further.
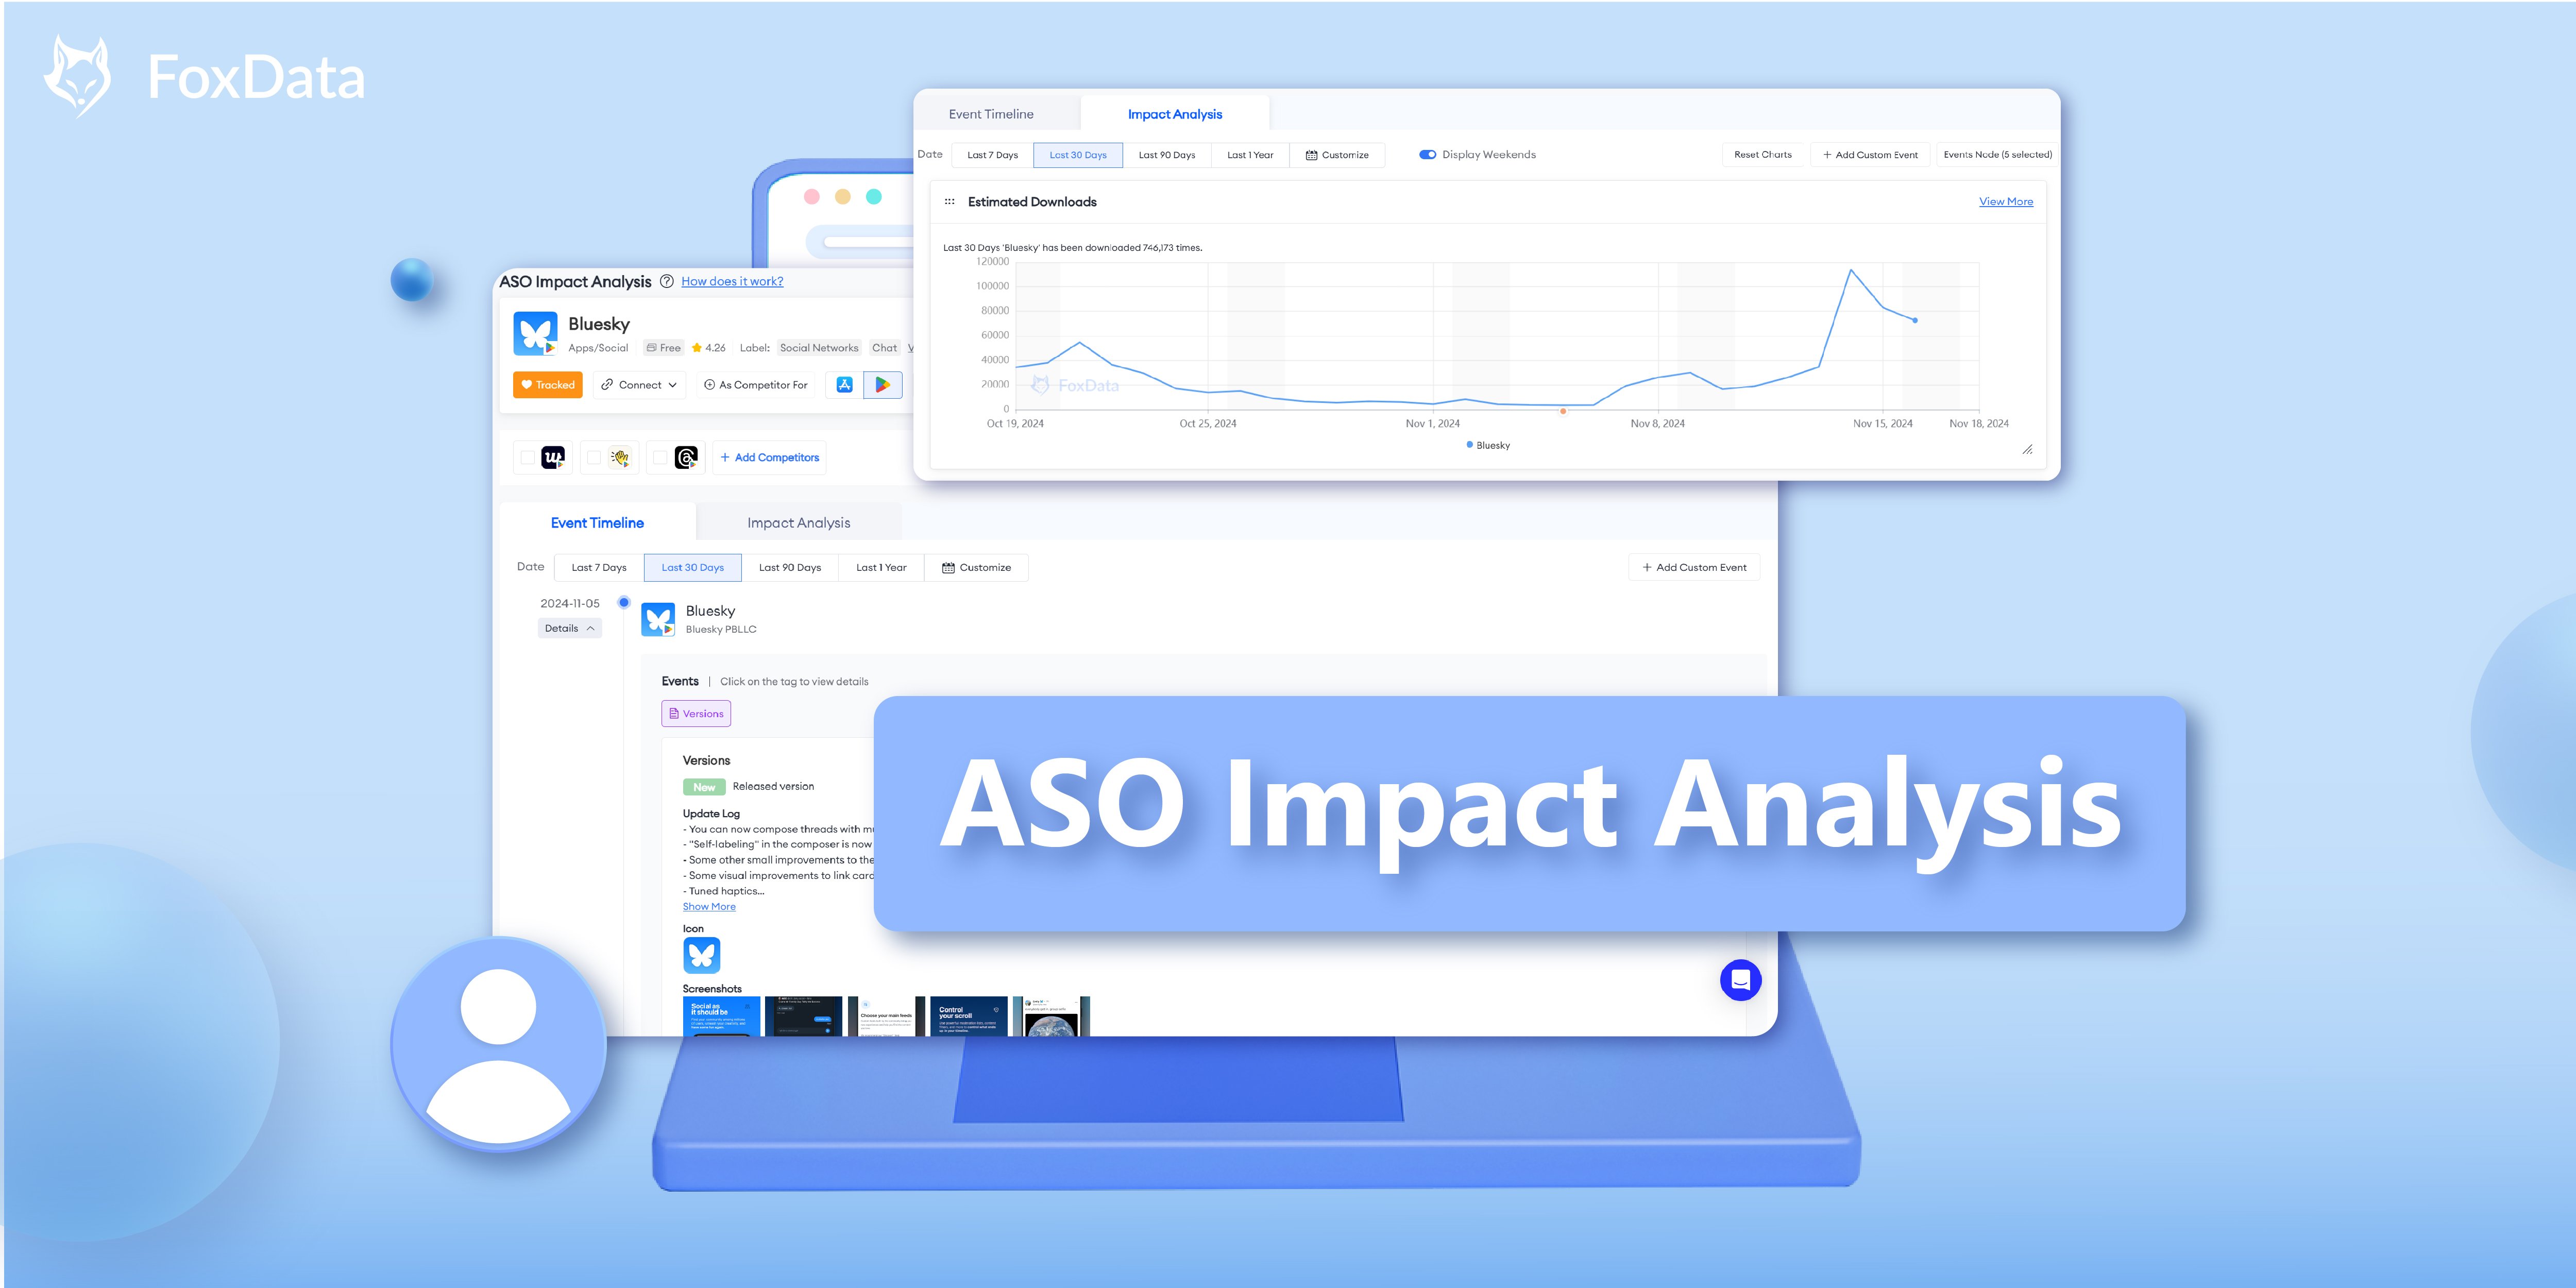
"ASO Impact Analysis" includes "Event Timeline" and "Impact Analysis".
"Event Timeline" automatically identifies the change times for your "Text Metadata", "App Behavior" including Versions, In-App Events, In-App Purchases, Meta Ad Creatives, as well as Featured, and "Custom Events", detailing which aspects of the app store listing were modified.
"Impact Analysis" displays Estimated Downloads, Estimated Revenue, Category Ranking, Ranked Keywords Trend, Ratings Received, and Reviews Received associated with the "Event Timeline", helping you analyze data from multiple dimensions.
How to Use ASO Impact Analysis
To view key ASO Impact Analysis metrics and insights:
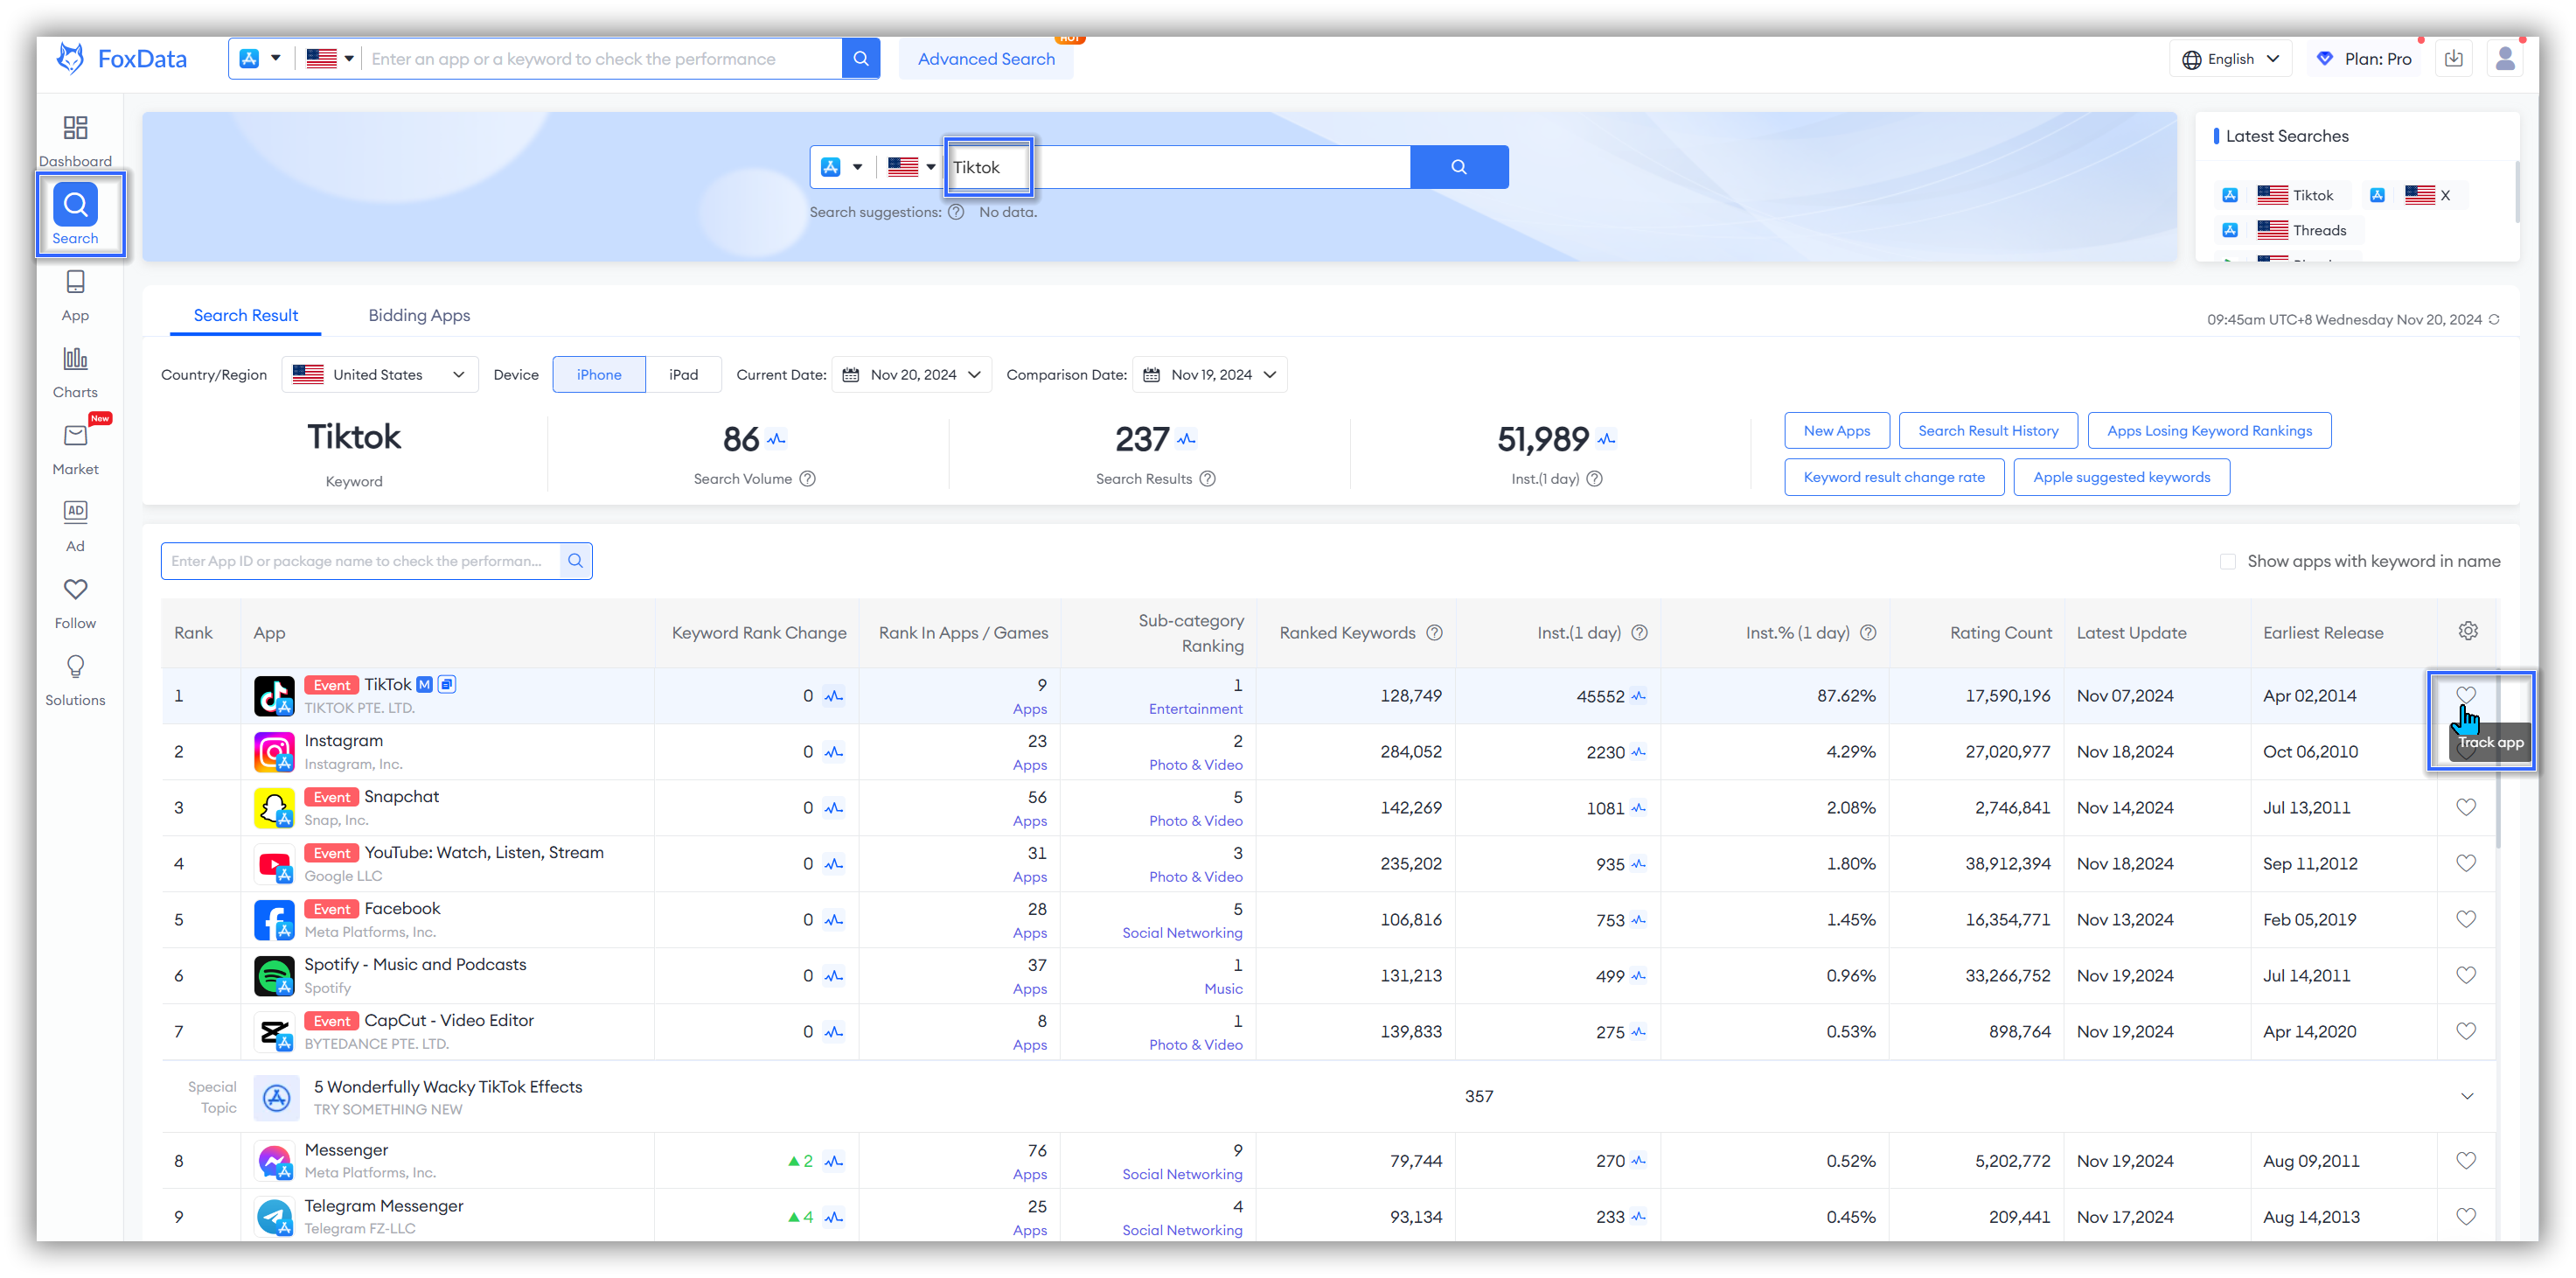
- Go to Dashboard > Search.
- Enter the app or game you'd like to analyze.
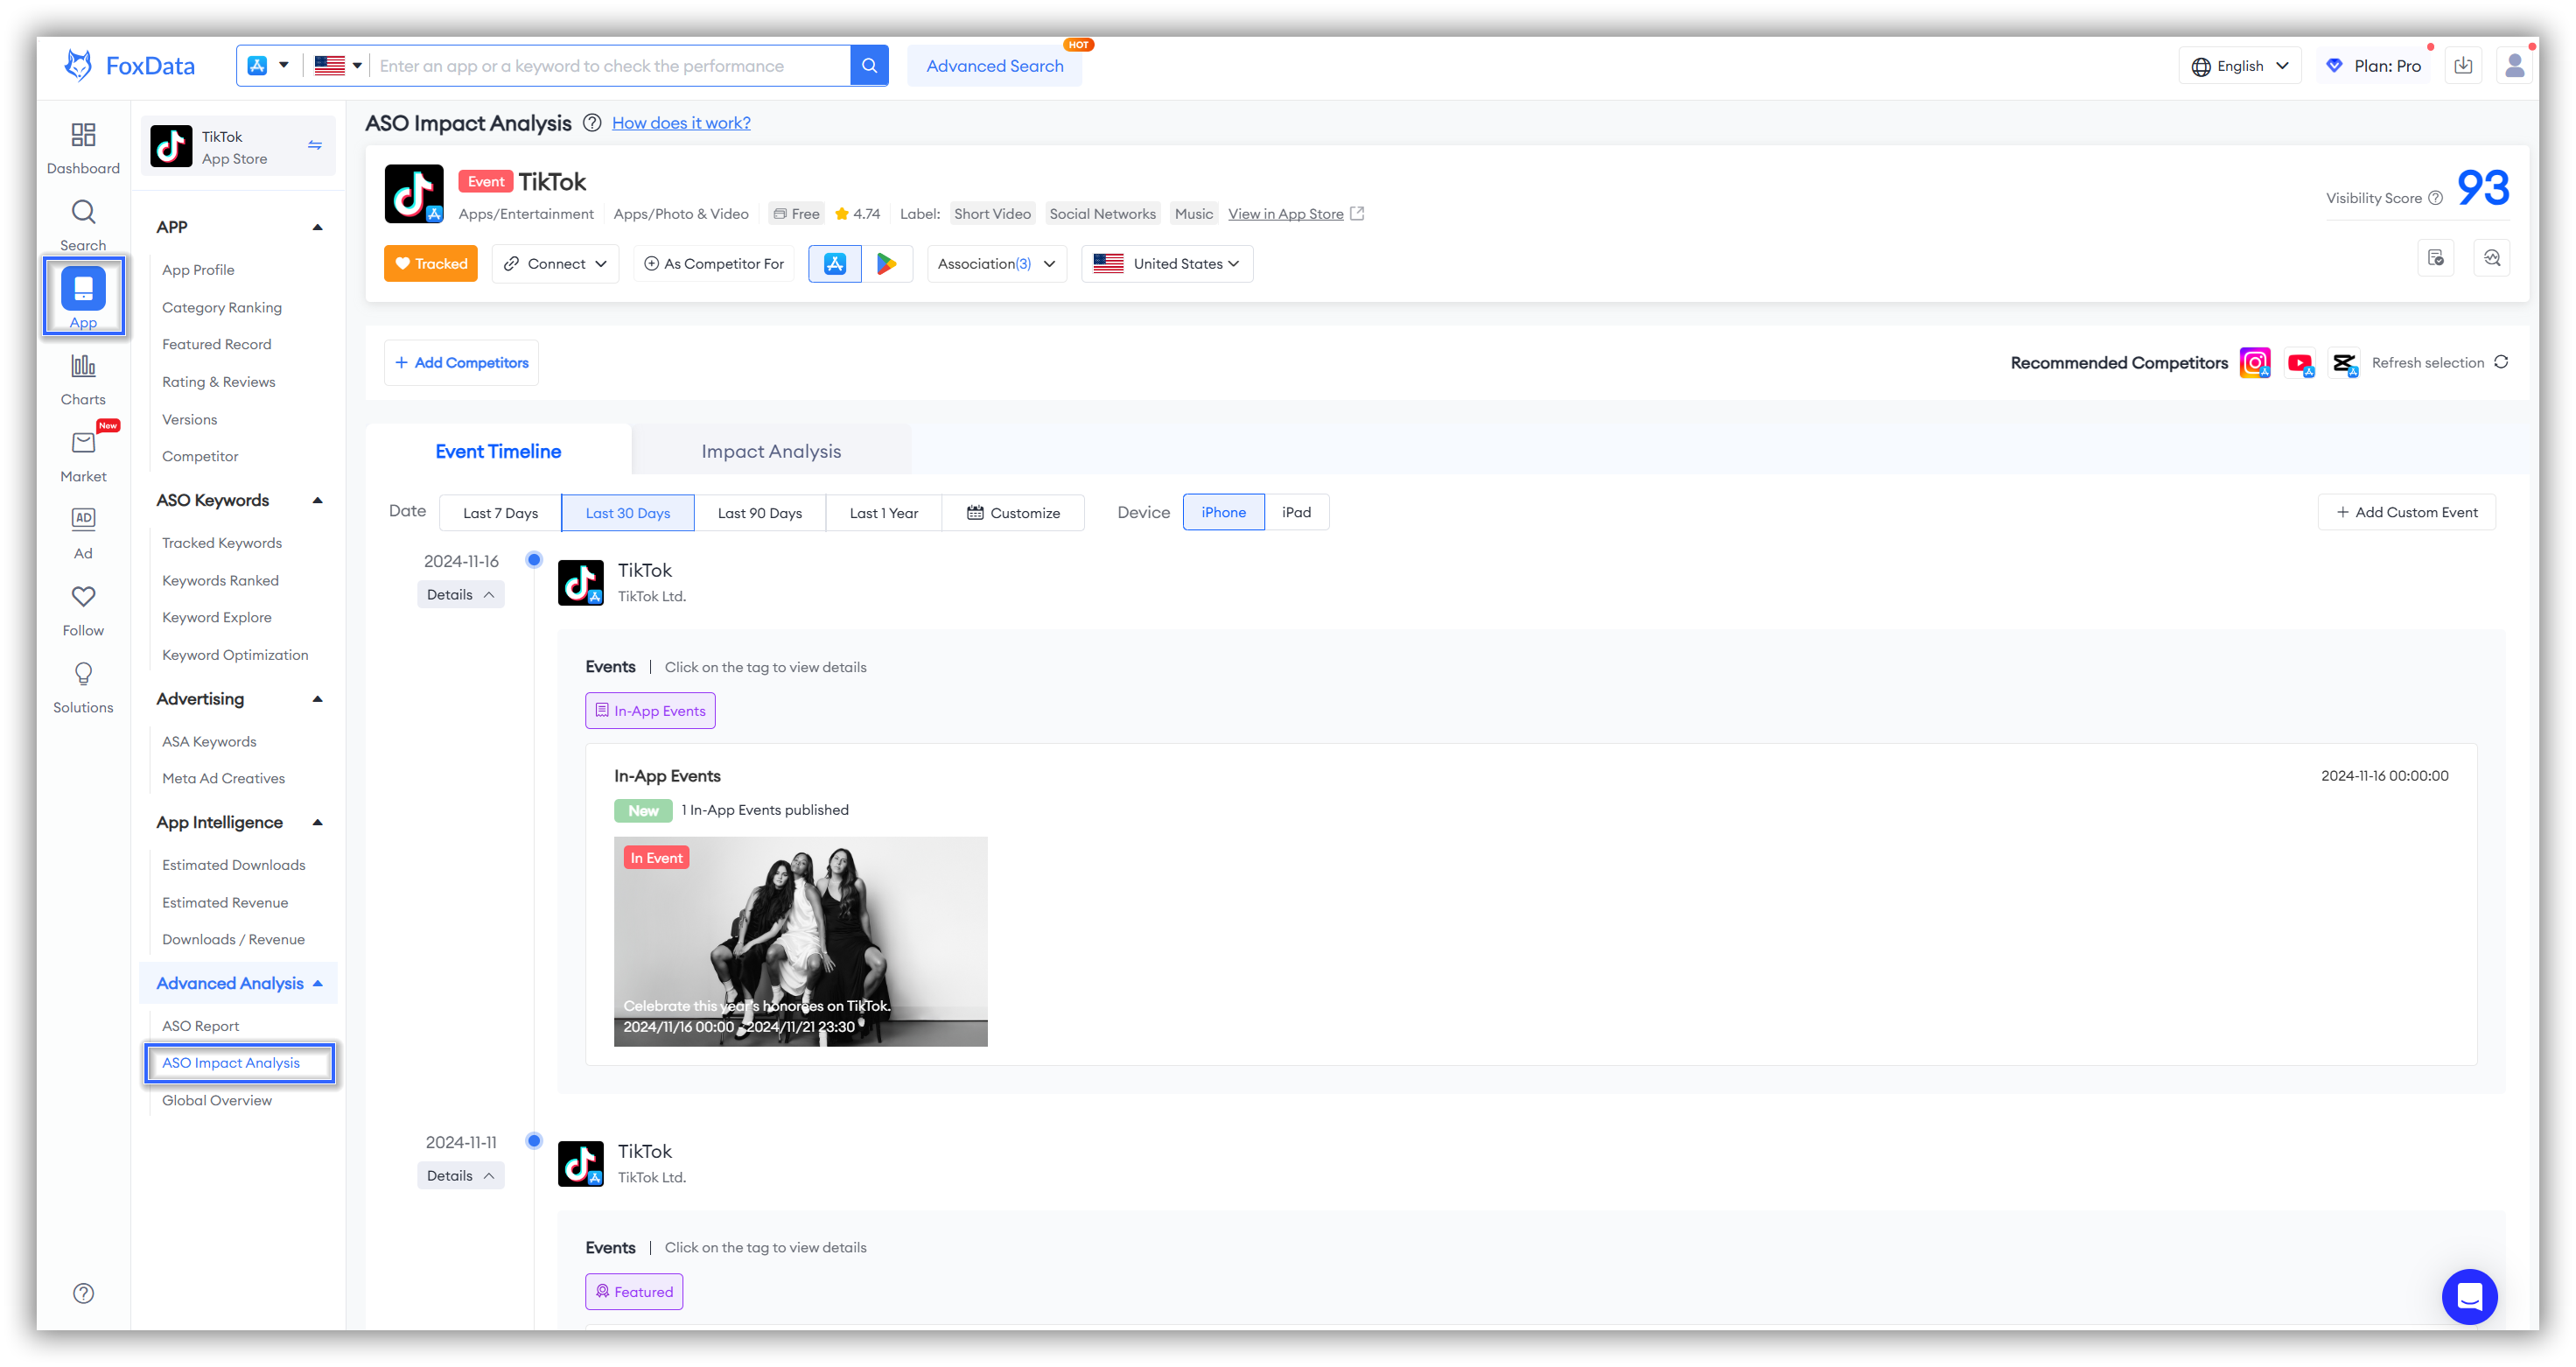
- To target your analysis, click "Track app" to reach the "App" overview page.
- To click "ASO Impact Analysis " and view the information of your tracking app.
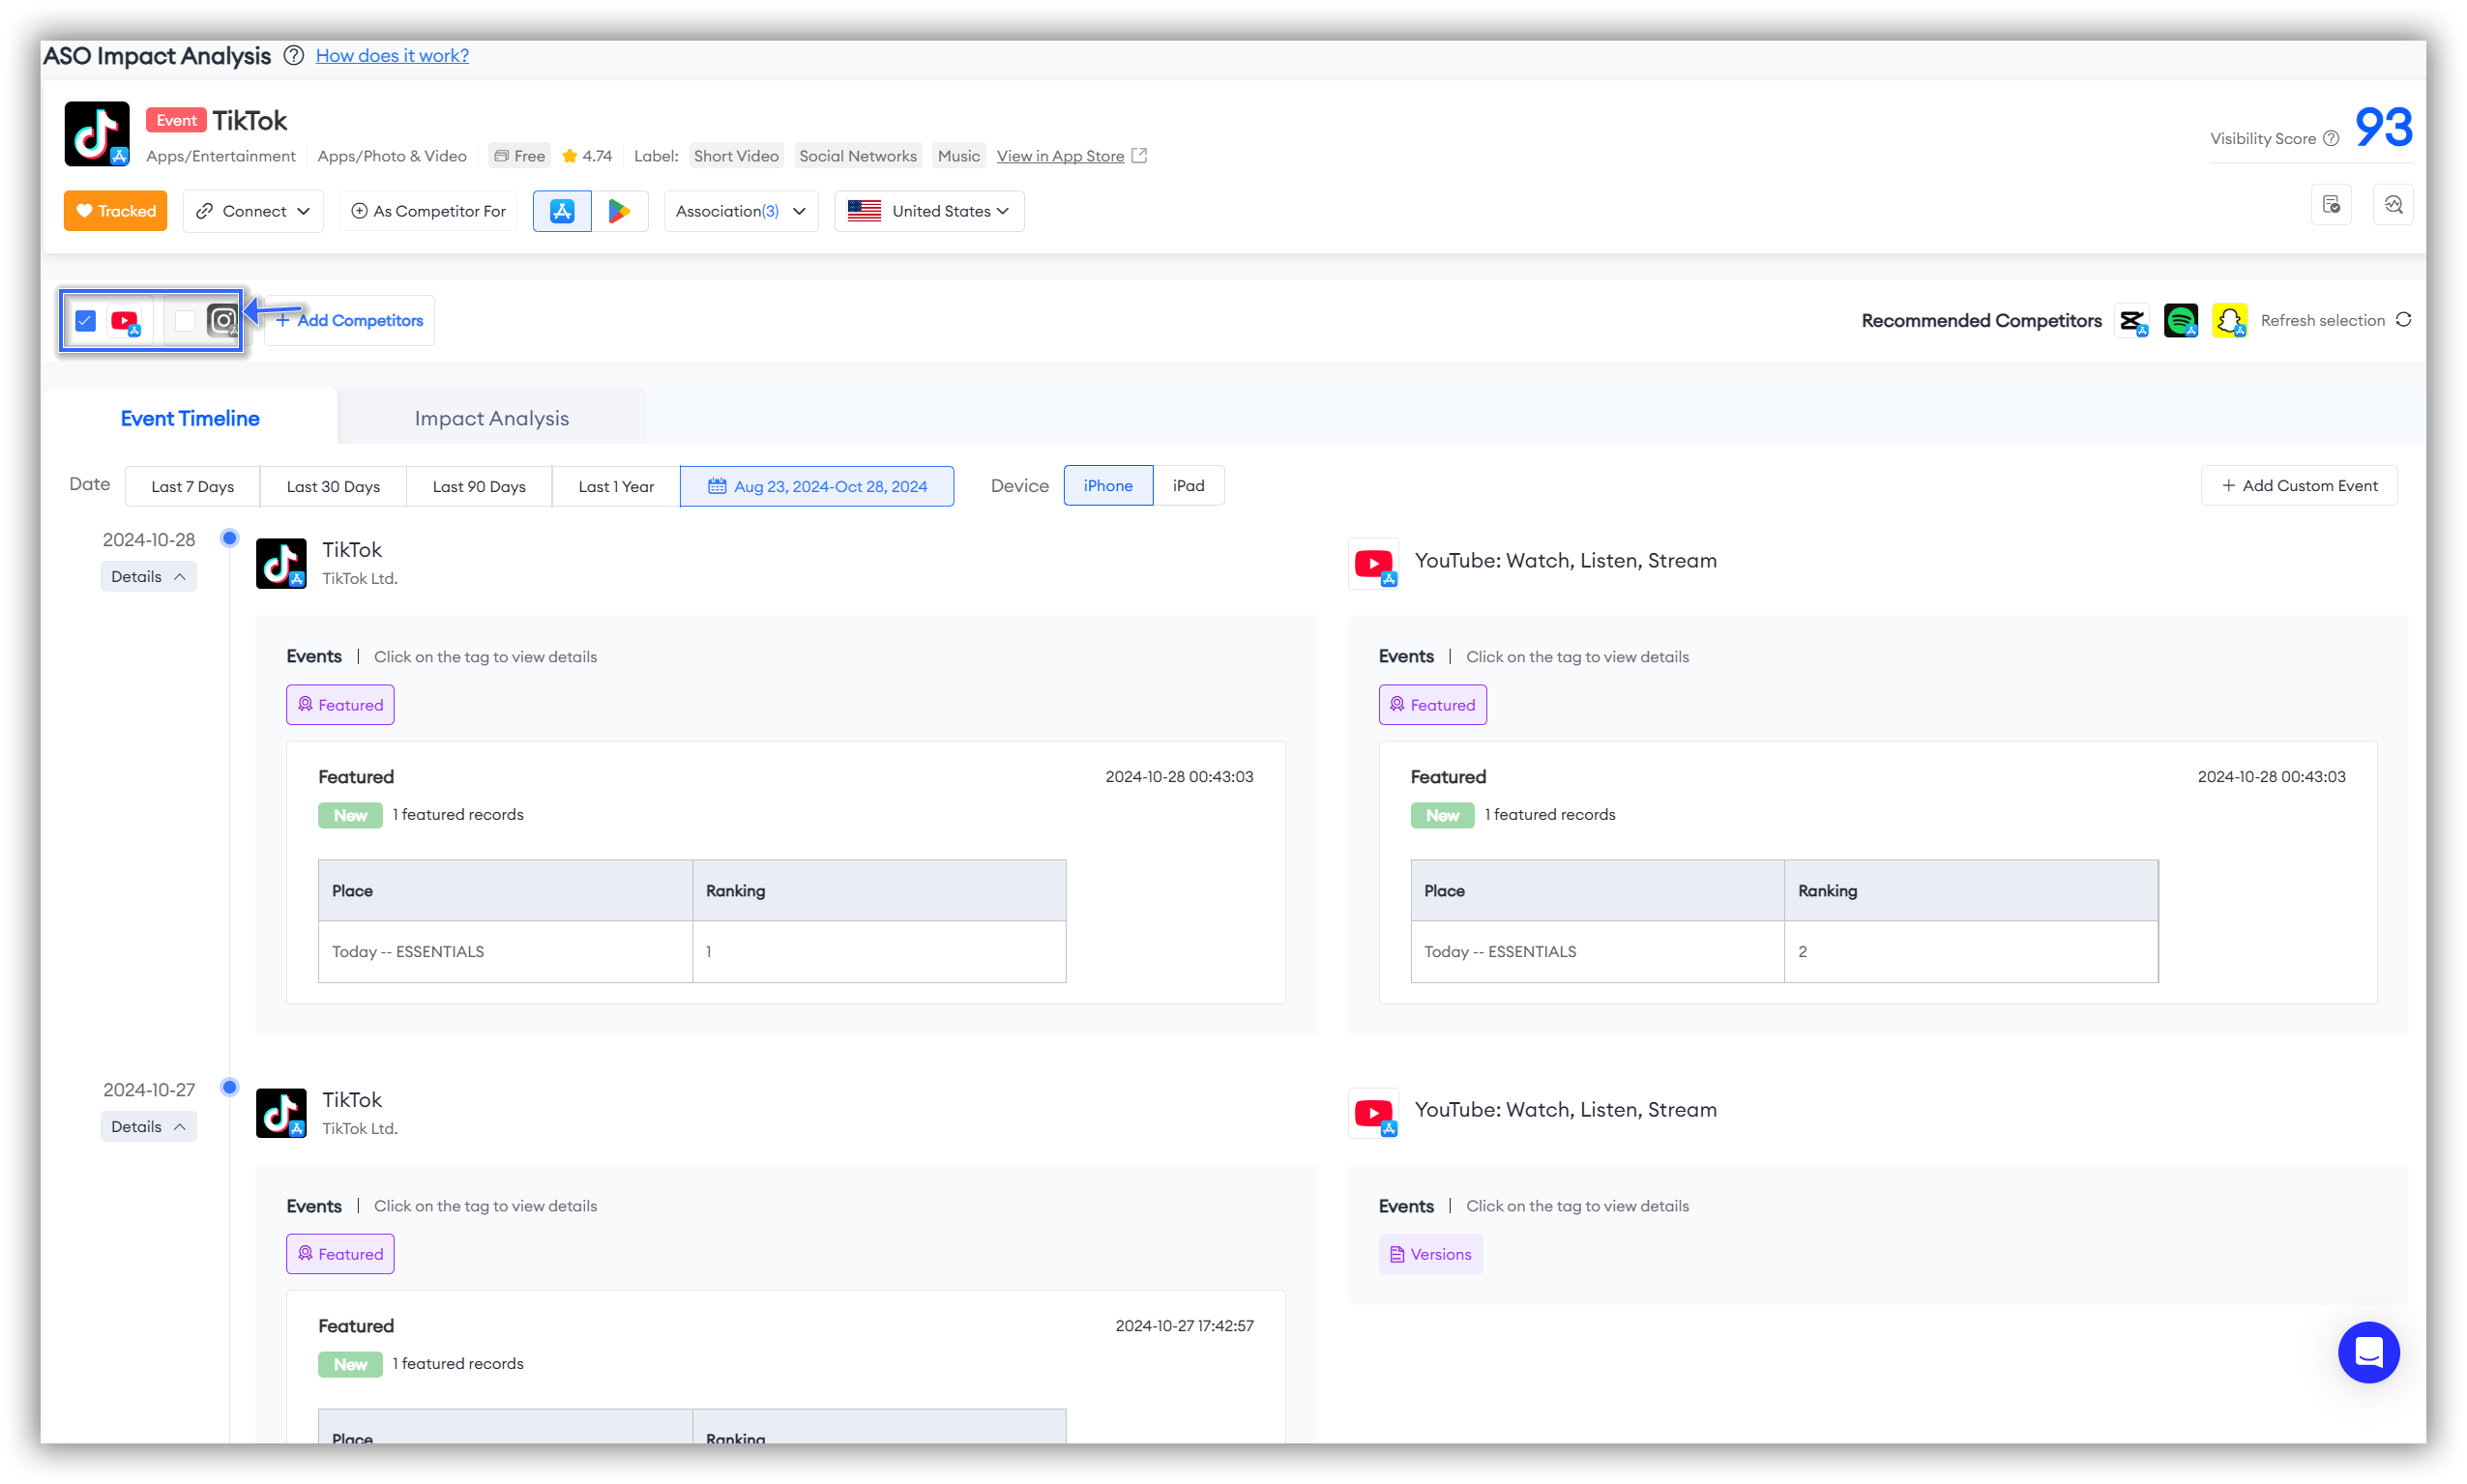
🗒️ Note: In the "ASO Impact Analysis" feature page, there are 3 automatically
recommended competitors in the top right corner, allowing you to directly study your competitors.
If you want to explore more competitors, simply click "Refresh Selection" to get additional options.
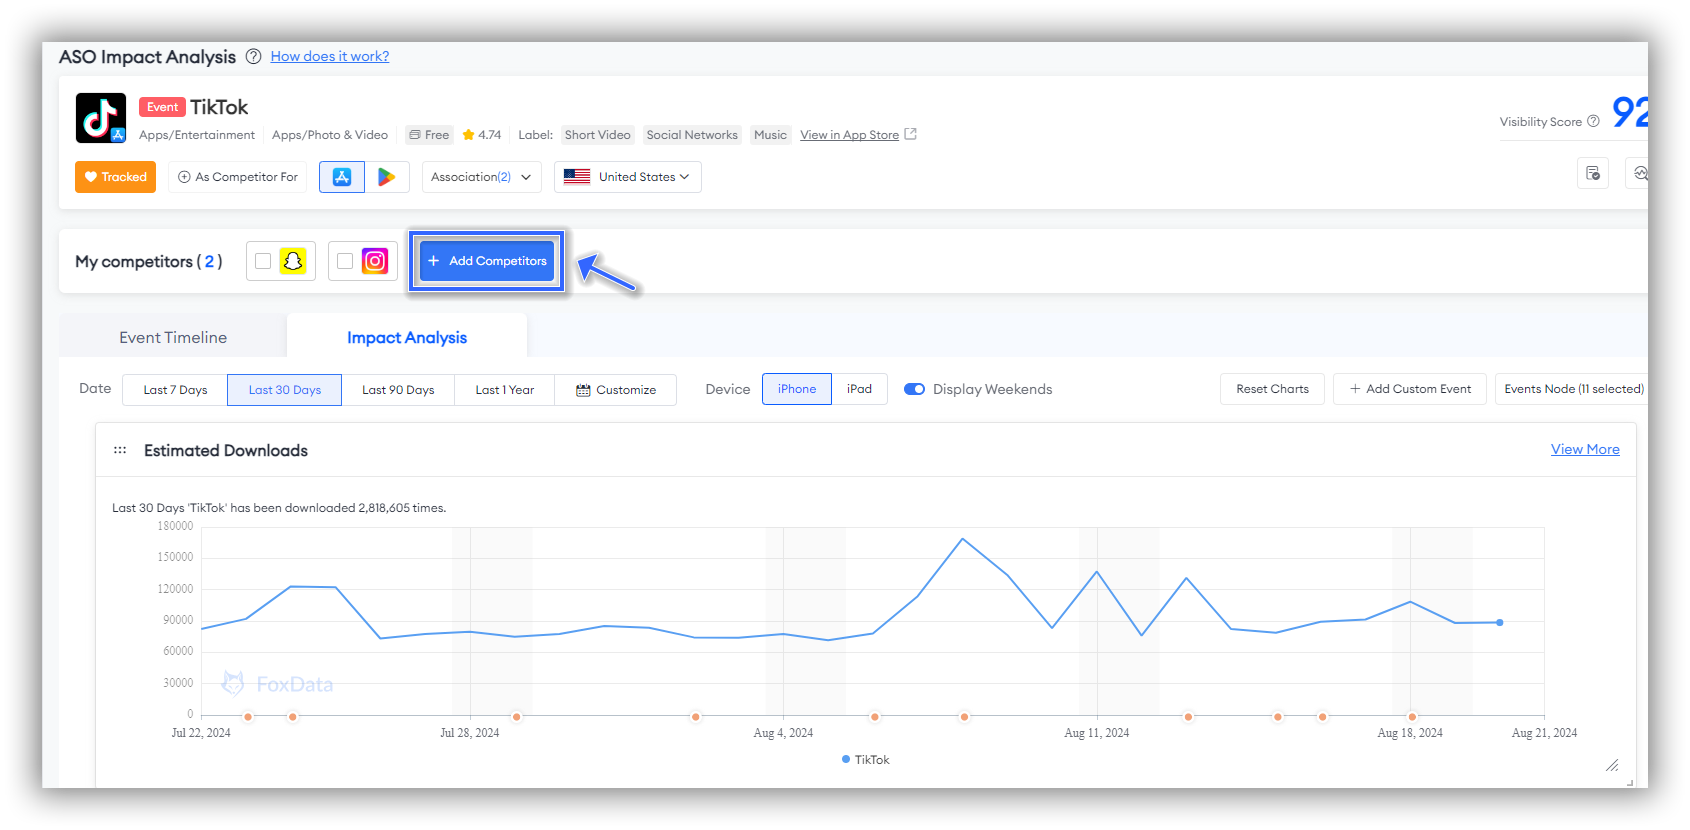
Apart from this, you can also choose "
+Add Competitors". This is different from "Recommended Competitors".
"Recommended Competitors" directly analyzes the competitor apps you have selected, while "+Add Competitors" allows you to choose 1 competitor app to compare across various dimensions directly in the "ASO Impact Analysis", as shown below:
Key Metrics & Insights
Event Timeline
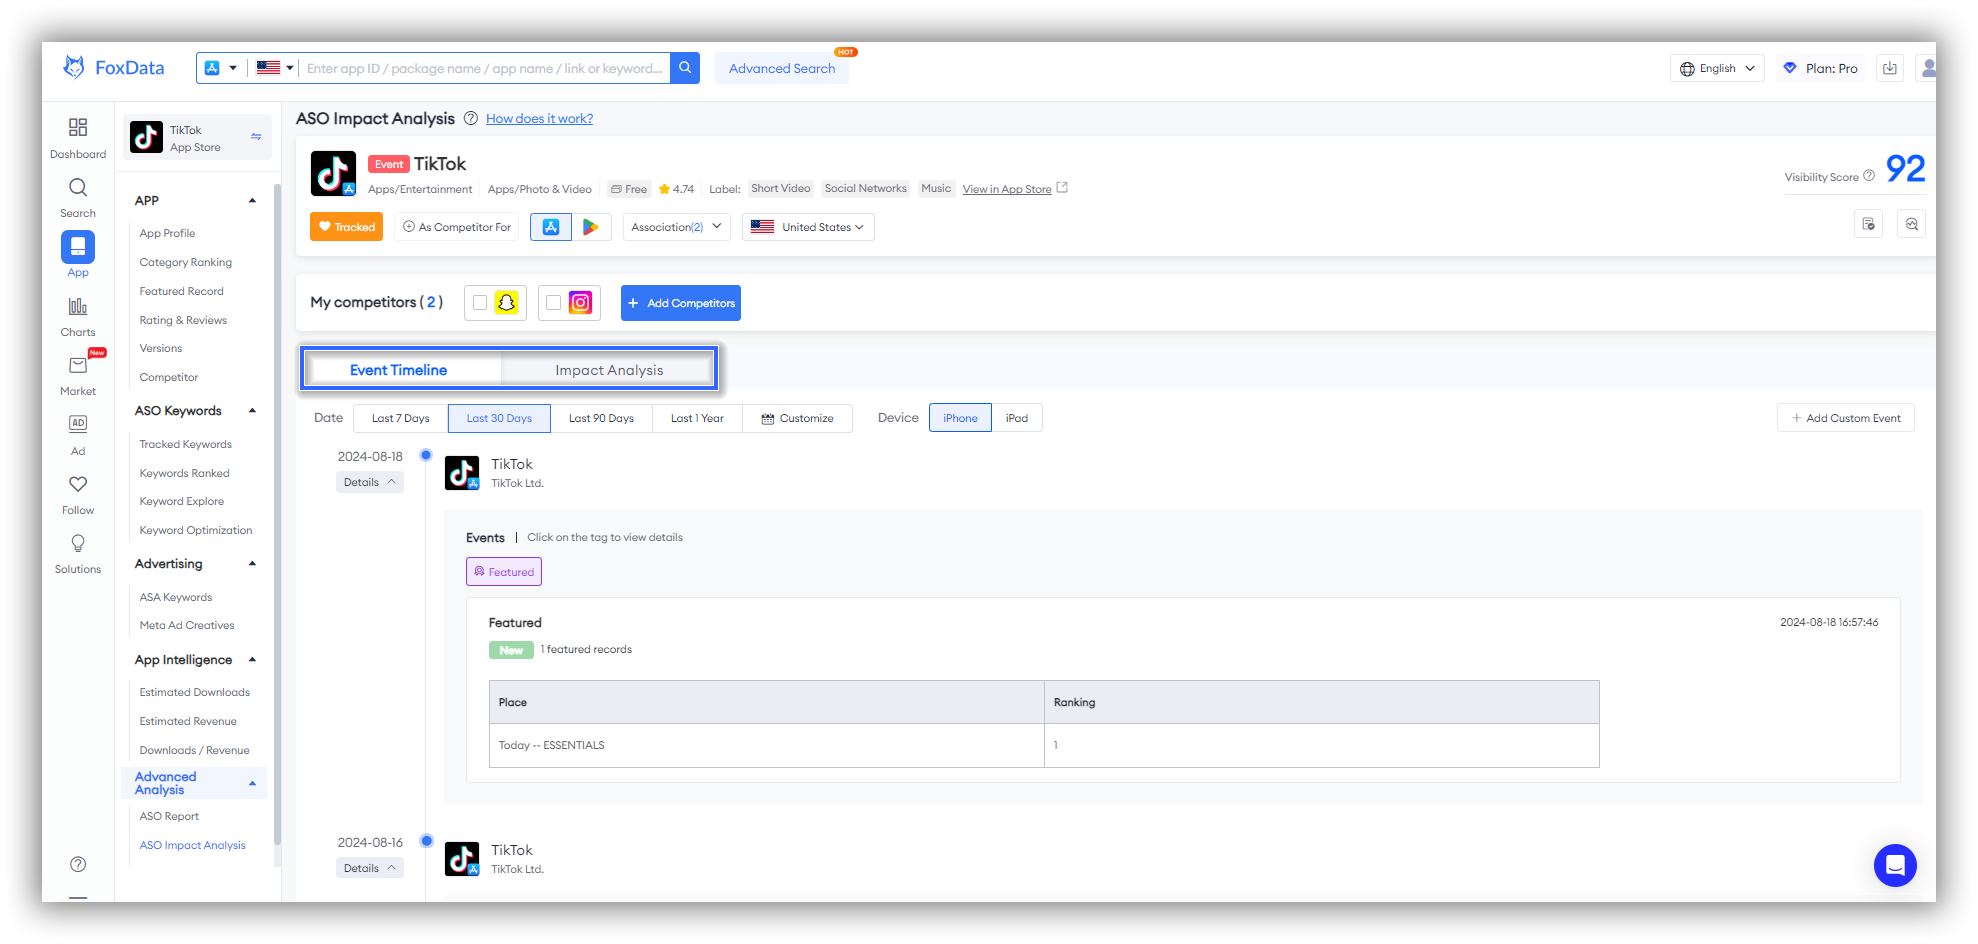
When you use the "ASO Impact Analysis" feature, the first section that automatically pops up is the "Event Timeline."
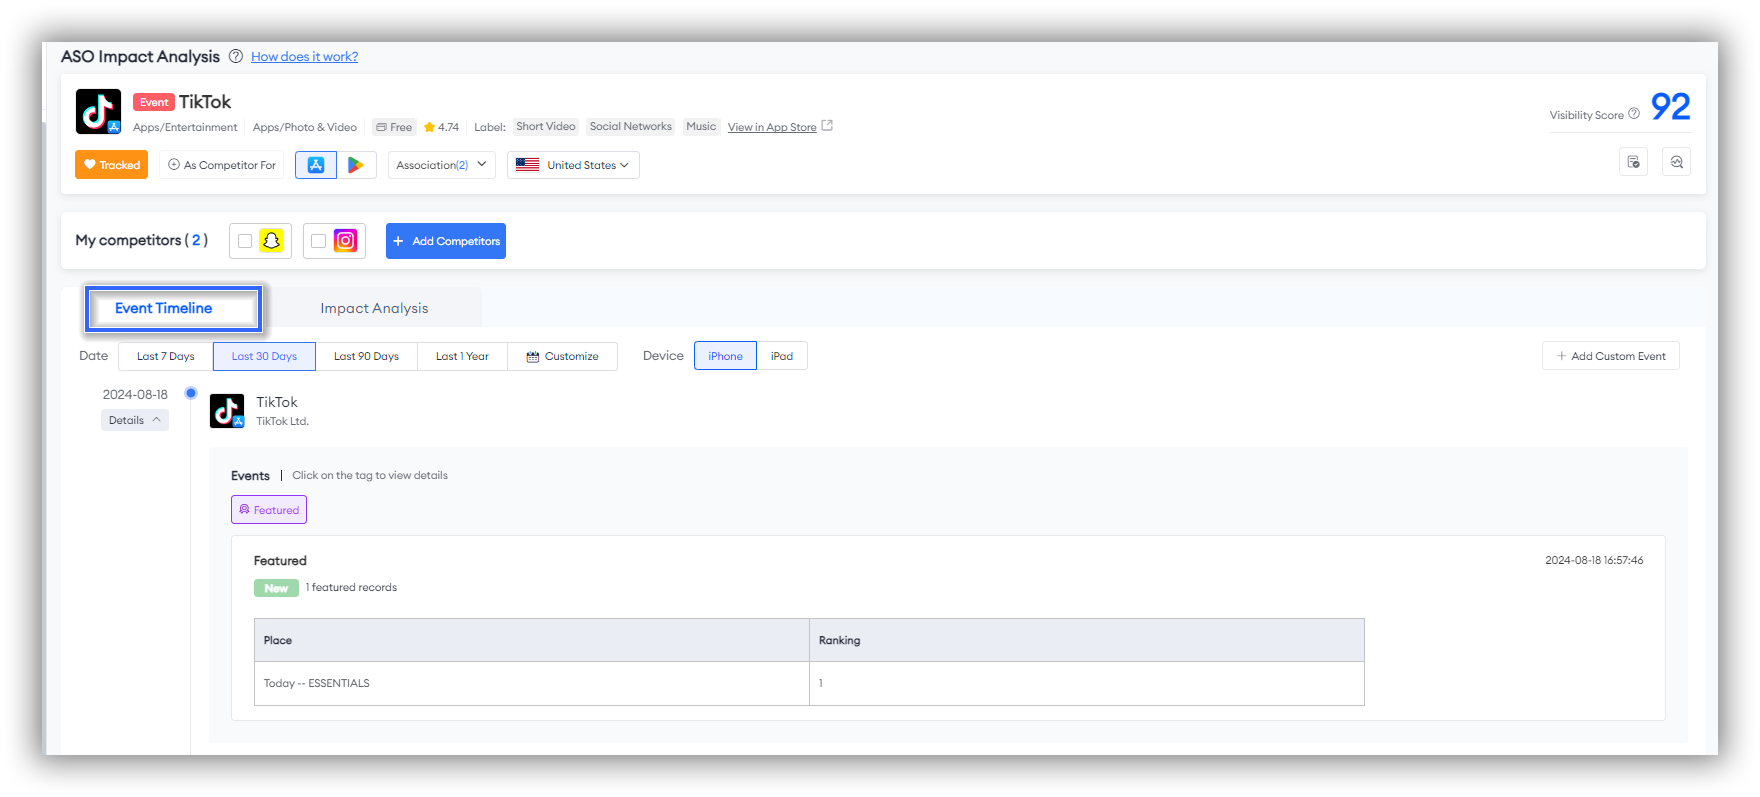
The "Event Timeline" provides an intuitive timeline view, showcasing all significant events and changes to the app at specific points in time. This includes "Text Metadata", "App Behavior" including Versions, In-App Events, In-App Purchases, Meta Ad Creatives, as well as Featured, and "Custom Events", allowing you to understand the app's development history at a glance.
📒Note: If you initially find that scrolling to the bottom results in "No more available." and you cannot continue scrolling, do not worry. This is because you have not filtered by "Date." The page's default "Date" is set to "Last 30 Days." If you want to see more or select a specific time frame, simply choose the date at the top.
In addition to tracking your own app, the Event Timeline can also be used to monitor competitors. You just need to click the blue "+Add Competitors" button at the top to select competitors for comparison.
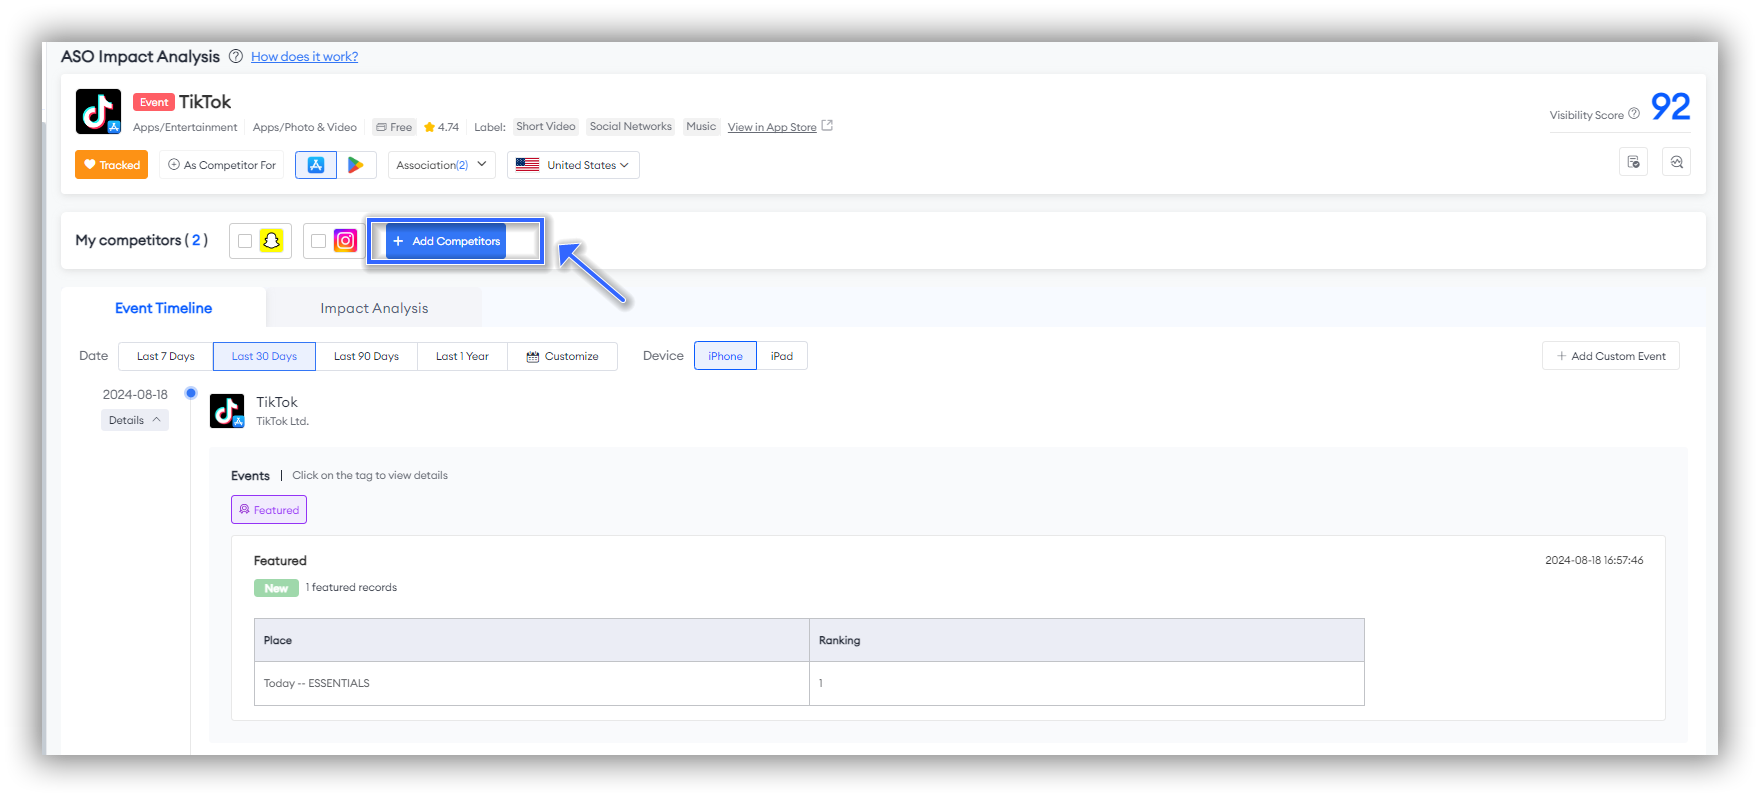
You can view changes and events for competitors at specific points in time and analyze their ASO strategies. This provides you with valuable market intelligence, helping you better respond to competition.
📒Note: Currently, this feature supports up to 1 competitor at the same time.
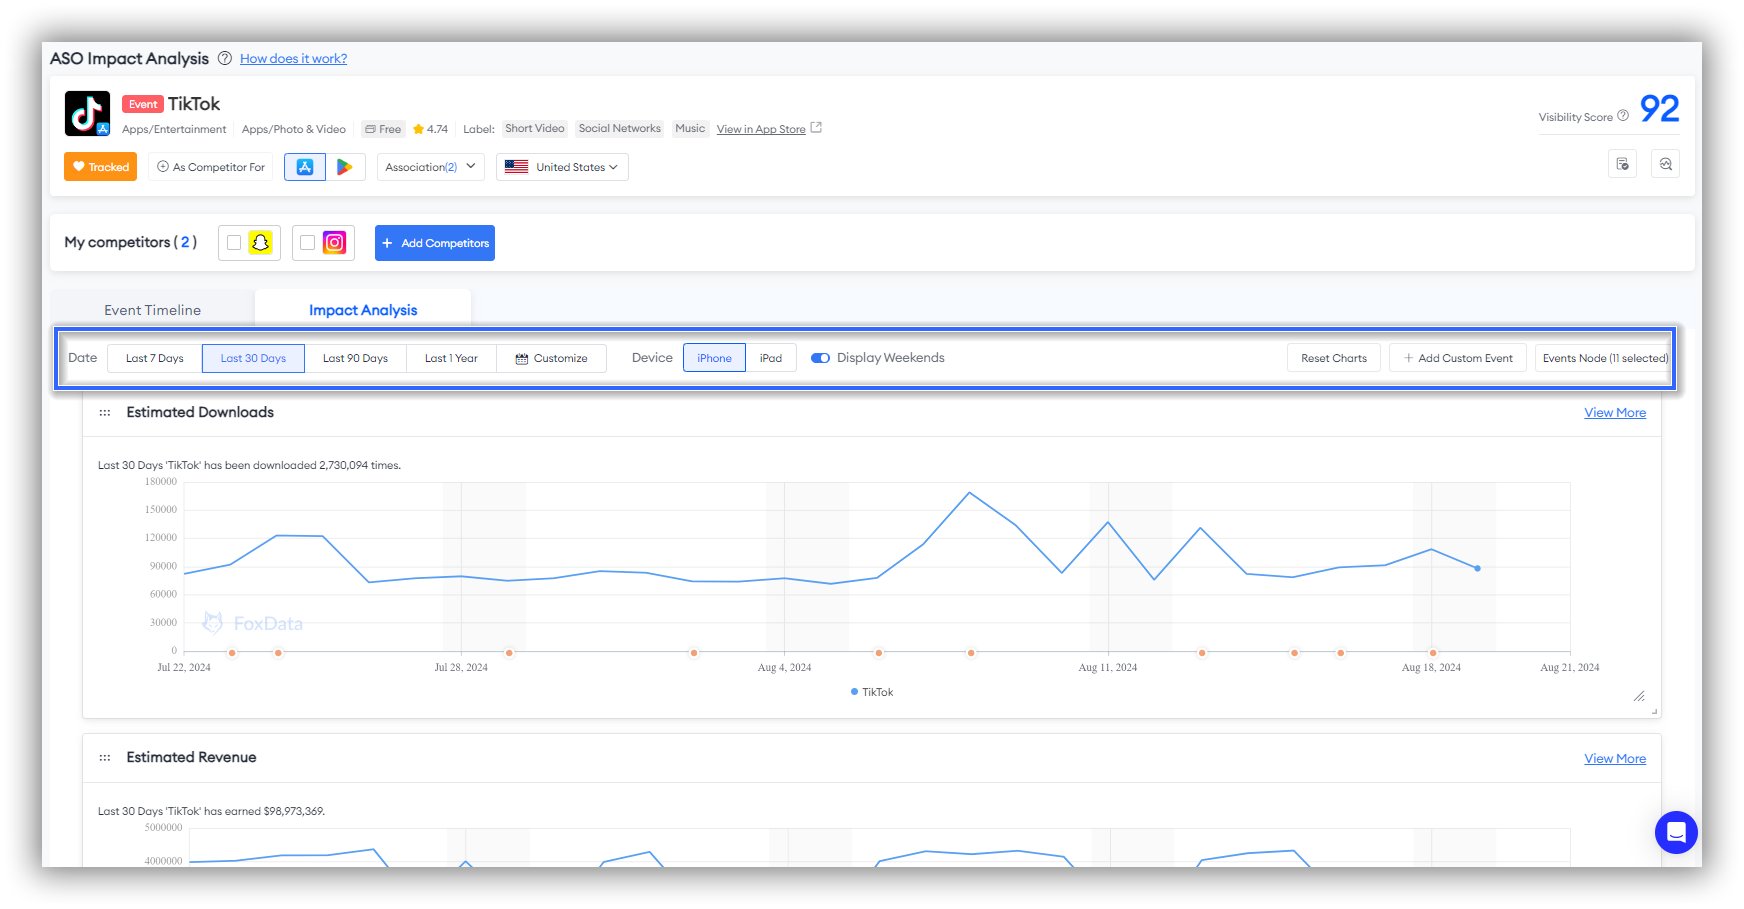
Impact Analysis
This section is located to the right of the "Event Timeline." Simply tap "Impact Analysis" to access it.
Similar to the "Event Timeline," all filter options for this section are located at the top. There, you can filter by time, device, Event Nodes, and Add Custom Event.
 📒Note:
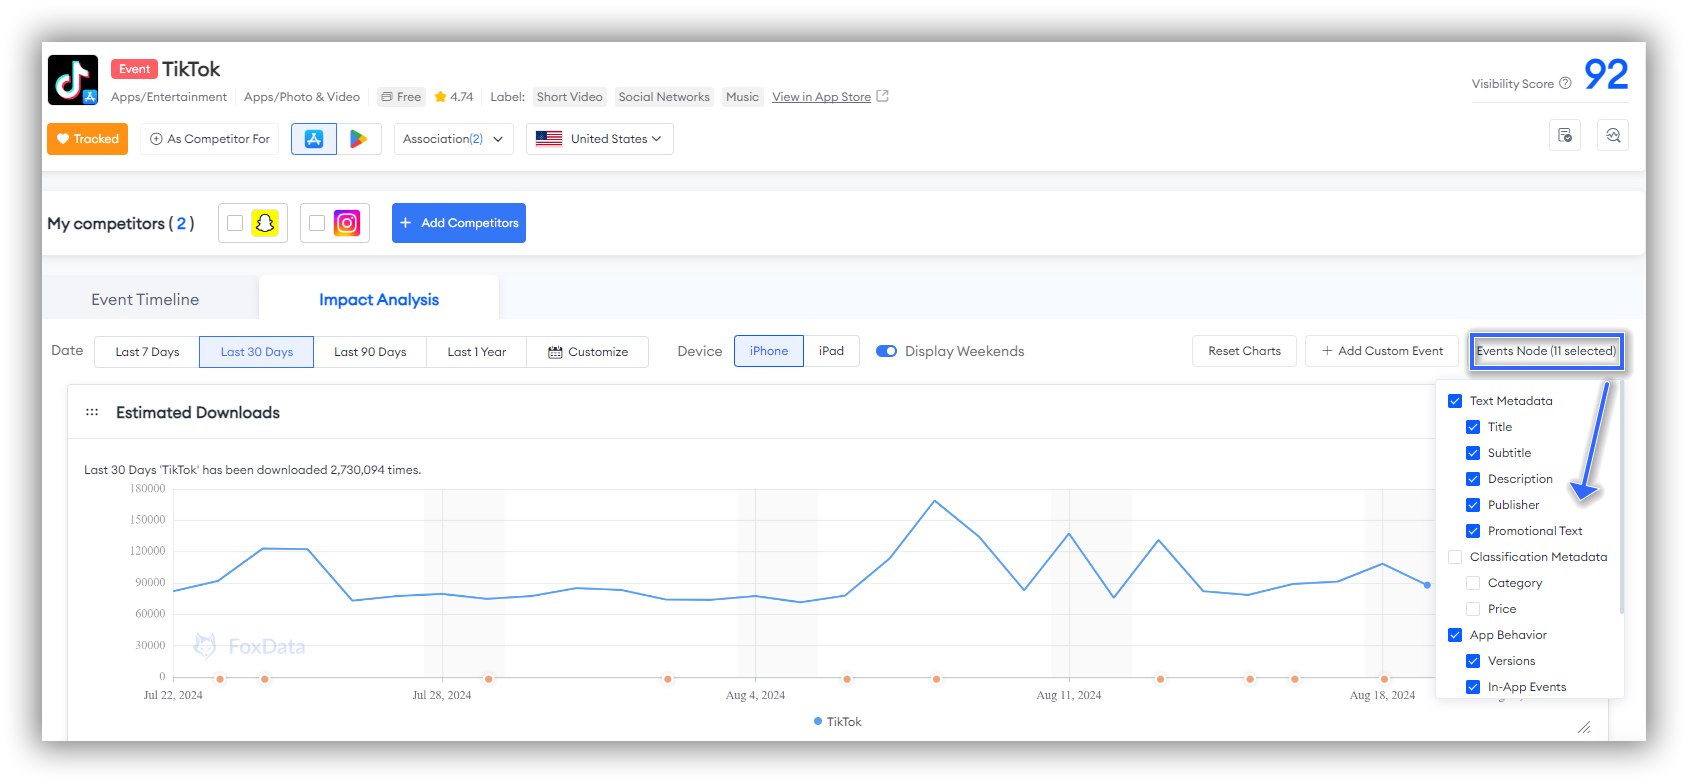
 Be sure to click "Event Node" to select the specific dimensions you want to focus on, such as Text Metadata, App Behavior, Custom Event, as the system initially defaults to only one selected option, "App Behavior - Versions."
"Impact Analysis" displays data associated with the "Event Timeline," including Estimated Downloads, Estimated Revenue, Category Ranking, Ranked Keywords Trend, Ratings Received, and Reviews Received, helping you analyze data from multiple dimensions.
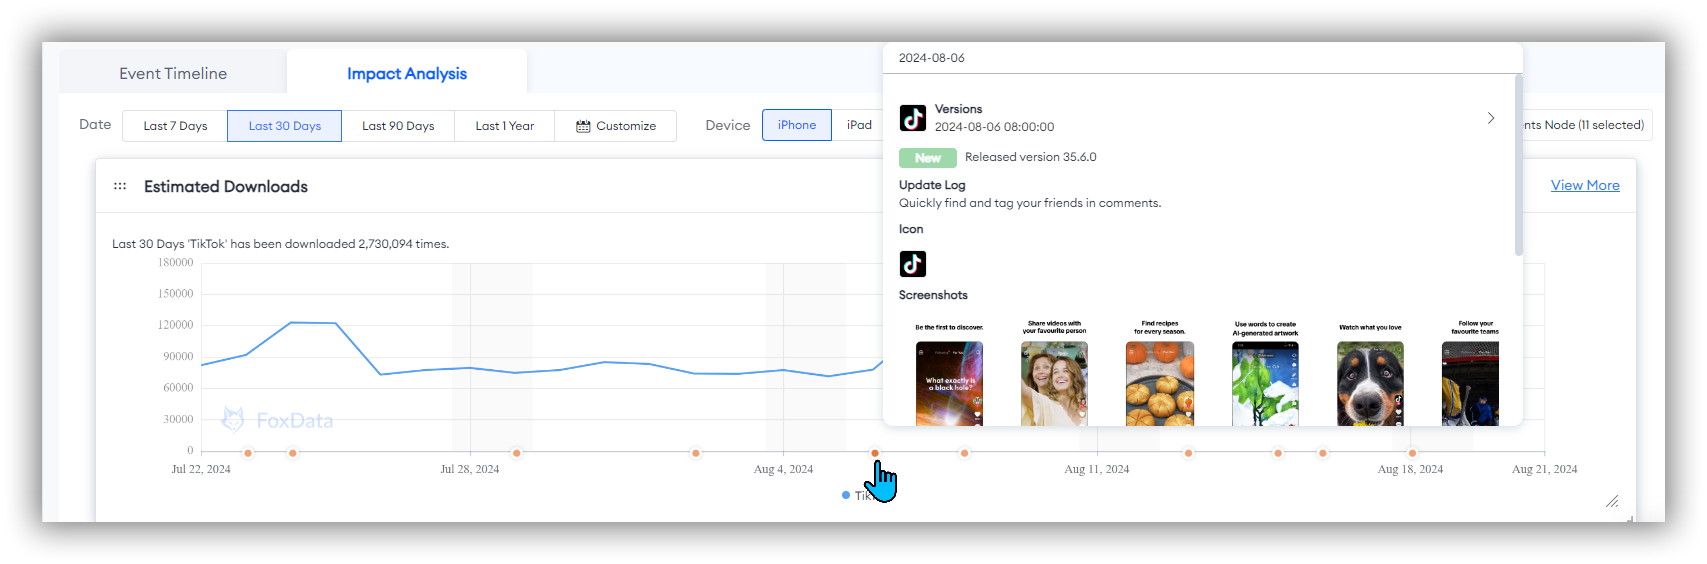
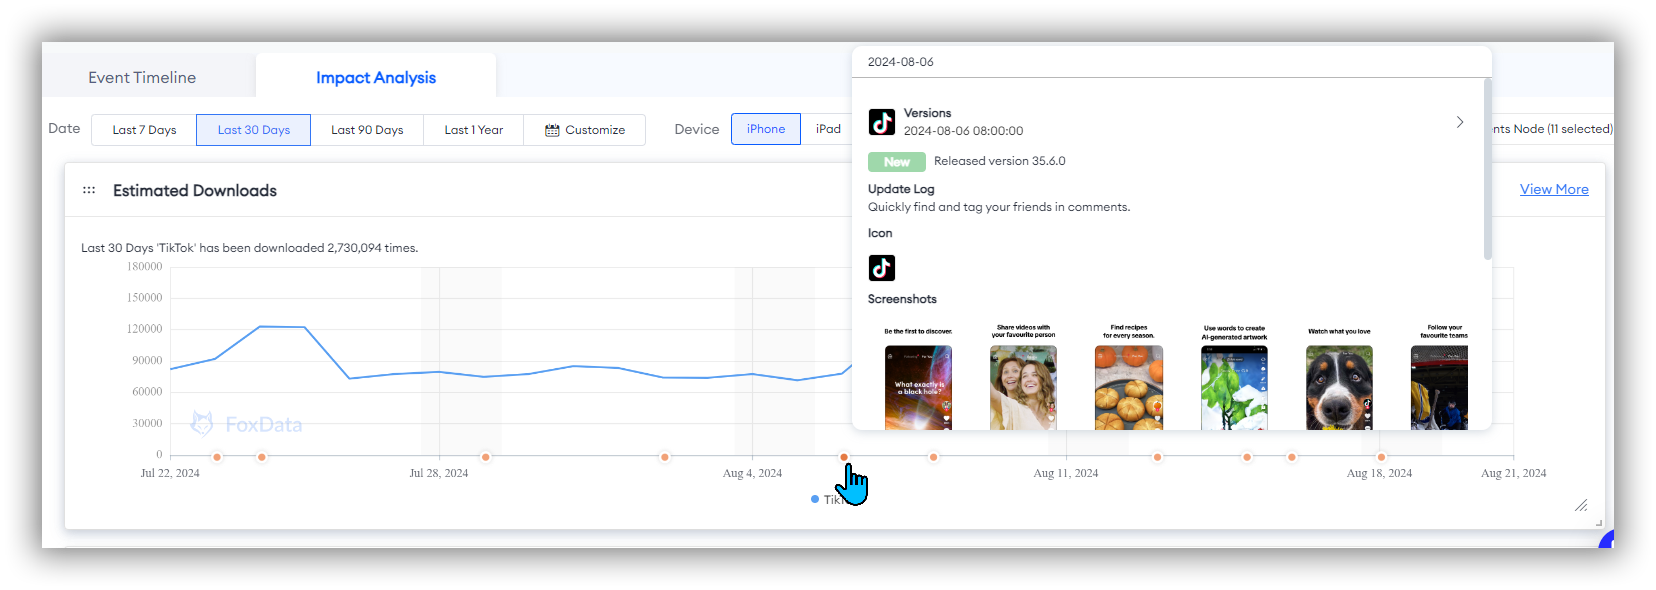
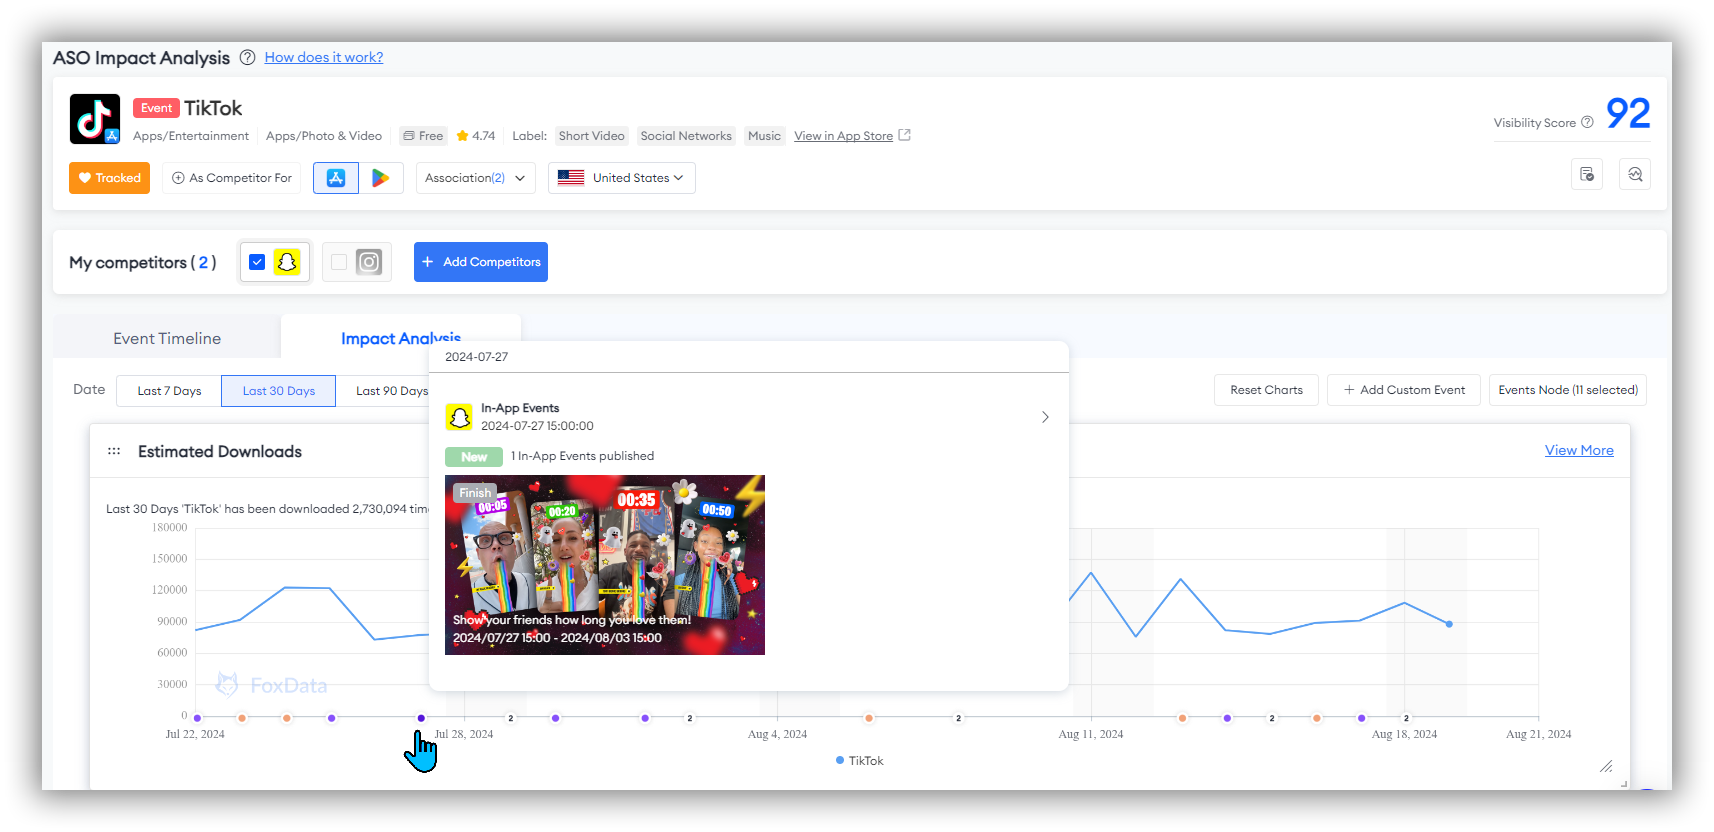
📒Note: The orange dots in the charts for all dimensions represent the "Event Nodes" at that time. Simply hover your mouse over the dot to reveal the event for that day.
Estimated Downloads
Estimated Downloads are the estimates of the actual app downloads in the store.
Estimated download data helps you understand the impact of each change on user download behavior.
By associating with "orange dots - Event Nodes," you can evaluate whether each metadata, creative, or event change has led to an increase in downloads. If there is a significant increase in downloads after an update, it indicates that the update strategy is effective; otherwise, you need to reassess and optimize the strategy.
For example, in the case of TikTok, the version update on August 6th clearly led to an increase in downloads, indicating that this was an effective update for TikTok!
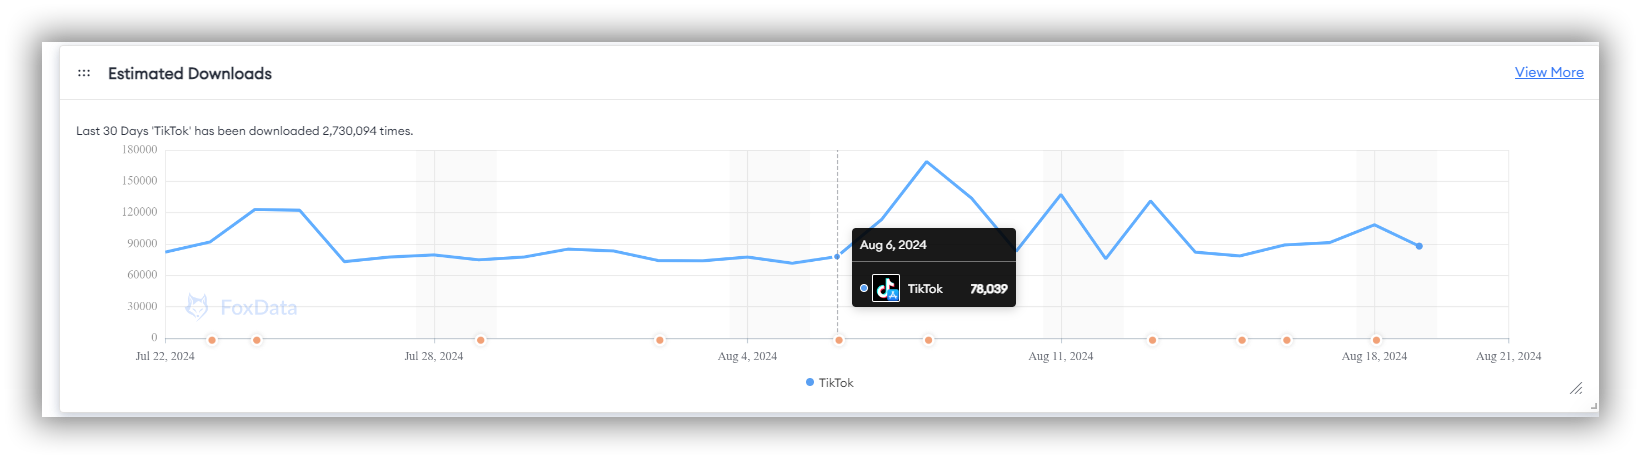
Click "View More" on the image above to see additional data about "Estimated Downloads."
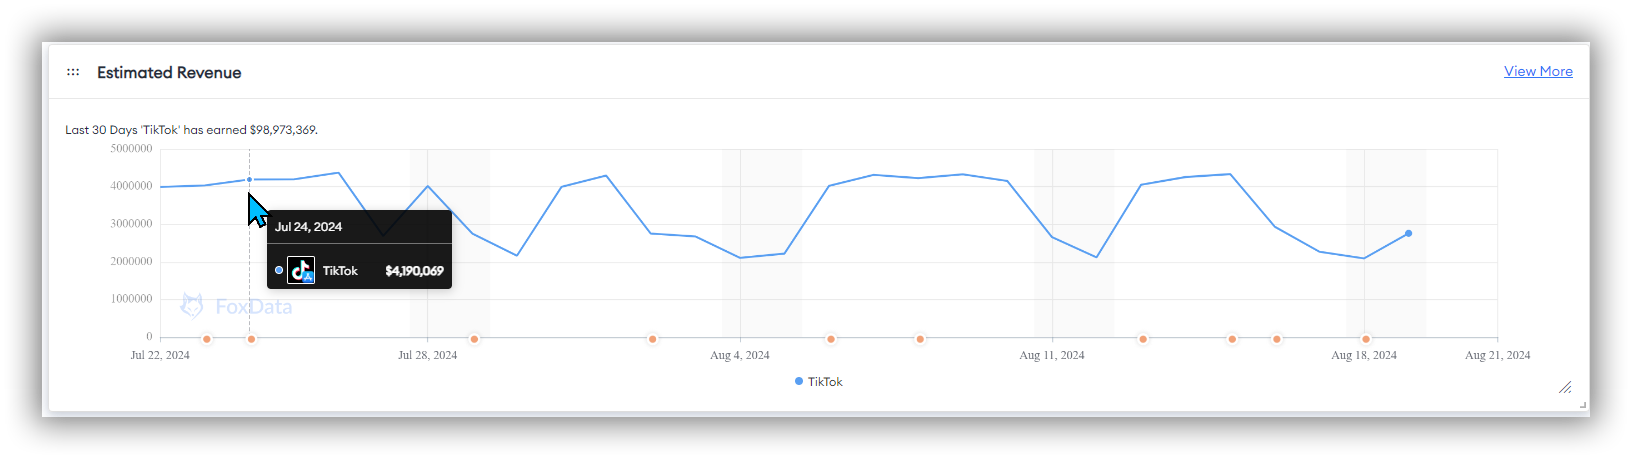
Estimated Revenue
Estimated Revenue are the estimates of the actual app revenue in the store.
Estimated revenue data allows you to evaluate the impact of each change on the app's profitability.
By associating with "orange dots - Event Nodes," you can track which updates have led to revenue growth, thereby optimizing your monetization strategy.
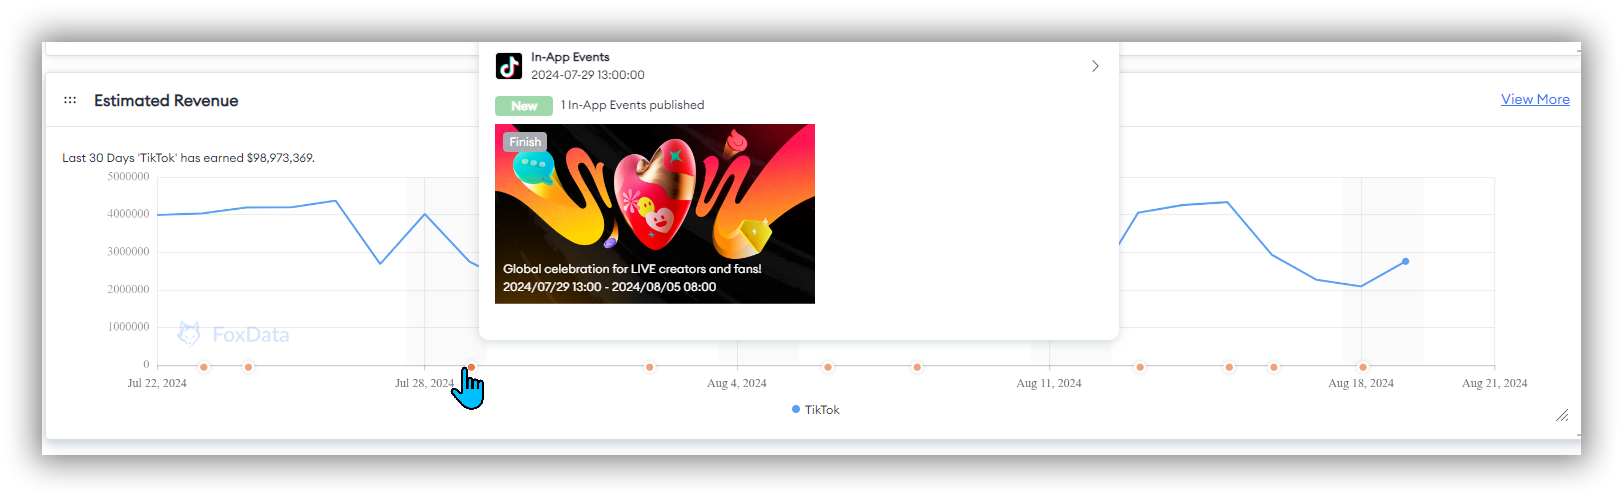
Click "View More" on the image below to see additional data about "Estimated Revenue."
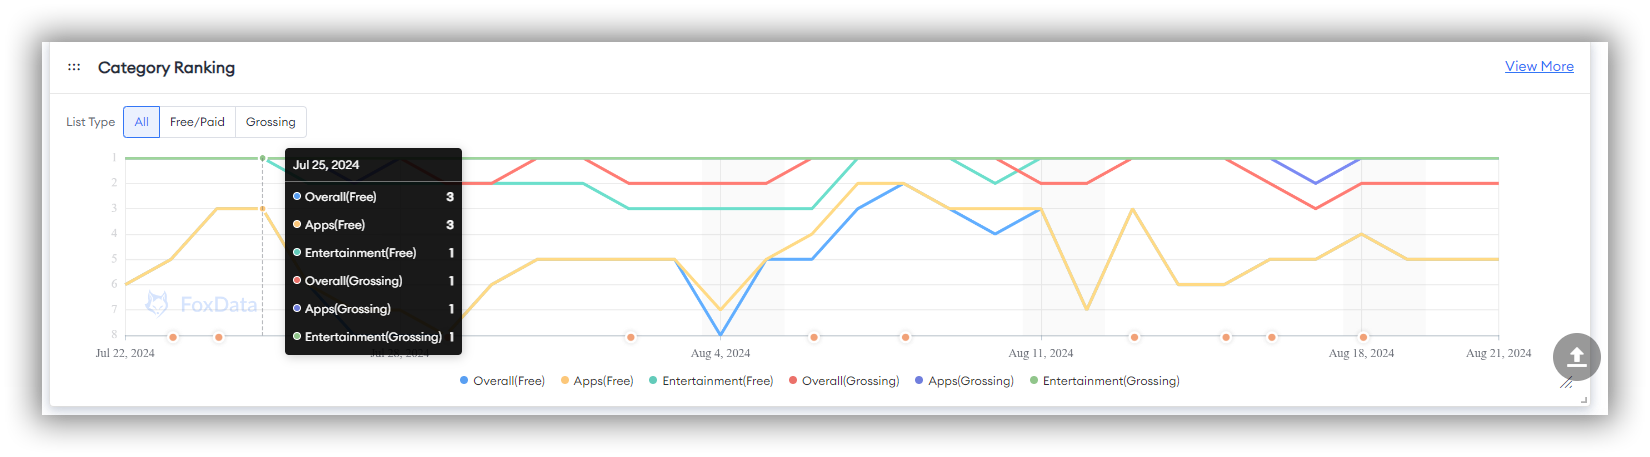
Category Ranking
Category ranking data helps you understand the competitiveness of your app within a specific category. By combining this with "orange dots - Event Nodes," you can evaluate the impact of each change on your ranking and identify which strategies enhance your app's market position.
If the category ranking improves after an update, it indicates that the update has increased the app's market competitiveness; if the ranking drops, further optimization is needed.
Click "View More" on the image below to see additional data about "Category Ranking."
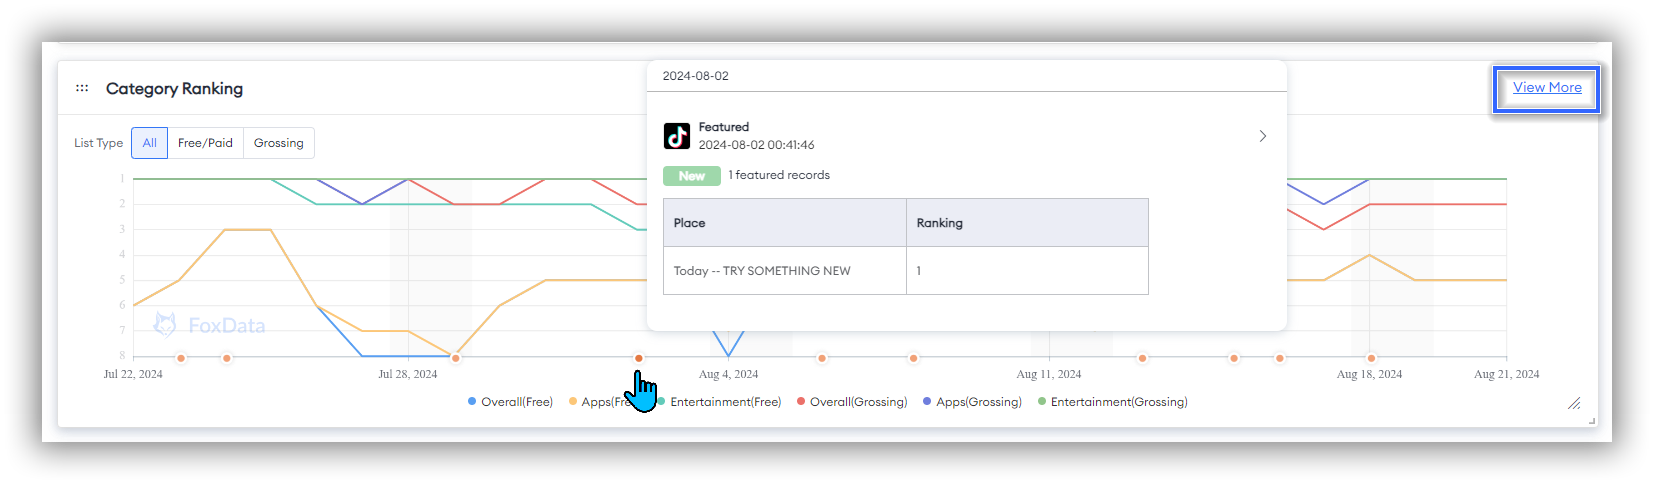
📒Note: The Category Ranking chart system displays all categories by default, but you can choose the categories you want to focus on. Simply click on the specific category below the horizontal axis to deselect the categories you do not wish to follow.
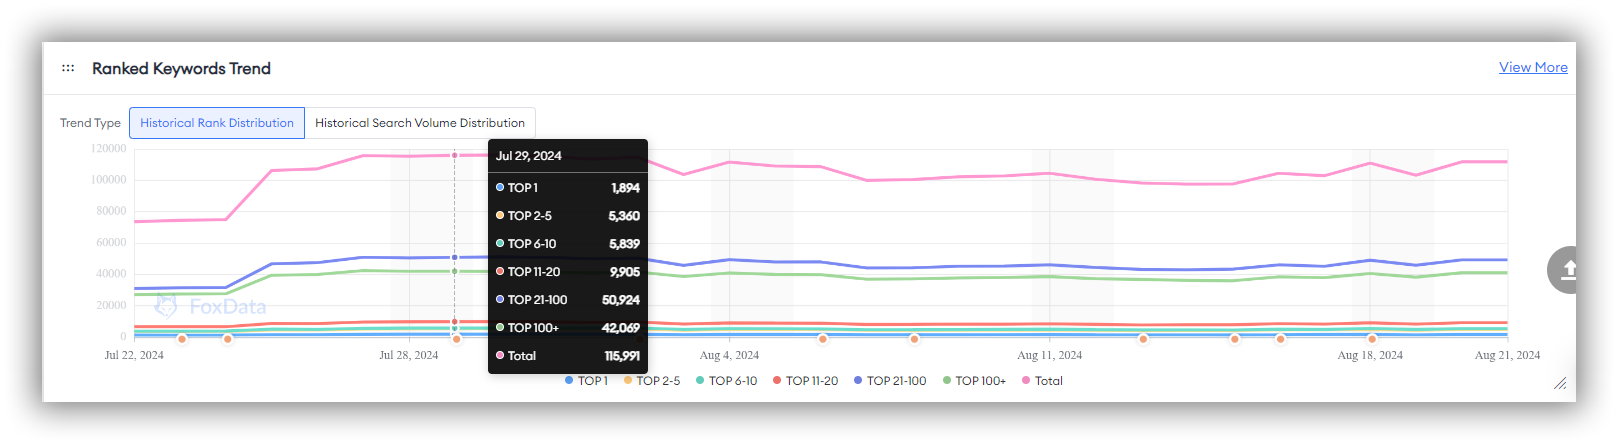
Ranked Keywords Trend
Keyword ranking trend data helps you understand your app's performance in search results. By associating this with "orange dots - Event Nodes," you can track the effectiveness of each keyword optimization and evaluate its impact on search rankings.
By observing changes in keyword rankings, you can identify which keyword optimization strategies are effective, thereby further enhancing your app's visibility.
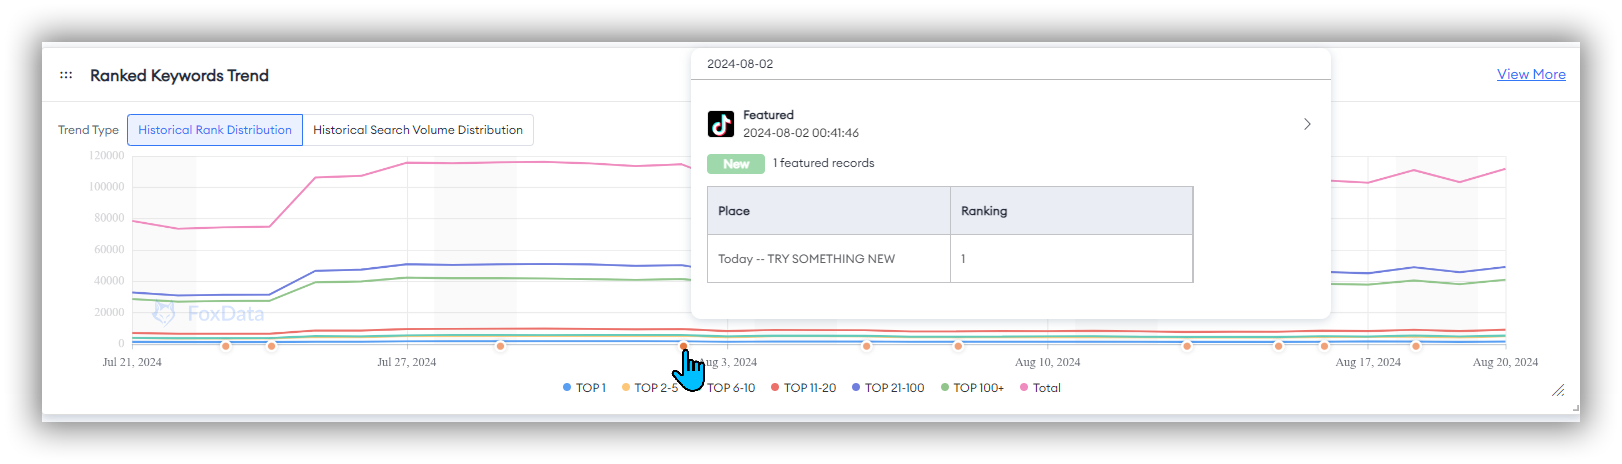
Click the "View More" button below the image to see more data about "Keywords Ranked."
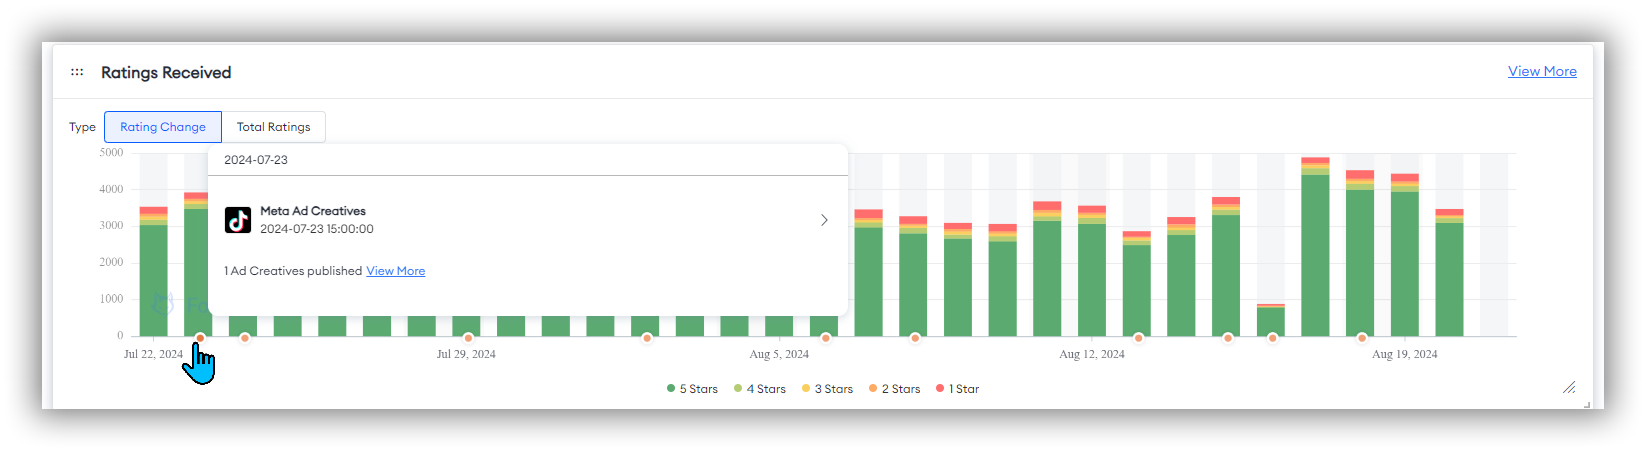
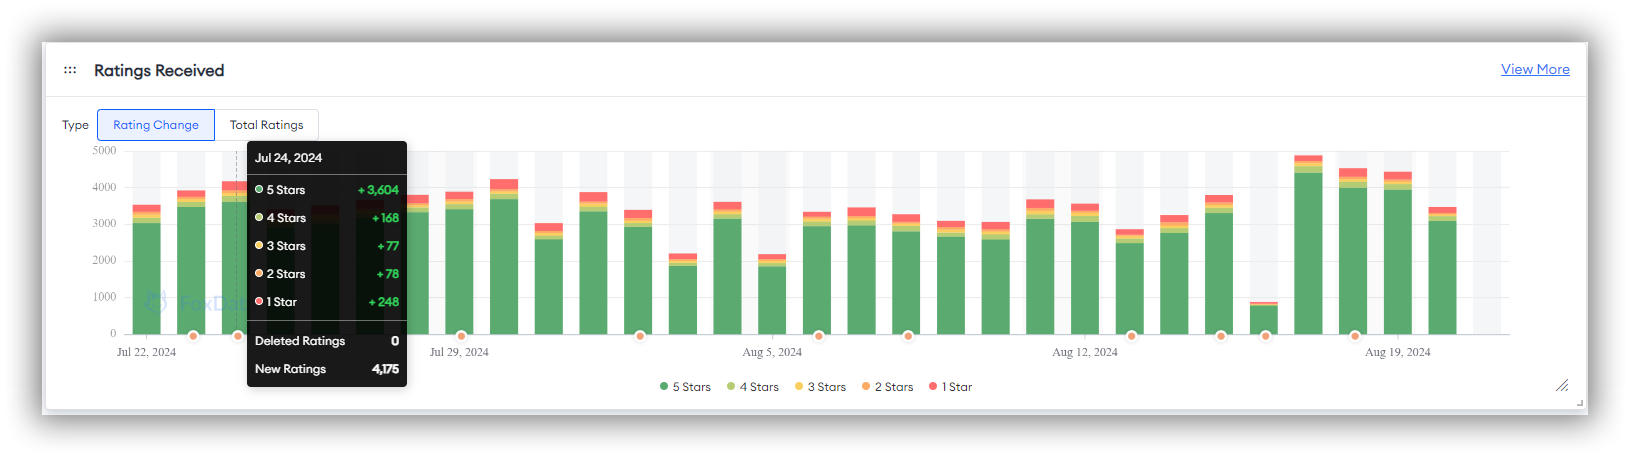
Ratings Received
Received rating data helps you understand user satisfaction with your app. Combined with "orange dots - Event Nodes," you can evaluate the impact of each update on user ratings and identify which changes have improved the user experience.
By analyzing rating changes, you can determine which update strategies have improved the user experience and continue to refine product features and services accordingly.
Click the "View More" button below the image to see more data about "Ratings."
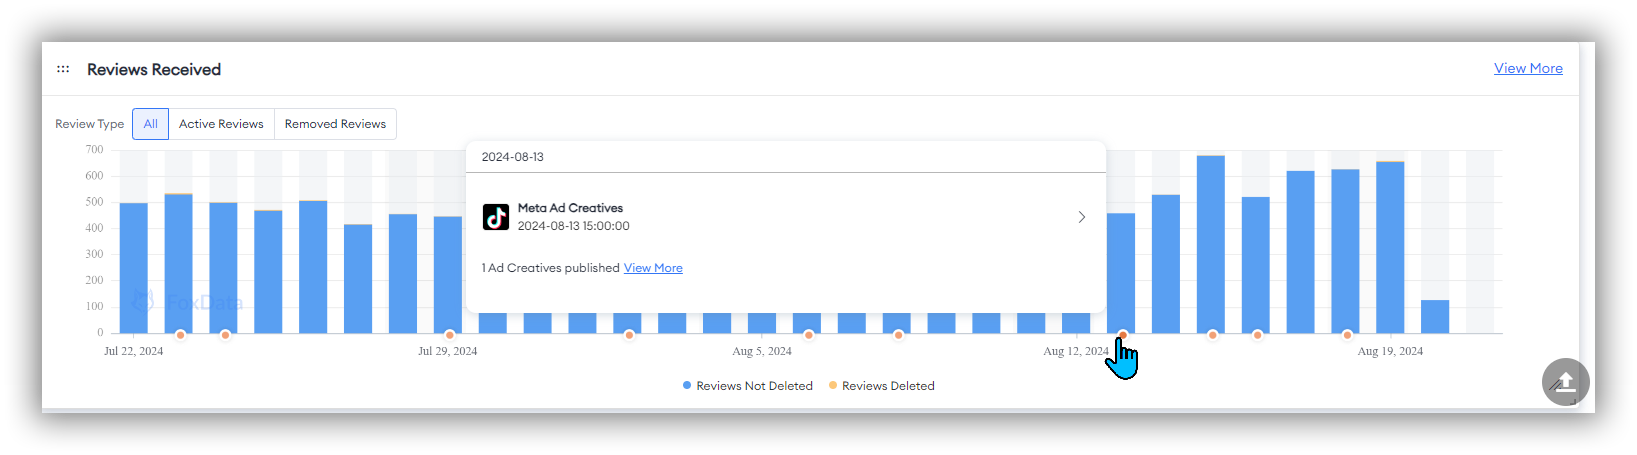
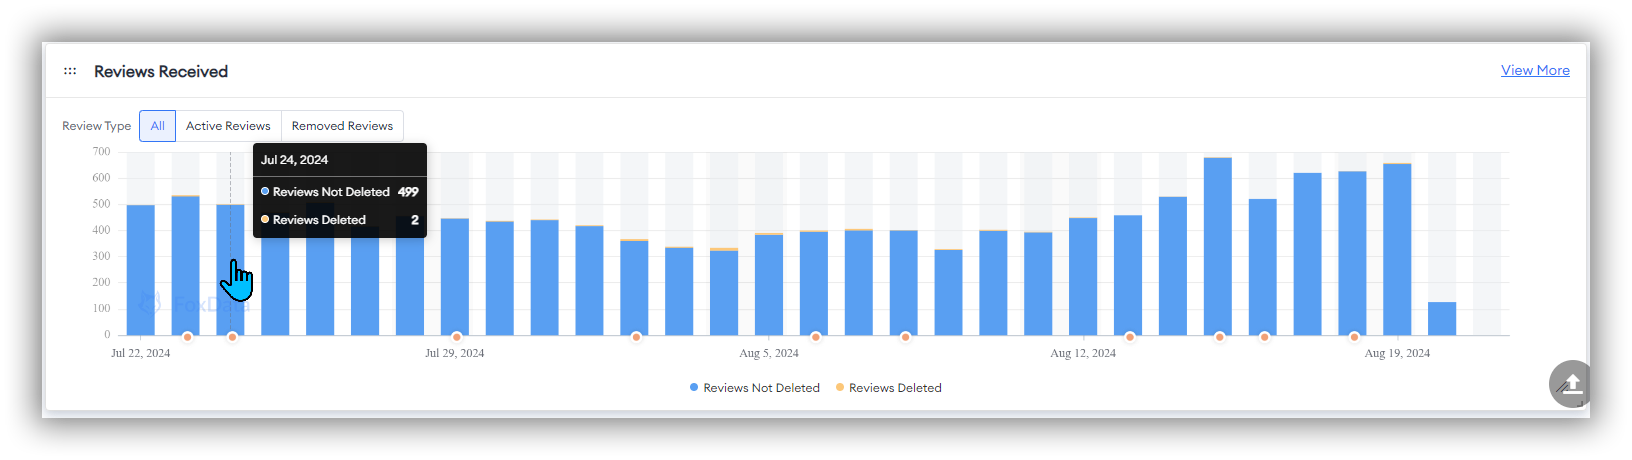
Reviews Received
"Reviews Received" shows the key numerical changes in New Reviews for the selected period, including "Reviews Not Deleted" and "Reviews Deleted." Additionally, this section includes "Active Reviews" and "Removed Reviews," which further present the star rating distribution of the relevant data.
By combining "Reviews Received" with "orange dots - Event Nodes," you can evaluate the specific impact of changes.
The star rating distribution in "Active Reviews" and "Removed Reviews," combined with "orange dots - Event Nodes," allows you to understand users' specific reactions to each update. This helps identify potential issues and areas for improvement, enabling continuous optimization of the app.
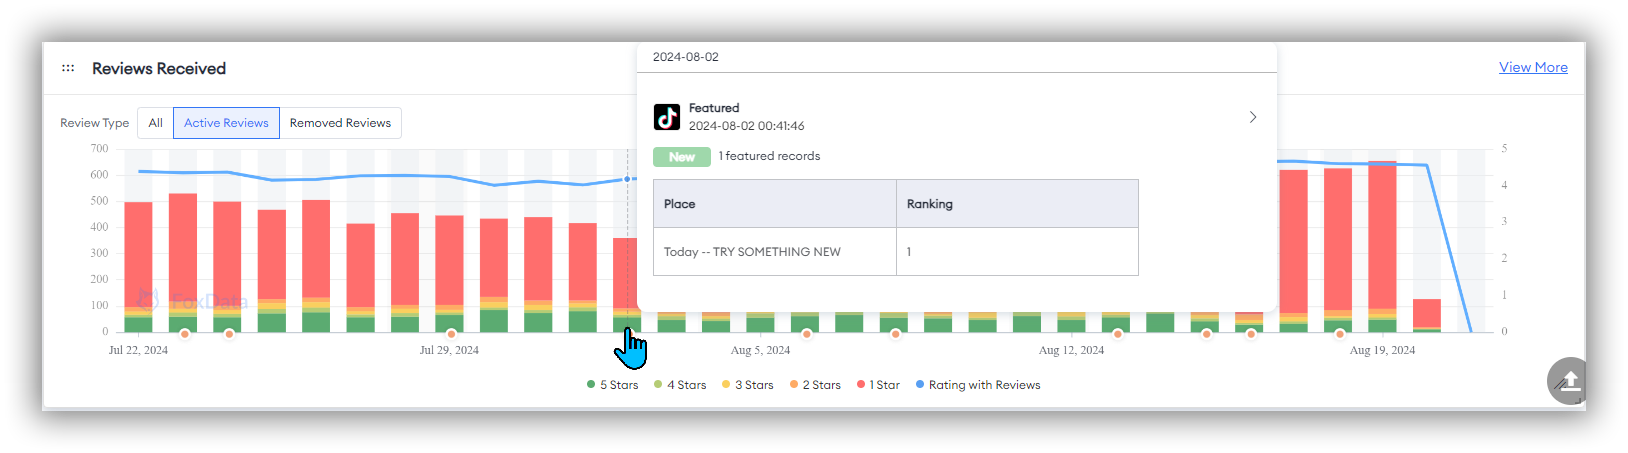
Click the "View More" button below the image to see more data about "Reviews."
👏Expert Tips:
If you want to study competitors, you can directly search for them and then "track" them. Eventually, you can analyze their Impact Analysis within this feature.
If you want to observe whether competitors' "Event Nodes" affect your app's performance, you can directly "+Add Competitors" at the top of the "Impact Analysis" section.
Then, in the charts for Estimated Downloads, Estimated Revenue, Category Ranking, Ranked Keywords Trend, Ratings Received, and Reviews Received, you will see many purple dots representing competitors' "Event Nodes." You can directly observe if there are any abnormal changes in the data around these purple dots.
What is the value of "ASO Impact Analysis"?
ASO Impact Analysis is a powerful ASO tool designed specifically for app store optimization (ASO) researchers to help you manage and optimize app performance more efficiently. Here are the main benefits this feature brings to you:
1. Automated Change Detection and Tracking
ASO Impact Analysis can automatically identify the timing of changes in Text Metadata, App Behavior, Custom Event. This automated detection and tracking significantly reduce the workload of manual recording and analysis, allowing you to focus on optimizing and executing strategies.
2. Assessing the Impact of ASO Updates
ASO Impact Analysis helps you evaluate the actual impact of each ASO update, enabling you to make more informed decisions based on data.
By analyzing whether events and changes have led to improved rankings, increased downloads, revenue growth, and better ratings, you can more accurately determine which optimization strategies are effective.
3. Identifying Competitor Strategy Changes
You can automatically identify changes in competitors' Text Metadata, App Behavior, and Custom Events during periods of abnormal performance, such as sudden increases or decreases in downloads. This allows you to quickly track and understand competitors' ASO strategy changes, enabling you to adjust your own strategies promptly to respond to market changes.
ASO Impact Analysis provides ASO researchers with a comprehensive, automated, and efficient tool, helping them make smarter optimization decisions in less time and significantly enhancing app market performance.
FAQs
Q: What is the main purpose of the "ASO Impact Analysis" feature?
A: ASO Impact Analysis automates change detection, evaluates ASO update impacts, and identifies competitor strategy changes, enhancing app performance management and optimization for researchers efficiently.
Q: Can I utilize the "ASO Impact Analysis" to analyze my competitors?
A: Absolutely yes. You can also choose the "+Add Competitors" option in the top left corner of the page to compare and analyze competitors with your app. Additionally, you can select "Recommended Competitors" in the top right corner for a separate "ASO Impact Analysis" analysis of the competitors.
Q: Can I select a custom date range when filtering dates?
A: Of course. After the date filter option, there is a "Customize" label and icon that allows you to select a custom date range in both "Event Timeline" and "Impact Analysis".
Q: Why does the bottom of the "Event Timeline" in my app show "No more available"?
A: When you're using the "Event Timeline" section, FoxData sets the default time dimension to 30 days. The "Event Timeline" shows the Events within this time frame. You can check the time dimension you've selected at the top. Choosing a longer time dimension will display more Events.
Q: Is there a tutorial on how to use the "ASO Impact Analysis" feature?
A: Yes, FoxData offers comprehensive tutorials and support documentation to help you make the most of the "ASO Impact Analysis" feature. You can find them in FoxData blogs or help center.
All content, layout and frame code of all FoxData blog sections belong to the original content and technical team, all reproduction and references need to indicate the source and link in the obvious position, otherwise legal responsibility will be pursued.